Funding Measures and the June Ballot

Last week’s primary election garnered considerable statewide and national attention, with much of the focus on the governor’s race and contested congressional seats. Further down the ballot, however, voters were asked to decide on millions of dollars of local tax, bond, and fee initiatives. On the whole, these measures enjoyed considerable success across the state.

We found that Californians voted on 107 local tax, bond, and fee measures, representing the range of fiscal tools that local jurisdictions can use to raise revenue and borrow funds. Bond measures were the most popular, with 42 different local governments seeking voter approval (37 K–12 school districts; 2 community college districts; 3 cities). There were also 32 parcel tax measures; those related to K–12 schools (12) and fire/public safety (10) were most common. Ballots also included proposals to impose or increase taxes on cannabis (13) general sales (9), gross business receipts (2), and hotel stays (3). And there were proposals to raise utility fees (3), business license fees (1), and bridge tolls (1).

Most of the long list of funding proposals passed—but just putting a measure on the ballot did not guarantee success. Although counties are still counting some ballots, which could affect a race or two, at this time, we observe the following:

  • Overall, voters passed 76 of the 107 measures.
  • Of the 39 school bond measures, 30 passed. Proposition 39, passed in 2000, lowered the threshold for passing school bonds from a two-thirds majority to 55%. Had these measures been subjected to the previous standard, only 11 would have passed. The 19 measures approved under the current standard increased borrowing for investment in public schools by $1.8 billion.
  • On the heels of one of the states’ worst seasons of wildfires on record, California voters held the line on parcel taxes intended to support fire protection, with only 3 of the 9 measures passing.
  • All 13 of the cannabis tax proposals passed overwhelmingly.

California touched off a revolt against taxes 40 years ago. Primary voters in 2018 generally voted for increases but were relatively discriminating in their support, depending upon the type of tax and its intended purpose. This discernment comes at a time when the state’s economy is growing and unemployment is low. It will be interesting to see what happens in November, when we expect to see even more funding measures on the ballot.

The Governor’s Revised Budget Targets Tuition at UC and CSU

Governor Brown’s May Budget Revision has short- and long-term funding implications for both CSU and UC. The annual May Revision to the governor’s January budget proposal reflects an unanticipated revenue increase of $7.6 billion. The revised budget does add $100 million in one-time funding for deferred maintenance at each system as part of a larger infrastructure spending plan. However, while increases are proposed for other major spending areas, funding for UC and CSU remains unchanged from the January budget: each system is still slated to receive $92.1 million from the General Fund. This is in contrast to revised budgets in previous years that increased funding for both systems by 3% to 4%. Moreover, if UC and/or CSU raise tuition, the Department of Finance would be allowed to reduce each system’s funding by an amount equal to the additional revenues raised.

This proposed policy has two goals: it creates a disincentive to raise tuition and is meant to account for additional state costs incurred when tuition increases. California’s primary financial aid programs— the Cal Grant A and B entitlements—cover tuition for more than 300,000 students, most of them enrolled at UC and CSU. For students who meet financial and academic requirements, UC or CSU tuition is fully covered for the equivalent of four years for Cal Grant A and three years for Cal Grant B. Consequently, when UC and/or CSU raise tuition, the state must cover the additional cost. Since the Cal Grant program’s inception in 2000, tuition increases in response to state funding cuts coupled with a rise in the number of eligible students has increased annual program costs from a little more than $800 million to nearly $2 billion.

Although the governor’s proposal, coupled with a healthy state funding reserve, could help keep tuition flat in the near future, it may have unintended consequences for large numbers of students. UC and CSU allocate one third of the revenue from tuition increases to institutional aid that augments Cal Grants and Federal Pell Grants to cover tuition for more than half of their students. Moreover, restricting state allocations to the two systems while also discouraging tuition increases could prompt each institution to turn away eligible students (in fact, CSU turned away 32,000 students last fall) or ratchet up eligibility requirements.

In the longer term, restricting access to UC and CSU could have a negative effect on California’s economy. If the state hopes to meet growing demand for skilled workers, it must produce 1.1 million more bachelor’s degrees by 2030. Achieving this goal will require a long-term funding plan that addresses not only the cost of tuition but also the full cost of attending college as part of a larger effort to increase access and improve outcomes for all students.

New Admission Requirements at the University of California?

The University of California (UC) is considering revising its eligibility standards for admission, focusing on requirements for science education. California changed its K–12 standards in this area five years ago, when the State Board of Education adopted the Next Generation Science Standards (NGSS). UC must decide whether and how to align the NGSS with the a–g requirements—a set of courses students must complete in order to be considered eligible for admission to UC. A change in science requirements was proposed by the UC Board of Admissions and Relations with Schools and was approved by the UC Academic Senate earlier this year.

The NGSS has profound implications for science curriculum and instruction in high schools. Currently, to meet the a–g requirements, students must take two science courses from three core disciplines: biology, chemistry, and physics. But the NGSS includes four science categories: physical sciences; life sciences; earth and space sciences; and engineering, technology, and applications of science.

Changes approved by the UC Academic Senate include increasing the minimum science requirement from two to three years. UC would continue to require two years of work in at least two of three disciplines: biology, chemistry, and physics. Students may take a third course within these disciplines or in other science disciplines identified by the NGSS.

If the UC Regents vote on and approve the recommendations of the UC Academic Senate, the change will take effect in the fall of 2023—meaning that students entering high school in the 2019–20 school year will be subject to the new requirements. (CSU is in the process of updating its science requirements—which are currently similar to those of UC—and may follow UC’s guidelines.)

Some high schools would need to make changes to align their curriculum with the NGSS. One area of concern is the relatively low number of course-offerings in science among small and rural schools. PPIC’s work has shown that not every high school offered the entire a–g sequence in science in 2016–17; small and rural schools were much less likely to do so. Another area of concern is staffing, as a teacher shortage has left California schools struggling with large class sizes for years. Finally, ensuring awareness of these changes will be important. Parents and students should be informed of the new requirements with adequate time and detail to be able to plan accordingly.

Under NGSS, science course sequencing in high school may affect whether and how students meet the proposed a–g requirements. PPIC researchers are examining early implementation of the NGSS in the K-12 system and will discuss findings in an upcoming report. Moving forward, more research is needed to understand the implications of any new a–g requirements for high school graduates’ eligibility for UC and CSU.

Guaranteeing Transfer Admission to the University of California

Improving transfer from community colleges to four-year universities is an important step in meeting the state’s future workforce needs. In April 2018, the California Community College Chancellor’s Office and the University of California (UC) entered an agreement to guarantee admission to community college students who meet certain qualifications. If sufficient funding and space exist, the guarantee could take effect in fall of 2019.

There are already several pathways for community college students to enroll in UC. For example, all but three campuses (Berkeley, Los Angeles, and San Diego) have a guaranteed admission program for students from certain community colleges. UC has also established academic road maps in 21 majors to help prepare students who plan to apply to transfer. However, completing an academic road map does not guarantee admission.

The new plan would guarantee admission for eligible community college students to a UC campus, but not necessarily to their preferred campus. Specifically, it creates a referral pool—a way to redirect students away from full campuses toward campuses with space. This transfer referral pool would be similar to UC’s referral pool for freshmen. At this time only one campus, UC Merced, accepts applicants from the freshman referral pool. In 2017, thousands of eligible students were redirected to UC Merced, but few actually enrolled.

How might a referral pool work for transfer students? Currently, three campuses—Santa Cruz, Riverside, and Merced—are having a particularly difficult time enrolling sufficient numbers of transfer students. These campuses would need to absorb redirected transfer students. However, it’s not certain that redirected students would enroll, even if offered admission. Right now, many transfer applicants decline their offer of admission to these campuses.

To improve transfer pathways for community college students, UC and the state should consider both expanding capacity at high-demand campuses and exploring ways to encourage students to attend other campuses.

Out-of-State Students and Tuition at UC

After the Great Recession, growing demand among out-of-state students, including international students, helped the University of California (UC) offset funding cuts. But as nonresident tuition goes up, and as UC places caps on enrollment that trend may be changing—raising questions about the stability of what’s now an important source of university revenue.

The recession brought heavy cuts to state education budgets, and public universities in California and nationwide increased tuition substantially to compensate. UC implemented cost-saving strategies and looked for other sources of revenue. Campuses began enrolling more out-of-state students, who pay an extra $20,000 or more in supplemental tuition every year. As a result, nonresident applications, admits, and enrollees all more than doubled from 2010 to 2016, and out-of-state students became a reliable—and growing—source of revenue. UC states that this additional revenue helps provide funding to enroll California residents.

From 2011 to 2014, tuition was frozen for all students as the state recovered from the recession, but nonresident tuition started to grow again in 2014. By 2017, nonresident tuition surpassed $41,000, leaving it comparable to the most expensive public universities in the nation (Michigan: $47,476; Virginia: $46,643) and to the most expensive private schools in the state (Stanford: $48,987; University of Southern California: $53,448). UC tentatively approved another increase in March that would put nonresident tuition at about $42,600, but may scale that back if the state kicks in more funds.

However, growth in out-of-state demand may be starting to slow at UC. The number of applications from out-of-state students, which had grown steadily since 2010, dropped in 2017, though it then rebounded to previous levels in 2018.

Nonresident Tuition Figure

There are many possible reasons for the potential slowing growth in demand among out-of-state students. UC has put a yearly cap on nonresident enrollment and stopped giving out-of-state students financial aid, which means they pay the full price of tuition plus living expenses, about $61,000 total. In contrast, private institutions do give financial aid, so even with higher tuition, they may be cheaper for some students overall. For example, the average estimated net cost for students who receive financial aid at the University of Southern California is $32,932, and at Stanford the net cost is $16,695.

Given the cap on out-of-state students—as well as the potential slowdown in the growth of demand—the University of California may have to look to other sources to increase revenue for its campuses.

Federal Spending Bill Boosts Education Funds in California

Congress recently agreed on a $1.3 trillion spending bill to keep the federal government operating through September 2018. Nearly six months behind schedule, the omnibus spending bill includes a $3.9 billion increase for the US Department of Education (DOE), even though the president had proposed a $9 billion (13%) budget cut that involved scaling back or eliminating more than 30 DOE programs. Since funding for most of these programs is based on student headcounts, California is expected to receive more federal money this year.

One contentious issue in the president’s budget was a $1.4 billion increase for public and private school alternatives. Congress rejected increases for the new Furthering Options for Children to Unlock Success grants—the president’s signature proposal—and the Education Innovation and Research program. Instead, it increased funding for the charter schools grant program by $58 million, a much smaller amount than the president—and Secretary DeVos—had proposed.

The spending bill also excluded a proposed 15% funding cut for Perkins grants and the elimination of the Preschool Development grants. In the previous school year, California received $113 million for Perkins grants, which support career technical education programs in high schools and community colleges. California is also expected to receive more money from the Department of Health and Human Services for programs such as the Child Care Development Block Grant and Head Start.

Congress voted to maintain funding for Supporting Effective Instruction State Grants, which the president also wanted to eliminate. Commonly referred to as Title II, this program supports the recruitment and development of high-quality teachers and principals, with a particular focus on serving students from low-income families. Title II is the third-largest DOE program, and California schools received more than $200 million Title II funds in the most recent school year.

At the postsecondary level, Congress increased funding for the Federal Supplemental Educational Opportunity Grant by $107 million. The president proposed eliminating this $732 million program, which provides need-based grants to help low-income undergraduate students with college costs. The spending bill also increased funding for the federal work-study program by 14%, reversing the president’s proposal to cut it by almost half.

Historically, federal funds have been a small fraction of school district revenues, but they have become an increasingly important funding source, particularly for high-need schools. All in all, the new spending bill will support California’s ongoing efforts to improve educational outcomes for all of its students.

Parents Have High Educational Hopes for Their Children—Can California Keep Up?

The most recent PPIC Statewide Survey on Californians’ views on education finds that the vast majority of parents (83%) hope their children will obtain at least a bachelor degree—in fact, nearly half (48%) want their children to earn a graduate degree. These parental aspirations are relatively constant across race/ethnicity, political ideology, and income. They are also fairly consistent across regions—although, among the regions represented in the survey, parents in the Central Valley are the least likely (77%) and San Francisco Bay Area parents are the most likely (96%) to want their children to earn college or graduate degrees. These parental aspirations may be linked to student course taking and performance in high school. Over the past decade, there has been a 48% increase in completion of the coursework that makes California high school graduates eligible for UC or CSU; in 2015, 43% of the state’s graduating class met this eligibility requirement.

Moreover, these aspirations are aligned with urgent state needs. If current economic and educational trends persist, California will fall 1.1 million bachelor’s degrees short of economic demand by 2030. The state economy is increasingly reliant on high-skill workers, but most K–12 students do not stay on track to obtain a bachelor’s degree, let alone a graduate degree. Previous PPIC research has shown that for every 1,000 9th graders in California, only 305 will earn a bachelor’s degree at UC or CSU.

Parental Aspiration Figure

California has a long way to go in meeting demand for higher education, but there are signs of progress. The state has been reinvesting in public higher education, increasing undergraduate enrollment, and improving student outcomes—and the public education systems are increasingly willing to work together to streamline the higher education pipeline. California will need continued innovation and significant investment in facilities and faculty in order to accommodate the kind of enrollment growth that can keep up with economic demand and individual aspirations. Moreover, given the large share of Californians who see advanced degrees as important, the state may want to begin a more robust discussion about graduate school, along the lines of its recent focus on career technical education.

Testimony: How an Integrated Data System Could Improve Education

Jacob Jackson, research fellow at the PPIC Higher Education Center, testified before the Senate Committee on Education in Sacramento today (April 11, 2018). Here are his prepared remarks:

Thank you Chair Allen, Vice Chair Wilk, and members of the committee for the opportunity to testify today. My name is Jacob Jackson and I am a research fellow at the Public Policy Institute of California. PPIC is a nonprofit, nonpartisan policy research organization and does not take positions on legislation. My comments today are about the potential benefits of a statewide, longitudinal student data system and are based on research that PPIC and others have conducted.

Right now, educational institutions and government agencies already collect plenty of data. The California Longitudinal Pupil Achievement Data System (CALPADS) tracks students from kindergarten through grade 12. Each public system of higher education (the community colleges, California State University, and the University of California) keeps track of its students while they are attending that institution. And the Labor and Workforce Development Agency collects data on the earnings of Californians over time. However, these data sources remain largely separate—which prevents the state from understanding how students move across educational institutions and into the workforce. Below are three key considerations in thinking about the potential value of an integrated data system.

A statewide longitudinal data system could help answer important questions for California. The lack of an integrated data system leaves California unable to answer basic questions about educational progress, workforce development, and equity. Such questions include:

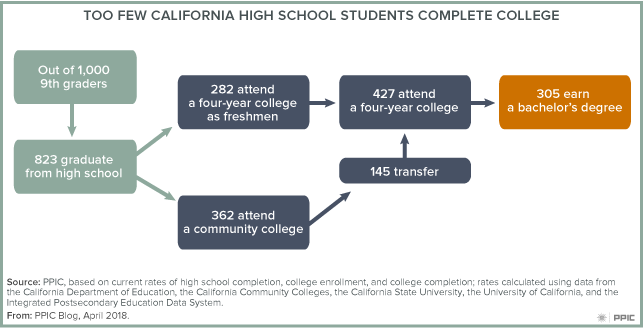
  • Is the state’s educational pipeline working? Who applies to which colleges? Does starting at a community college hurt students’ chances of earning a bachelor’s degree?
  • How does education affect workforce outcomes? In what ways are academic coursework and performance during K–12 related to future earnings? What are the economic returns to different Career Technical Education (CTE) pathways?
  • Are state interventions working? Are districts that receive extra funding through the Local Control Funding Formula getting better at sending students to college?
  • Are state investments paying off? What are the impacts of early childhood education on long-term educational and economic outcomes?

College and career readiness is one area where a longitudinal data system could help inform policy. The Common Core State Standards and the Smarter Balanced assessments are aimed at preparing K–12 students for college and career success. PPIC projects that California will face a shortfall of 1.1 million college graduates if current trends in college-degree production and demand for college-educated workers persist. Getting students ready for college is an important goal for the state. In fact, California’s K–12 scorecard will soon start holding districts accountable for their college and career readiness. The College Career Indicator contains metrics about high school course completion and standardized test measures. But due to the lack of linked data, high schools do not actually know which of their students go to which colleges, whether students need remediation once they get there, and whether students succeed in their academic goals. High schools also lack data on if or when students enter the workforce and how successful they are in their career. A statewide longitudinal data system can connect high school performance with outcomes in college and career, which could in turn provide schools, researchers, and policymakers the feedback they need to improve college and career readiness policies and programs.

Though our current ability to link data across sectors is limited, doing so has already produced important insights. Occasionally, researchers or institutions can link together data on a project-by-project basis. Here I list two examples that uncovered important insights and that would not have been possible without longitudinal data. First, PPIC researchers Sarah Bohn and Shannon McConville’s work on Career Technical Education in health fields linked educational data from the California Community Colleges Chancellor’s Office with earnings data from the state’s Unemployment Insurance system. Their work showed that CTE credentials in health generally have sizeable economic returns. The research also indicated which certificates result in higher wages and showed that earning multiple, short-term credentials yields significant economic returns. My own research with Michal Kurlaender and Scott Carrell of UC Davis connected community college data to high school data to show that incoming student characteristics play a big role in determining college-wide outcomes and rankings. These findings are especially important given the initial conversations around performance funding for California’s community colleges.

It is clear that a statewide longitudinal data system could provide new information and insights that are not currently available or possible. There still may be concerns about organization, privacy, security, costs, and ownership of the data, but if the state is willing to meet those challenges—as many other states have done—this tool could help California evaluate and improve its system of education. Linking K–12, college, and earnings data would allow policy experts to determine which policies and programs produce the best and most efficient outcomes for students, colleges, and the state as a whole.

Testimony: Reforming Key Policies at the Community Colleges

Olga Rodriguez, research fellow at the PPIC Higher Education Center, testified before the Assembly Higher Education Committee in Sacramento today (April 3, 2018). Here are her prepared remarks:

Thank you for the opportunity to testify this afternoon. My name is Olga Rodriguez and I am a research fellow at the Public Policy Institute of California. PPIC is a nonpartisan policy research organization and does not take positions on legislation. My comments are based on research we have conducted at PPIC on California’s community colleges.

Every year, California’s community colleges identify hundreds of thousands of students as not ready for transfer-level courses in math and English. Since these courses are required to transfer to a four-year college, students deemed underprepared are placed in developmental (also known as remedial or basic skills) courses to prepare for college work. These placement decisions have profound effects: our study finds that 80% of entering students take at least one developmental course in math, English, or both, and very few of those students complete a college-level math or English course, or transfer to a four-year college after six years.

Despite the critical role of assessment and placement, historically there has been little clarity about how colleges across the state assess and place students into math, English, and English as a Second Language (ESL) sequences. The overwhelming majority of colleges do not have this information publicly available in their college catalog or on their website. To help fill this information gap, in spring 2016 we surveyed all 113 community colleges in the state; 82 of the colleges participated in the survey. They reported on the policies used to assess and place students into transfer-level math and English as well as the highest level of ESL during the 2014–15 academic year. The broad goal of the survey was to provide policymakers and practitioners with a descriptive landscape to improve understanding of the policies used across the state to assess and place students into math, English, and ESL courses. These results provide an important baseline prior to the implementation of assessment and placement reforms. I describe our findings below.

  • First, community colleges varied in how they identified college-ready students. We find that the use of assessment tests was widespread; 100% of colleges reported using assessment tests for math, English, and ESL placement. However, there was variation in the types of tests used and how they were used. For example, while more than half of colleges reported using the Accuplacer test to assess college readiness in math, cut scores ranged from 25 to 96 out of 120. A student with a score of 58 (the median score used by colleges) would be deemed college ready at half of these colleges, but not at the other half. The lack of consistency means that access to college courses—credit-bearing courses that students need in order to transfer to four-year colleges—is determined not only by students’ performance on the test, but also by the policies at the college where they enroll. This wide variation may be especially challenging for the 40% of students who eventually enroll in more than one community college campus, as they could be deemed college ready at one college but referred to remediation in another. These policies end up undermining opportunities to transfer between campuses and provide mixed signals about what it means to be ready for college-level courses. Furthermore, assessment and placement practices have implications for equity. Students of color are more likely to attend colleges that set higher math cutoff scores, which means these students have less access to the math classes they need to advance.
  • Second, the use of multiple measures was sparse and unsystematic. In California, the use of other measures in addition to placement exams (known as multiple measures) is mandated by law. In fact, research shows that measures such as high school achievement data do a comparable or better job at predicting college success compared to assessment tests. But while assessment tests were standard practice, there was substantial variation in the types of other measures used across colleges and across subjects. Additional measures included high school GPA, grades in prior English and math coursework, results from the Early Assessment Program (EAP), and counselor or instructor recommendations, among others. Overall, we find that 61% of colleges used grade in last math course, and 40% used grade in last English course; but only about one-third of colleges used high school GPA for placement into math and English courses. Even fewer colleges used these measures for ESL placement (8–12%). In addition, while some colleges used multiple measures in a systematic way for all students, up to 30% of colleges only used multiple measures if students requested it or challenged their placement. Uneven implementation of multiple measures may aggravate inequities if students with cultural and social capital are more likely to take advantage of these policies.
  • Third, assessment and placement in ESL needs more attention. Each year, about 30,000 students enroll in ESL, and these students may be especially disadvantaged by current policies. Compared to English and math, in ESL, fewer colleges offered exemption opportunities and test preparation activities. Additionally, our findings suggest that a lower proportion of colleges used high school achievement data for ESL placement, indicating that English Learners may not be benefitting from one of the most promising methods of improving placement accuracy.
  • Finally, ongoing reforms aim to promote more consistent and accurate placement policies. With the support of the governor, the legislature, and the system office, a significant amount of resources have been devoted to improving assessment and placement at community colleges. The passage of Assembly Bill 705 will help address this issue by mandating that all colleges use high school achievement data for the assessment and placement of all students. Still, if colleges have the autonomy to set their own rules for placement, and if colleges do not fully inform students of their placement rules, this will be a cause for concern as uneven access to transfer-level courses has significant implications for student success.

In sum, assessment and placement policies should help students reach their academic goals—not stand in the way of those goals. As colleges work to enhance the efficacy of developmental education, implementing evidence-based practices that accurately assess students’ college readiness will be critical. A more equitable and efficient system for assessment and placement is a vital step in helping all students achieve their academic goals.

Five Factors for Successful Online Learning

Governor Brown’s budget proposal requested a $100 million initial investment, along with $20 million annually, to establish a new online college that would be part of the state’s community college system. This college would initially focus on short-term certificate programs for non-traditional students ages 25–34 who are already in the workforce. In the long term, this college would seek accreditation, provide pathways to transfer to a four-year college, and compete with established online course providers like Arizona State Online and the for-profit University of Phoenix.

Tens of thousands of students already take online courses offered by California’s community colleges. In fact, the share of student enrollment in these courses has increased 9 percentage points over the past decade to more than 13% in 2016–17. The new online college, if established, is likely to accelerate this trend.

Previous PPIC research has identified five key factors to help ensure student success in online programs:

  1. Use a systems approach to course design. In this model, an instructional designer works with faculty, media developers, and programmers to develop an online course. This approach recognizes the fundamental differences between online and face-to-face instruction and allows instructors to focus on the subject matter and student engagement.
  2. Provide professional development. Effective online instruction requires distinct strategies. For example, to guide discussion online, instructors must gauge student engagement and develop appropriate norms without the usual visual and auditory cues. Rapid changes in technology and the isolated nature of online instruction also make professional development and mentorship particularly important.
  3. Set student expectations. There is a common misconception that online courses are easy. On the contrary, students in online courses often struggle with the autonomy, time management, and digital literacy necessary to succeed. Successful online programs use orientation courses to set expectations and clarify the differences between online and face-to-face education.
  4. Create community. Communication is essential to foster a constructive learning environment and positive peer interactions. Online courses that encourage regular and effective communication among students and between students and their instructor develop a better sense of community and improve the likelihood of student success.
  5. Take advantage of the online environment. Online tools offer unique insights not available in face-to-face pedagogy. Data on student engagement (e.g., did students view the syllabus or access additional course resources?) can provide clues for how to improve student outcomes. Online learning also facilitates personalization and can be adapted to different learning styles and special needs.

In 2013–14, the community college system launched the Online Education Initiative (OEI), which promotes these best practices and has established online course standards and faculty training in pedagogy and course design. As the state moves forward with its proposal to create a new online college, the OEI could play a key role. Overall, the line separating online and face-to-face learning is not as stark as many suppose. Most college courses already incorporate some online aspects, whether it’s an online course management system, chat room, or video conferencing. As the online and face-to-face worlds continue to merge, furthering our understanding of best practices for online instruction will be critical to student success in higher education as a whole.