Sarah Bohn, research fellow at the Public Policy Institute of California, testified today, February 14, 2018, before the Senate Budget and Fiscal Review Committee, Informational Hearing on Human Services. The topic of today’s hearing: poverty and social safety net programs. Here are her prepared remarks.
Poverty is high in California, and it has not improved as much as the economy has in recent years. In fact, California’s poverty rate is highest in country, according to our estimates. Throughout this presentation, I will rely on the California Poverty Measure research (a joint effort between PPIC and Stanford) that accounts not only for earnings but also for benefits from major safety net programs and the cost of housing to give a comprehensive, accurate, and state-specific account of the resources families have on hand to meet their basic needs.
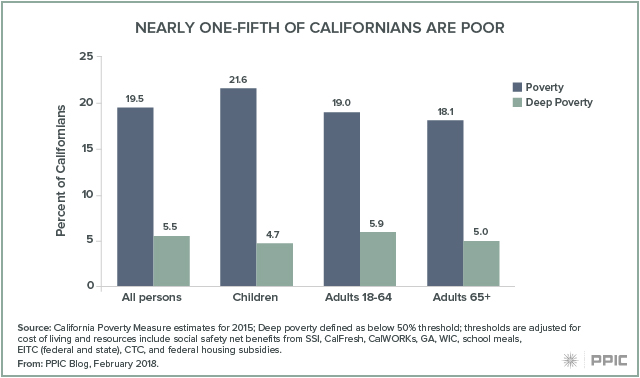
We find that 19.5% of Californians were poor as of 2015—that means 7.5 million people living below a basic needs threshold (less than $30,000 in total resources for a family of four). The poverty rate is slightly higher for children at 21.6%. In addition, 5.5% of Californians are in deep poverty—which means they have less than half of what it takes to meet basic needs, or about $15,000 annually for a family of four. Overall, the share of Californians in poverty remains higher than it was before the last recession started and is relatively high by historical standards.
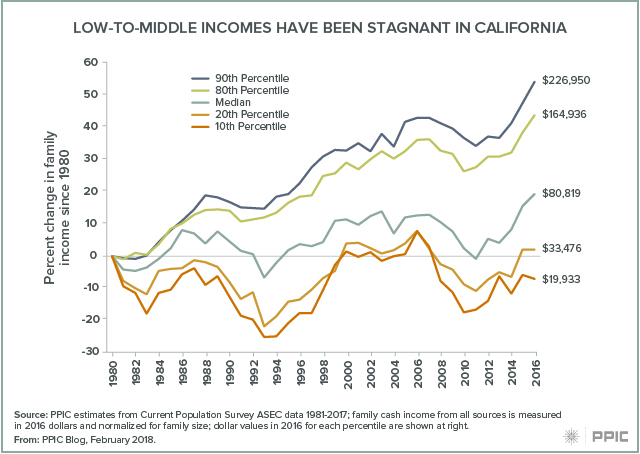
To understand why, providing a long-term picture of how all Californians have fared is helpful. For the bottom half of California families, income has been quite stagnant for at least the past three decades. The bottom 10% are earning less than they were in 1980 (about $20,000) and the bottom 20% are earning just 4% more. Compare that to the top 10%, which are earning 54% more than they did in 1980. Much of this is driven by how economic opportunities (especially in the labor market) have changed and polarized – generating both high rates of poverty and high income inequality.
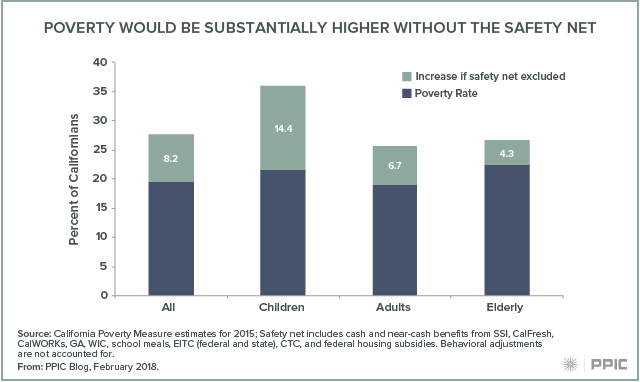
How does this relate to the safety net? With stagnant earnings since 1980, safety net resources become an even more important factor in making ends meet as cost of living increases. Our estimates show that major safety net program benefits play a critical role in mitigating poverty. The California poverty rate would be 8 points higher were it not for these programs—that means an additional 3.1 million Californians would be in poverty. The deep poverty rate would more than double were it not for the safety net.
Looking specifically at CalFresh, CalWORKs, and SSI—the programs we’re focusing on today—we estimate that a large number of Californians are moved out of deep poverty or poverty because of the program benefits they or their family members receive.
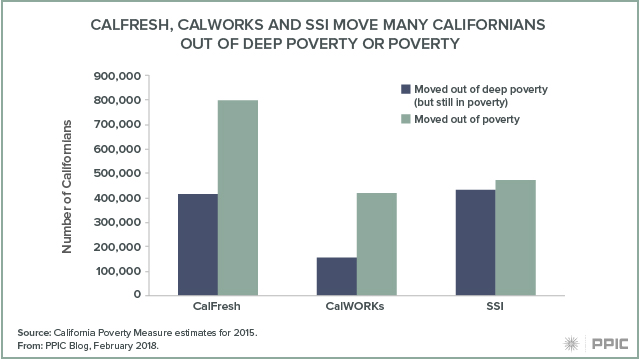
Specifically, CalFresh moves 400,000 people out of deep poverty; 800,000 are moved out of poverty. The numbers are a bit smaller for CalWORKs families (150,000 from deep poverty and 400,000 from poverty), in part because the program reaches fewer families. And finally, SSI moves about 400,000 out of deep poverty and about the same number out of poverty. Keep in mind that families on these programs may be far from the poverty line, so even if they are not technically moved out of poverty, program resources can still be an important way for them to meet basic needs. Families may also benefit from multiple programs in combination.
The safety net plays a critical role in helping make ends meet but income from work is still the biggest component of family resources, even for families in poverty. And as we saw over the long term, the trend in income alone is not positive for families in the bottom half of the income distribution. So in addition to helping families manage in the short term, ideally social safety net programs could contribute to mobility over the long term, counteracting the trend in income inequality. However, one factor limiting the potential impact of safety net resources is the high cost of living in California, driven mostly by housing but also other living expenses like child care and medical costs.
After we consider these other expenses, we end up with poverty rates that are high compared to other states and high within and across California as well. This is what the poverty looks like across a number of demographic characteristics.
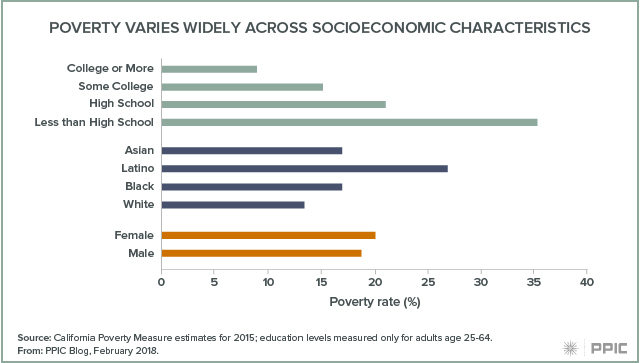
You’ll notice that the incidence of poverty varies the most across education levels (and here we’re only looking at adults age 25–64 who’ve had enough time to acquire education). Men and women are about equally likely to be in poverty. Latinos in California are twice as likely to be poor as white residents (27% vs. 13%), and black and Asian residents fall in between.
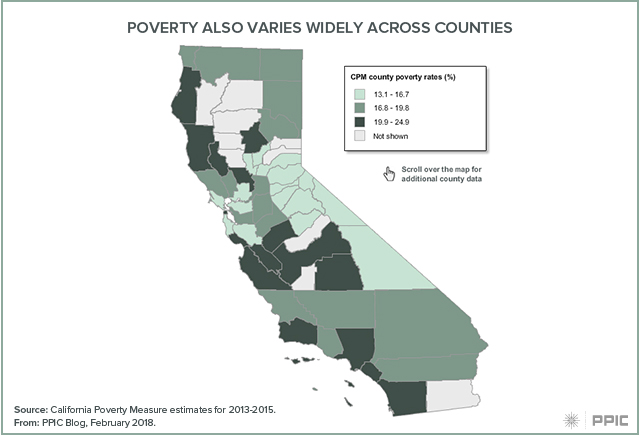
Across the state, poverty varies considerably. The highest rate is in Los Angeles, at 25% (with Santa Cruz and Santa Barbara close behind). The lowest is in Placer County at 13% (nearby Sierra counties of Alpine, Mariposa, and others have similar rates).
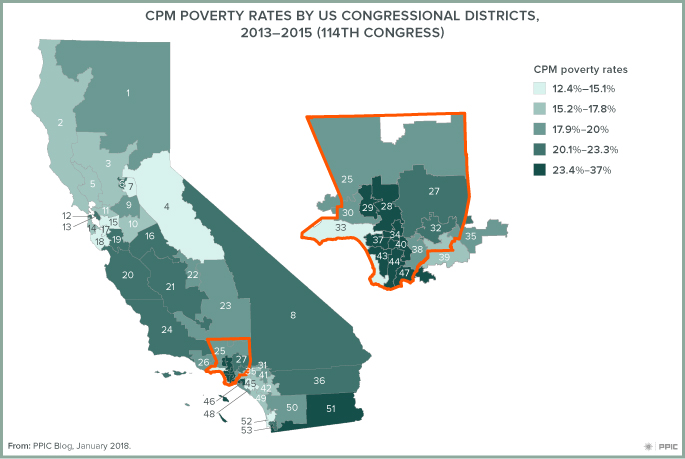
As we all see day to day, poverty is concentrated much more narrowly than at the county level—sometimes it varies neighborhood to neighborhood. In fact, we find that the highest and lowest rates of child poverty in the state are in neighborhoods of Los Angeles that are just 20 to 30 miles apart. Similar differences can be seen in neighborhoods across the Silicon Valley. The concentration of poverty raises concerns that there are other factors about places—beyond just income level—that diminish the chances for residents to get ahead.
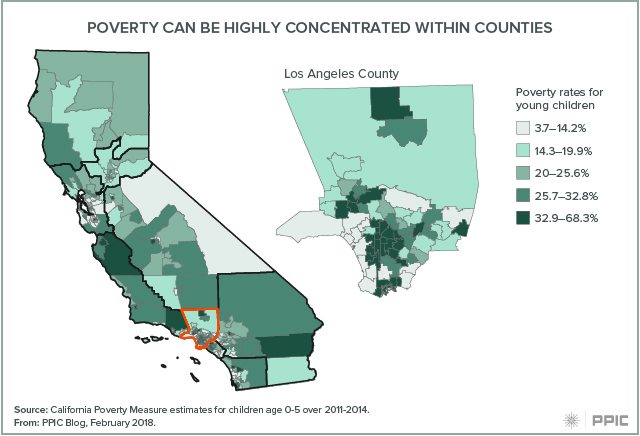
This map is surprising because it does not track one-for-one with unemployment or other economic indicators. Access to good-paying jobs is the number one factor in preventing poverty. But it is not sufficient because the cost of living (housing, child care) looms large—and those expenses tend to be higher in exactly the places where unemployment is lower and wages higher, making it hard to make ends meet even with a full-time job. High living expenses coupled with the long-term stagnation in low to middle incomes yields the high rates of poverty we see today even with very low unemployment rates.
In this context it is critically important to be aware of the role social safety net programs play in helping Californians make ends meet—as I mentioned the poverty rate would be 40% higher were it not for major means tested programs in California. Nonetheless, California has the highest poverty rate in the country—even with a booming economy—so it is exactly the right time to discuss where the safety net falls short and what needs to be done.