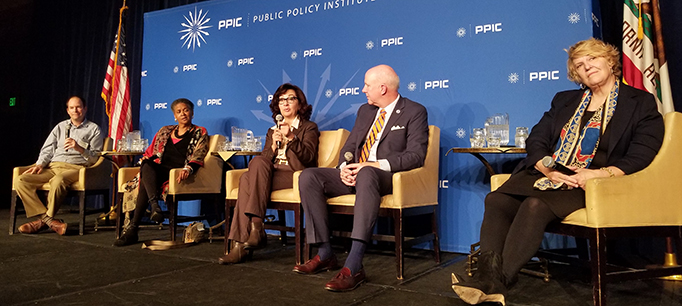
Video: Water Priorities for California’s Next Governor

California’s many water challenges are complex, with many possible solutions and even more opinions about best approaches. How can a new governor forge a path forward in this critical area?

The PPIC Water Policy Center assembled a group of 16 experts this week for a half-day workshop in Sacramento to discuss how the new administration can promote water policies and practices that benefit the state’s people, economy, and environment. Lively discussions addressed three overarching topics: how local and state water policies intersect with California’s most pressing economic issues; innovations in policy, practice, and technology that offer better solutions for key water problems; and steps needed to adapt the state’s water systems to a changing climate.

Ellen Hanak, director of the PPIC Water Policy Center, summarized some major water challenges the new administration will face, including increased risks of drought and floods; poor water quality and drying wells in disadvantaged rural communities; and finding durable ways to pay for needed water system improvements. Leadership will be key to advancing solutions, she said.

“California has been a leader both nationally and internationally” on climate change mitigation and reducing emissions, Hanak said. “We think California has the potential to be a leader when it comes to climate adaptation as well.” She noted that water is a lynchpin issue for addressing the effects of a changing climate.

The first panel shed light on the links between water and the state’s leading economic challenges, from housing affordability to jobs. For example, growing water scarcity in the San Joaquin Valley—one of California’s fastest-growing areas―will affect plans to build new housing there. And regulation can complicate efforts to build affordable housing. Dan Dunmoyer of the California Building Industry Association noted that some water-related regulations—such as strict rules to prevent runoff from construction sites during the rainy season—can significantly increase building costs. Panelists agreed that better coordination could help open up many of these bottlenecks.

Denise Fairchild of Emerald Cities Collaborative highlighted the potential for job training programs in the water sector—which is grappling with the “silver tsunami” of an aging workforce—to create economic opportunities for low-income communities. “If we take this opportunity to rebuild California’s water infrastructure, it has great job generation potential” in communities affected by a historical lack of water sector investment.

The next panel looked at technical and policy-related innovations that can improve water management, such as weather forecasting tools that enable more nimble water management in dams—key to adapting to an increasingly volatile climate. Also, better information on agricultural water use can “empower communities to stop arguing about numbers and start working on solutions,” said Robyn Grimm of Environmental Defense.

The final panel explored opportunities to modernize the state’s water “grid”—its vast network of reservoirs, aquifers and conveyance systems—to make it more resilient in the face of five climate pressures: warming temperatures, shrinking snowpack, shorter and more intense wet seasons, more volatile precipitation, and rising seas. Improving water conveyance and reworking the current system would enable the state to “take advantage of bigger storms” linked to climate change by capturing their water for recharge, said Ashley Boren of Sustainable Conservation.

Each panel discussion included a quick round of “elevator pitch” advice for the governor-elect. Jennifer Pierre of the State Water Contractors captured the mood of the group with her pitch: “In water, flexibility is the name of the game—we need it for managing the existing grid, and for grid improvements. Don’t wait for the perfect plan; we’ll suffer every year that we delay.”

We invite you to watch the videos from this event and hope you find the discussions helpful:

Californians’ Attitudes Toward Gun Control

Following last week’s tragic shooting in Thousand Oaks, California, the national debate over stricter gun policies is once again at the forefront. So far in 2018, there have been more than 300 mass shootings in the United States, including more than 30 in California.

Currently, California’s gun control laws are some of the strictest in the nation. For example, the state bans assault weapons, mandates thorough background checks, and enforces a 10-day waiting period for new purchases. California also requires a minimum age of 21 for buying shotguns and rifles, and imposes lifetime bans on gun ownership for those convicted of domestic violence or involuntarily hospitalized more than twice in one year.

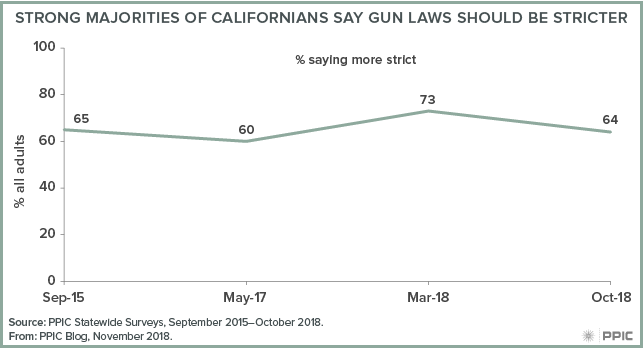
In PPIC’s October Statewide Survey, we asked Californians if in general, they thought the laws covering gun sales should be made more strict, less strict, or kept as they are now. A solid majority of Californians (64%) replied that laws covering the sale of guns should be stricter; 21 percent said they should be kept as they are now, and just 13 percent said they should be made less strict. Californians are just as likely as adults nationwide to say gun laws should be stricter and slightly less likely to say laws should be kept as they are now, according to an October Gallup poll (61% more strict, 30% kept as they are now, 8% less strict).

Across political parties, an overwhelming majority of Democrats (82%), about half of independents (49%), and one in three Republicans (31%) say gun laws should be stricter. Majorities across regions and age, education, income, and racial/ethnic groups prefer guns laws to be stricter. Women (73%) are much more likely than men (55%) to hold this view.

At least six in ten Californians have said that laws covering the sale of guns should be stricter in periodic PPIC surveys since 2015. Nonetheless, Californians’ perceptions on gun laws have fluctuated in response to gun-related incidents. For instance, the share of Californians in our March survey who thought gun laws should be stricter was 9 points higher than today (73% to 64%)–a high mark in PPIC surveys, occurring in the aftermath of the high school shooting in Parkland, Florida.

Notably, Californians across many political and demographic groups in our March survey were more likely than those in our October survey to be in favor of making laws covering gun sales to be stricter. Following last week’s shooting in Thousand Oaks, Californians’ preference for stricter gun laws may increase again.

Amid widespread support for stricter gun laws, California’s newly elected leaders are positioned to play a pivotal role in shaping the future direction of gun control in the state. Along with California Democrats in Congress, governor-elect Gavin Newsom is calling for tougher gun restrictions. As we head into the new year, PPIC will continue to track Californians’ attitudes toward gun laws and how statewide leaders are working to address this issue.

New Term Limits Add Stability to the State Legislature

California Democrats are on track to add two seats to their majorities in both the state assembly and the state senate. Combined with Democrat Gavin Newsom’s win in the governor’s race, these flips give Democrats the supermajorities they need for unfettered pursuit of their legislative agenda. While this partisan shift is certainly important, the impact of a recent change in term limits tells a larger story of remarkable stability.

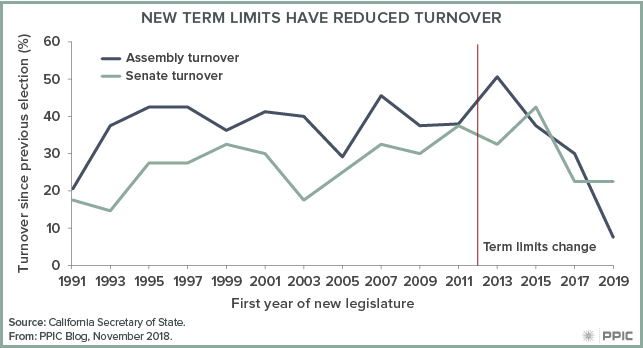
In 2012, California voters passed Proposition 28, which relaxed term limits by allowing legislators to serve up to 12 years in either or both chambers of the legislature. Under the previous rules, term limits for each chamber required anyone who wanted to spend the maximum 14 years in the legislature to move from one chamber to the other. And because the senate has half as many seats as the assembly, no more than half could serve the full 14 years.

Proposition 28 applies to legislators who were elected for the first time in 2012 or later. Most of these legislators have been sticking with the seats they originally won, where incumbency makes reelection most certain.

There has been a gradual adjustment to the new limits as the last few legislators covered by the old regime move through the system. Most of these members started in the assembly and moved to the senate, and their assembly seats were filled by legislators subject to the new limits. By 2018, only one assembly incumbent was covered under the old regime, down from 14 in 2016 and 37 in 2014. This incumbent, Anna Marie Caballero, was termed out and ran for the senate.

The impact of Proposition 28 has been significant, particularly in the assembly, where turnover has plummeted from a peak of 50% in the 2012 election to just 8% this cycle—a 30-year low. Senate terms are twice as long as assembly terms and only half of the chamber is up for reelection each cycle, so there is naturally less turnover there. Nonetheless, turnover in the senate shows signs of decline.

Proposition 28 has also led to a gradual increase in assembly expertise. The average member of the assembly next year will have spent almost five years in the legislature, longer than in any legislative term since the original term limits first began to force members out. Senate expertise, on the other hand, has declined from 18 years in 1995 to just 6.5 after the 2018 election, and may never increase much again. Under the old regime, most senators served a full 14 years by moving over from the assembly; though more will now spend their whole career in the senate, they can serve 12 years at most.

The growth in assembly expertise helps bring the two chambers closer to equality in the policymaking process. But this expertise necessarily comes at the price of lower turnover in some elections. Partisan changes may rightly receive most of the attention this election cycle, but broader changes in membership are the exception not the rule.

How Strong Is the Trump Effect in California?

Was the 2016 presidential election a sign of things to come—presaging an ever-bluer California? Or was it a one-off result driven by the personalities of the candidates?  These are important questions in California, which voted more Democratic for president in 2016 than it had in 2012, even as the rest of the country moved in the opposite direction.  Even more important, parts of the state that had been reliably Republican—most notably Orange County—suddenly shifted Democratic. Based in part on this result, California’s Democratic candidates fought hard in yesterday’s midterm for several US House seats held by Republicans.

Did the anti-Trump/pro-Clinton vote reliably predict the 2018 outcome? To answer this question, the figure below compares California’s 2016 presidential vote to the 2018 US House vote in all districts with both a Democrat and a Republican running. The solid black diagonal line marks the point where the 2016 presidential vote perfectly matches the 2018 US House vote. Points above the line mark seats where the Democrats outperformed the 2016 presidential vote, and points below show where they underperformed. The competitive seats mentioned above are identified in orange.

The first thing to note is that the 2016 presidential vote predicts the 2018 US House vote quite well.  Higher Democratic presidential votes reliably translate into higher Democratic House votes, so knowing the presidential vote tells us a lot about how a district is going to vote for other offices. This is true even for the competitive races in which the 2016 presidential vote was a surprise.

At the same time, virtually every seat falls below the solid diagonal line. That means the Democratic House candidates in these districts consistently failed to match the support shown for Hillary Clinton in 2016. Though the Democrats are poised to pick up at least three House seats in California, support for the Democratic Party is softer in these races than it was two years ago.

On balance, however, the 2016 outcome was not a one-off:  the areas that voted more Democratic than expected are continuing to vote more Democratic.  At the same time, Democrats would have picked up more seats in the midterm had the US House vote this cycle matched the 2016 presidential vote exactly. Despite what was generally a good Democratic night, the overall outcome fell short of the 2016 benchmark.

Election Day Matters

It’s Election Day, and voters across the nation are choosing their leaders at a divided and contentious time. Although Californians are divided on many issues today, majorities of voters across party lines say they are more enthusiastic about voting than usual this year (October PPIC survey: 72% Democrats, 64% Republicans, 53% independents). This is welcome news after a 2014 statewide election that set a new record for the lowest voter turnout. It will be interesting to see how many Californians will actually follow through and cast their ballots for governor, state constitutional officers, and state legislators.

Who will vote in the California election will be closely watched on election night since a handful of House races may well determine the party in control of the next US Congress. Democrats seem more energized than Republicans in voting for Congress this year (October PPIC survey: extremely/very enthusiastic: 57% Democrats, 40% Republicans, 35% independents). However, we also find an “enthusiasm gap” that favors white, older, and more affluent Californians who tend to be conservative voters. This raises questions about whether there will be a “blue wave” or merely a ripple this year.

In addition to electing their leaders, California voters play an outsize role in policymaking in our state. In another striking area of agreement across party lines, most Californians say that they like the initiative process and feel they make good decisions at the ballot box—despite reservations about the number and complexity of ballot measures. Because of the central role the initiative process plays in California policymaking, voters have a special obligation to weigh in on important choices facing the state. This election, Californians will vote on 11 state propositions, in addition to numerous local measures.

Still, many Californians who are eligible do not vote. We’ve found significant gaps between voters and non-voters in the state. Voters are much more likely to be older, white, and own their homes. They have higher education and income levels. And they are more likely to identify as one of the “haves” than the “have nots.” This means that important policy choices that affect the entire population are determined by voters who do not necessarily reflect the state’s social, political, or economic diversity.

The state has implemented several reforms to ease access to registration and voting, many of them quite recently. The jury is still out on the long-term effects of these efforts, but one thing is sure: voting matters. Elections have the power to change the direction of history.

So on this Election Day, it is critical for all eligible Californians to exercise their right to vote. For anyone in need of last-minute help on ballot choices, solid nonpartisan information is available in the state’s voter guide.

PPIC is keeping a close eye not only on the immediate outcome of the vote, but also on long-term trends and implications. Stay tuned to the PPIC blog for post-election thoughts and analysis of this year’s important midterms.

2020 Census: Counting the Central Coast

The decennial census plays an essential role in American democracy. Our series of blog posts examines what’s at stake for California and the challenges facing the 2020 Census, including communities that are at risk of being undercounted.  

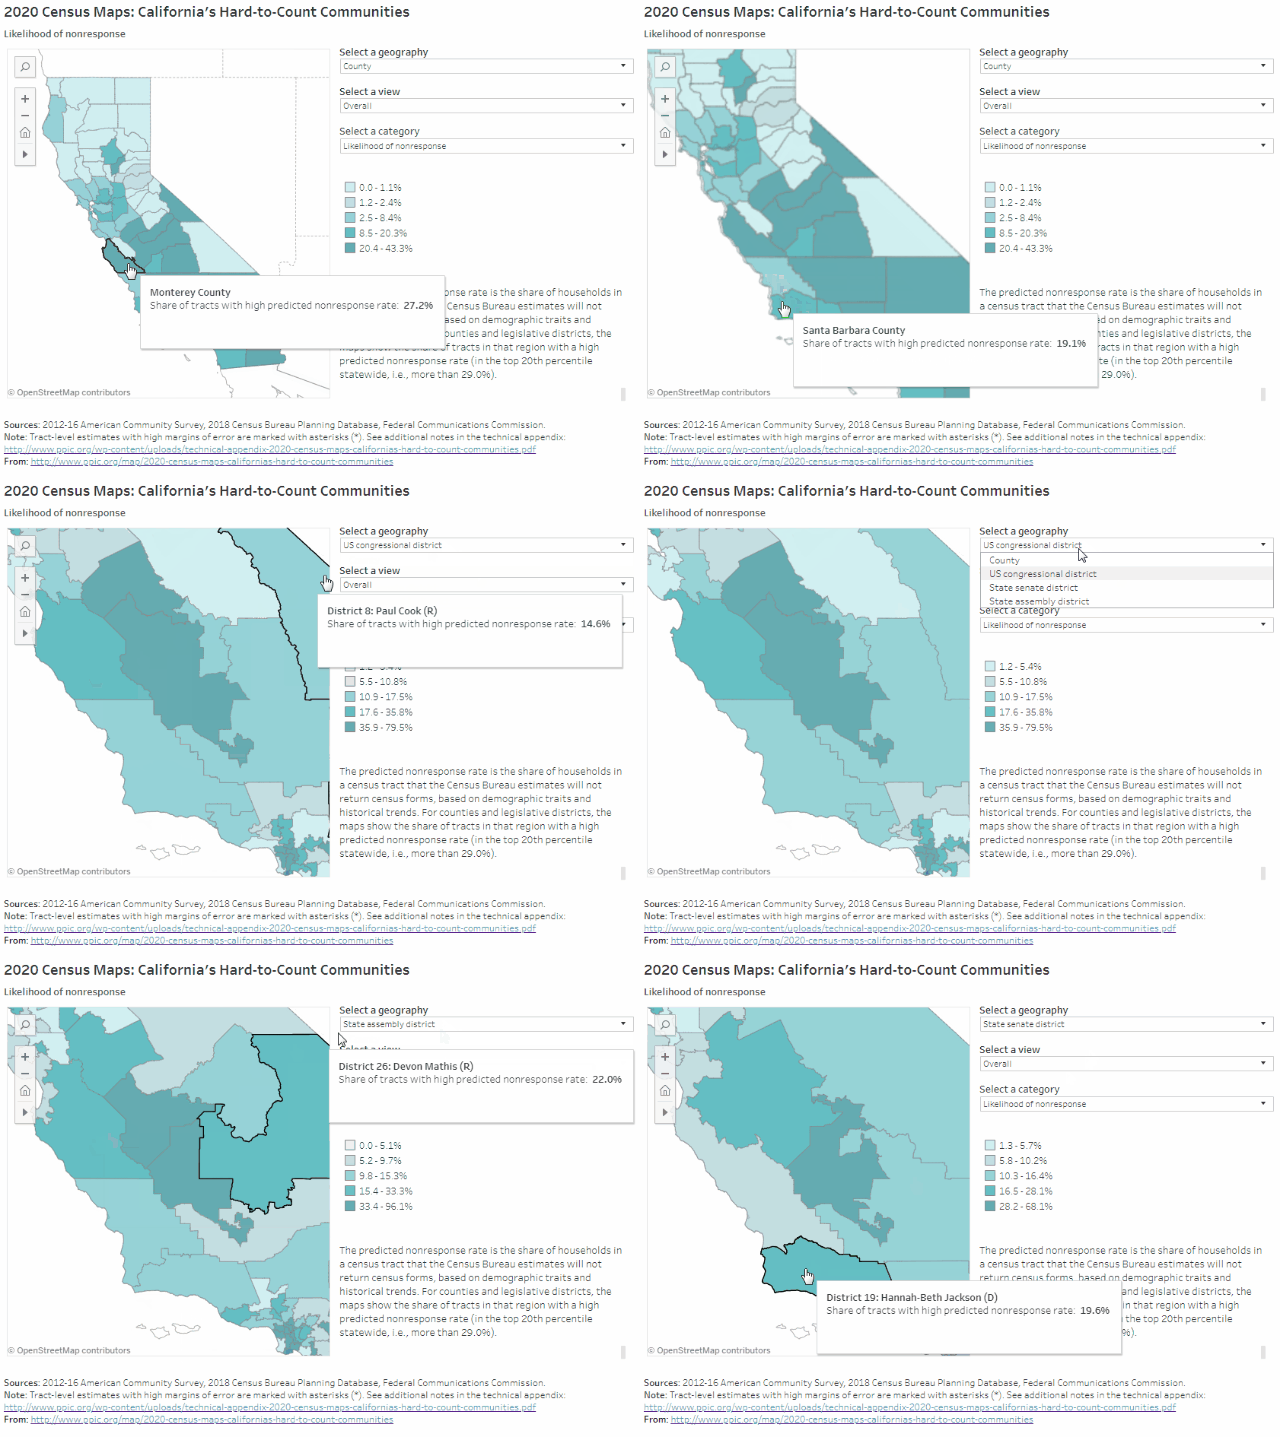
PPIC’s interactive census maps are an important tool for Californians working to ensure an accurate census count. Using estimates from the Census Bureau and the Federal Communications Commission, they highlight hard-to-count communities across the state and pinpoint reasons why certain areas may be hard to reach.

More than 2 million Californians live in the Central Coast counties of Monterey, San Benito, San Luis Obispo, Santa Barbara, and Ventura. Monterey County has by far the region’s highest share of very hard-to-count census tracts (27%), followed by Santa Barbara (19%) and Ventura (12%). Households in these very hard-to-count areas are at risk of being undercounted because they are less likely to respond initially to census forms, according to Census Bureau estimates that draw on historical trends and local demographic characteristics (e.g., race/ethnicity, age, citizenship, and housing conditions).

Census Central Coast

Some highlights:

  • The implications of undercounting very hard-to-reach places differ widely for Central Coast legislators. In two districts representing much of Monterey County—Assembly District 30 (Caballero) and Congressional District 20 (Panetta)—about a fifth or more of census tracts are likely to be very hard to count. The same is true for Senate District 19 (Jackson), covering Santa Barbara and most of Ventura County. Other Central Coast districts have relatively low shares of hard-to-count areas. Given this wide variation, understanding the overlapping factors that can make populations hard to reach will be key to ensuring an accurate count of the Central Coast.
  • There are hard-to-reach areas scattered throughout the region. In Monterey County, areas around Salinas and the Salinas Valley are likely to be the most difficult to count, with 30% or more of households predicted not to respond initially to the census. Other hard-to-reach areas can be found in the city of San Luis Obispo; Santa Maria, Santa Barbara, and Isla Vista in Santa Barbara County; and around Oxnard and Port Hueneme in Ventura County.
  • Monterey and San Benito Counties have relatively high shares of historically undercounted racial/ethnic groups. The census has typically undercounted African Americans, Latinos, and Native Americans. These groups make up about 60% of residents in Monterey and San Benito Counties—but just 24% of San Luis Obispo residents. In Santa Barbara and Ventura Counties, these racial/ethnic groups comprise about 45% of the population, similar to the state overall.
  • Undercounting young children and noncitizens would dramatically misrepresent Monterey County. Young children have been historically undercounted in the census. In addition, noncitizens may be less likely to respond in 2020 due to the planned addition of a citizenship question and fears about privacy and deportation. Almost 22% of Monterey County residents are noncitizens, and about 8% are under five years old—some of the highest concentrations in the state.
  • Outreach to residents in hard-to-count housing will be key to accurately representing the Central Coast. Monterey and Santa Barbara Counties have especially high shares of rental units, overcrowded rentals, and mobile homes. These conditions make it difficult for the Census Bureau to find and count residents. In both counties, nearly 1 in 10 housing units is an overcrowded rental. Northern San Benito County, coastal San Luis Obispo County, Santa Maria, Oxnard, and the Santa Clara River Valley also have hard-to-count housing and will require targeted outreach to fully count residents.
  • Limited internet access may be an issue in rural areas throughout the region. The Census Bureau plans to collect the majority of responses online in 2020—a change from previous practice. Each county along the Central Coast has some census tracts with minimal residential high-speed connectivity, with the lowest access outside cities. In Monterey County, for example, fewer than 400 out of every 1,000 households around Prunedale have high-speed internet connections, compared with 600–800 in neighboring Salinas. While people in these areas may have internet through smartphones or public libraries, in general they may have more trouble responding to the census online.

We hope these maps serve as a starting point to help local, regional, and state leaders think about which activities, resources, and partnerships—including language assistance, awareness raising, and community outreach—might be most effective for accurately counting different parts of California. Stay tuned for future posts that examine hard-to-count communities in other regions of the state.


Video: Californians and Their Government

In the last weeks of the fall campaign, Democrat Gavin Newsom remains ahead of Republican John Cox in the race for governor. In the US Senate race, Dianne Feinstein continues to lead fellow Democrat Kevin de León. Two closely watched ballot measures—Proposition 6, which would repeal the recent gas tax increase, and Proposition 10, which would expand local authority to enact rent control—are still trailing. These and other key findings of the latest PPIC Statewide Survey were outlined by PPIC researcher Alyssa Dykman at a Sacramento briefing last week.

Democrats are more likely than Republicans to be very or extremely enthusiastic about voting in congressional races, and a majority of likely voters favor the Democratic candidate in their US House district. However, most likely voters have negative views of both major parties.

Other survey highlights:

  • Approval ratings for Governor Jerry Brown and the state legislature continue to be much higher than those for President Trump and the US Congress.
  • A majority of likely voters disapprove of the Senate vote to confirm Brett Kavanaugh’s appointment to the Supreme Court.
  • A majority of likely voters favor the Affordable Care Act, and a solid majority say the federal government is responsible for making sure all Americans have health care coverage.
  • Two-thirds of likely voters oppose building a wall along the entire border with Mexico; a slim majority favor the state making its own policies to protect the rights of undocumented immigrants.

Is California Turning Even Bluer?

California is already a fairly Democratic state, but in the last two years many have wondered if it has become even more so. In the 2016 presidential election, California was one of a few states that did not shift away from the Democrats. In most of the country, Hillary Clinton garnered a smaller share of the vote than Obama received in either of his campaigns for president—but in California, Clinton improved on Obama’s 2012 vote share by 1.3%, while Donald Trump fell short of Mitt Romney’s share by 5.6%.

Some areas of the state, such as Orange County, have experienced long-term demographic trends that favor the Democrats, yet the swing to Clinton in these places outpaced these trends. Seven of California’s congressional districts are held by Republicans but were won by Clinton in 2016. Just two years earlier, five of those seats favored Republican Neel Kashkari for governor by at least 10 points—in a race that Democrat Jerry Brown won by 20 points statewide.

The 2016 presidential vote therefore marked a big change of fortune for California Democrats, particularly in some districts. Does this mean that these districts have become more Democratic for good, or was the 2016 result a reaction to the personalities on the ballot?

One way to answer this question is to compare the change in the Democratic presidential vote in each congressional district to the change in party registration. Party registration indicates a more enduring attachment—something closer to a permanent change in allegiance. If party registration changed to match the latest presidential vote, it might indicate that something longer-term is afoot.

The figure below compares the change in the Democratic presidential vote between 2012 and 2016 to the change in party registration in the state’s 53 congressional districts from 2014 to 2018. The blue dots indicate Democratic registration change, and the red dots indicate Republican change.

Statewide, the Democratic Party has mostly held steady in registration while the Republican Party has lost ground. We can see this pattern above: the blue Democratic dots are clustered around zero on the vertical axis, indicating little average change, while all the red dots are below zero, indicating a decline in Republican registration. However, our question is whether a larger 2016 surge led to a larger change in party registration by 2018. If this has happened, the blue dots should be higher toward the right side of the graph and the red dots should be lower. We can see such a pattern, but it is weak. Districts on the left have indeed seen both smaller increases in Democratic registration and smaller decreases in Republican registration. Likewise, those on the right have seen larger Democratic gains and larger Republican losses. But the difference is modest.

The districts with the largest Democratic shifts—seen on the far right of the graph—display the expected pattern more clearly. In fact, most of the competitive congressional races mentioned above are represented here. Of the seven races considered most competitive by the Cook Political Report, four are in districts that shifted more than 6 percent toward the Democrats in the 2016 presidential race. All four districts are in or around Orange County: 39 (outgoing incumbent Ed Royce), 45 (incumbent Mimi Walters), 48 (incumbent Dana Rohrabacher), and 49 (outgoing incumbent Darrell Issa). Each of these districts also saw a Democratic registration gain of at least 1.4% and a Republican registration loss of at least 4.4%. So the districts with the most surprising results in 2016 are generally also the places with the biggest Democratic gains in registration.

Overall, these results do provide some support for the idea that the 2016 election marked a more permanent change in the state’s politics. But party registration tends to change slowly, and the patterns we are seeing suggest there may be years to go before any transition is complete.

Video: 2020 Census: ¿Por qué es tan importante el censo?

El censo decenal juega un papel muy clave en la democracia estadounidense. Es bastante lo que está en juego para Californiay el año 2020 se acerca rápidamente.

En este video grabado en español, Joe Hayes, investigador de PPIC, explica la importancia del censo del año 2020, y comenta sobre la propuesta de incluir una pregunta sobre la ciudadanía.

Vea más videos en esta serie.


The decennial census plays an essential role in American democracy. The stakes are huge for California—and 2020 is fast approaching.

In this Spanish-language video, PPIC researcher Joe Hayes explains the importance of the 2020 Census and discusses the proposed citizenship question.

View more videos in this series.


An English transcript of the video is available here.

Many Support Rent Control, but Prop 10 Lags

While most of California’s likely voters are satisfied with the way the initiative process is working in California, an overwhelming majority also think that the wording for citizens’ initiatives is often too complicated and confusing for voters to understand what happens if the initiative passes. This may be the case with Proposition 10, as our September survey findings suggest.

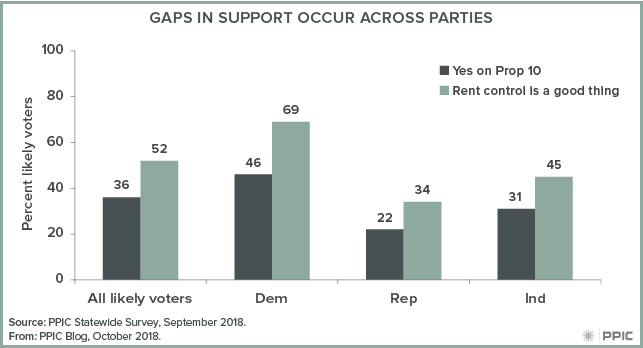
When read the ballot title and label of Proposition 10—which would expand the authority of local governments to enact rent control—about half of likely voters say they would vote no (48%) while far fewer (36%) would vote yes. However, when asked a general question about rent control by local governments, half of likely voters say it is a “good thing” (52%) while fewer (41%) say it is a “bad thing.” This translates to a 16-point gap between support for Prop 10 and support for the concept of rent control.

This gap widens when we dig a little deeper. For example, we find double digit differences in support for Prop 10 and for rent control in general across parties (Democrats 23 points, independents 14 points, Republicans 12 points).

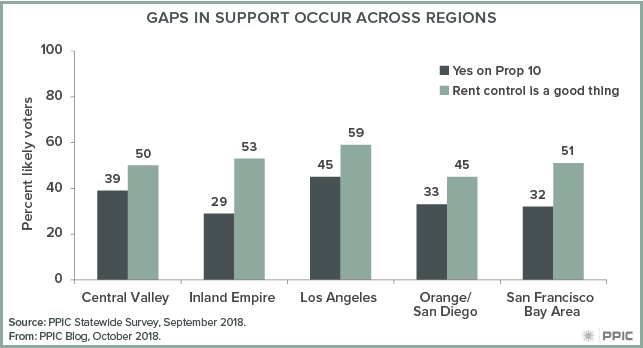
Support for Prop 10 and for rent control in general varies across regions, but the gap in support remains.

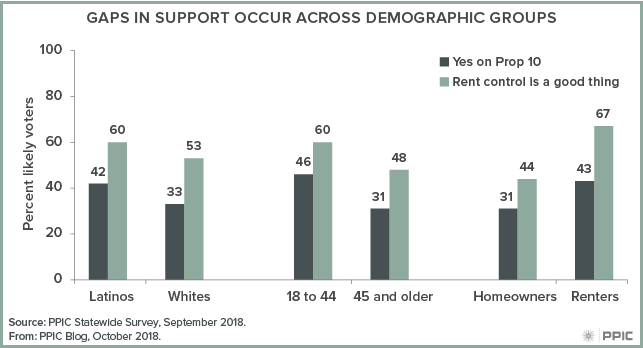
Gaps in support also occur across demographic groups: likely voters who are white (20 points) and Latino (18 points), those age 18 to 44 (14 points) and those age 45 and older (17 points), those making less than $80,000 annually (19 points) and those making $80,000 or more (14 points). Support for Proposition 10 is also lower than the share saying rent control is a good thing among renters (24 points) and homeowners (13 points).

It’s not entirely clear why these differences exist or why they are so pervasive. Perhaps the wording of Proposition 10 is having an impact. The ballot title and label—which are read to our survey participants—describe repealing the current state law that restricts the scope of rent-control policies. (This is the 1995 Costa-Hawkins Rental Housing Act.) It also mentions the potential net reduction of tens of millions of dollars in state and local revenues.

Proposition 10 Ballot Language
Proposition 10 is called the “Expands Local Governments’ Authority to Enact Rent Control on Residential Property. Initiative Statute.” It repeals state law that currently restricts the scope of rent-control policies that cities and other local jurisdictions may impose on residential property. The fiscal impact is potential net reduction in state and local revenues of tens of millions of dollars per year in the long term. Depending on actions by local communities, revenue losses could be less or considerably more. If the election were held today, would you vote yes or no on Proposition 10?

Is this a case of confusing ballot language? Or are voters simply not interested in this particular approach to rent control? As Californians learn more about the propositions during the run up to November it will be interesting to see the impact on Proposition 10. Stay tuned to the PPIC Statewide Survey for timely coverage of this year’s election.