What Approval Ratings Say about Jerry Brown’s Legacy

Perhaps Governor Jerry Brown’s most important contribution—rooted in the higher approval ratings for the executive and legislative branches—was to restore public confidence in state government.

That’s my conclusion after we at the Public Policy Institute of California have taken 64 surveys since Brown took office in January 2011 asking the same question: “Overall, do you approve or disapprove of the way that Jerry Brown is handling his job as governor of California?”

For most of the time since 2011, political gridlock stymied Barack Obama, Donald Trump, and Congress.

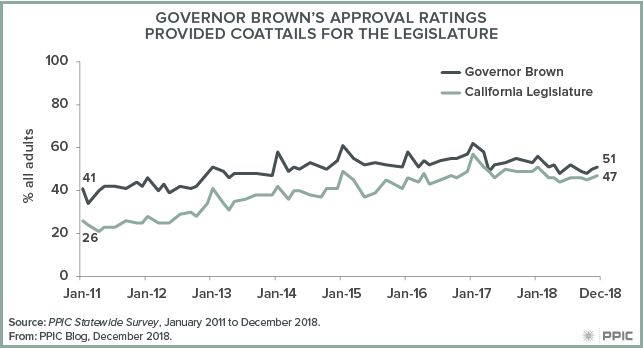
But in California, Brown and the state legislature were solving problems. Survey results show that the public responded. Brown’s latest (and our final) approval rating stands at 51 percent. That’s 10 points higher than his approval rating in our January 2011 survey. Brown’s approval rating surpassed 60 percent twice—after his 2014 reelection and after Trump’s election, when our January 2017 survey had the governor at a 62 percent approval rating. Not surprisingly, Brown’s highest approval ratings today are among Democrats and self-identified liberals, 68 percent and 69 percent, respectively, and is least popular among Republicans at 18 percent and self-identified conservatives at 36 percent.

Notably, his canoe theory of politics—paddle to the left, and then paddle to the right—seems to have worked well. About half of independents and moderates approve of the governor. Brown’s approval rating has never dipped below 47 percent since the voters passed his Proposition 30 tax increase in October 2012. The recent campaign for the Proposition 6 gas tax repeal and the race for his successor apparently had no effect on Brown’s popularity.

Brown steered through troubled fiscal waters that damaged other political careers. The approval rating for Gray Davis hit 31 percent in the September 2003 PPIC survey as he faced the recall that ended his time in office. His replacement, Arnold Schwarzenegger, had a 25 percent approval rating in the November 2010 PPIC survey, as the state suffered from massive budget deficits and he and the legislature struggled with unpopular spending and tax decisions.

The state legislature had been mired in low approval ratings for years. Perhaps the legislature rode the coattails of Brown’s success—its approval rating increased by 21 points, from 26 percent in the January 2011 PPIC survey to 47 percent in December. California’s fiscal recovery was certainly tied to more positive views of the governor and legislature. The perception that the state budget situation “is a big problem” fell by 25 points, from 68 percent in January 2011 to 43 percent in January 2018. At the same time, during Brown’s time in office, the belief that the state is generally going in the right direction grew by 16 points to 54 percent in December 2018.

Brown and the legislature took the drama out of the annual budget process, passed popular laws on education funding and climate change, responded to crises such as drought and wildfire, and maintained a united front against Trump’s unpopular policies.

Will Brown be be a hard act to follow for Gavin Newsom?

Maintaining fiscal stability and an effective partnership with the state legislature will be the key ingredients. Jerry Brown will be leaving office with Californians in a better state of mind than they were in eight years ago. His tenure offers a successful model for governing the state in the future.

Money Measures and the November Ballot

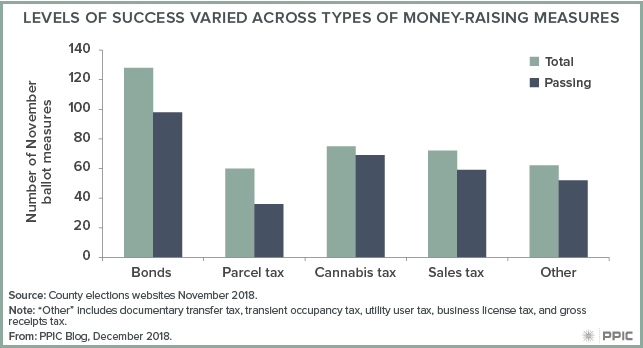
Earlier this year, we looked at how voters responded to the 107 money measures on the June ballot. The November election featured a considerably larger number of taxes, bonds, and fees: local governments asked voters to make decisions on 397 money-related questions, by our count. Most of these measures passed (314 or 79%), though success rates varied across types of taxation or borrowing.

Overall, most bonds passed (98 of 128), but the share of successful bonds for K–12 schools and community colleges (92 of 116, or 79%) was higher than the share of general obligation bonds in other spending areas (6 of 12, or 50%). Since Proposition 39 (which passed in 2000) lowered the passage threshold for school bond measures to 55%, more than 1,400 school bonds have been placed on ballots, and voters have approved more than 80% of them. Of the 92 school bonds that passed this year, 65 met the 55% threshold but fell short of a two-thirds majority.

Parcel taxes, California’s unique way of increasing property taxes in the Proposition 13 era, were the least successful type of taxes on the November ballot. However, voters did approve 60% of these measures (36 of 60), which is in line with their historical success rate. Most parcel taxes proposed by school districts passed (11 of 16, or 69%), while those placed on the ballot by fire districts were less successful (9 of 19, or 47%).

Through 2017, local governments had proposed 80 measures to tax cannabis businesses, generally based on gross receipts, size (measured in square footage), or some combination of the two. On the November ballot, there were 75 cannabis tax measures. As has been the case historically, voters approved the vast majority (69, or 92%).

Is California shedding its reputation as an anti-tax state? The fact that local measures have been successful nearly 80% of the time does not necessarily reflect voter support for taxes in general. According to recent PPIC Statewide Surveys, a majority of Californians feel that their tax burden is greater than it should be and see Proposition 13 as “mostly a good thing.” Also, savvy local leaders put money measures on the ballot only when polling or canvassing suggests the probability of passage is high.

A more precise interpretation of recent results might be that local governments have been very successful at identifying the type of taxes and purposes around which they can mount successful campaigns. Moreover, recent local measures have been put before voters during a period of economic growth. It will be interesting to see if they continue to succeed going forward.

Video: New Insights into California Arrests

Crime, policing, and community relations are subject to heated debate, but little is known about the first step in the criminal justice process: arrests. Who is arrested in California and what are they arrested for? How have arrest patterns changed over time and how do they differ across the state? Last week in Sacramento, PPIC researcher Magnus Lofstrom outlined findings from a new report and Brandon Martin—a PPIC research associate—moderated a panel discussion that put these trends in the context of state legislation and local police-community relations.

The PPIC report finds that overall arrest rates have dropped dramatically over the past few decades, largely due to declines in misdemeanor arrests. While there have been significant declines in arrests among juveniles and young adults, men, and African Americans, arrestees still tend to be younger, male, and nonwhite. After presenting these and other key findings, Lofstrom stressed that “this report raises more questions than it answers.” Future research, he said, will explore the factors that contribute to trends and differences in arrest rates across demographic groups and jurisdictions across the state. It will also look at the impact of recent criminal justice reforms.

The panelists focused on the importance of addressing the larger issue of long-term trust between law enforcement and the communities it serves. Gabriel Caswell, counsel to the California Senate Public Safety Committee, said that recent reforms such as the Racial and Identity Profiling Act have tried to strike a balance between officer safety and community transparency: “If the community has at least somewhat more access than they’ve been given historically, I think that will go a long way toward rebuilding trust.”

Marisa Arrona, local safety solutions project director for Californians for Safety and Justice, highlighted efforts to shift from reactive policing to the Blueprint for Shared Safety: “Shared safety is more than the absence of crime; it’s got to be the presence of well-being.” Instead of assessing safety only through crime rates, communities can also use other measures, such as harm reduction among vulnerable populations, access to victim services, or the number of former offenders who have access to jobs.

Daniel Hahn, Sacramento police chief, also cautioned against relying exclusively on crime numbers: “You’ve got to be very careful of what’s behind the numbers and make sure it’s actually meaningful to the community.” He stressed the need to look beyond simple solutions. In order to build trust between police and the communities, he added, “We gotta change the way we hire, change the way we train, include the community in the police department and the police department in the community.”

Video: Modernizing California’s Education Data System

California has invested billions of dollars in public education reforms over the past decade, and student outcomes have improved in many areas. But the state can’t answer key questions about student progress because it doesn’t have comprehensive data on important transitions. For example, it can’t easily track student movement between high school and college or from college into the workforce. With new state leadership about to take over in Sacramento, the time may be right for an integrated data system that can help policymakers, educators, and students monitor educational progress and outcomes.

Last week in Sacramento, PPIC researcher Jacob Jackson outlined a new report on the need for such a system and Hans Johnson, director of the PPIC Higher Education Center, moderated a panel discussion about the benefits and challenges of creating one.

As Jackson pointed out, most other states already have integrated education data systems. Colleen Moore, assistant director of the Education Insights Center, added that California “already has four pretty good longitudinal data systems—it’s just that they’re within each of the four education segments and they’re not connected.” As a result, student demographics, coursework, grades, and degrees or certificates can be tracked within each segment but not across segments.

Natasha Collins, principle consultant on education for the Assembly Appropriations Committee, noted that it would not be technically difficult to create a repository that links data and follows student movement through the K–12 system and the three postsecondary systems. “It might make sense to move forward with those core components and then potentially add on other agencies—even things like corrections, or the Department of Rehabilitation—so we can really see student outcomes.” She added, “We could also have information on employment and earnings outcomes at least for students who go to college at some point.”

So why doesn’t California have one? Collins noted that the legislature has considered several bills that would set up a system and recently held a hearing on the topic. Moreover, technical plans to link data across the higher education systems have been drawn up in the past. The panelists agreed that the main barriers are not technical—they are political and logistical.

Lande Ajose, executive director of California Competes, stressed the need for an entity to oversee data collection and access: “The state needs an independent body that would be responsible for collecting, cleaning, analyzing data, and making sure it’s accessible to many other parties.” One stumbling block to creating such a body is determining its scope—should it be simply a secure data repository, or should it have the authority to coordinate segments and/or monitor their accountability?

Laura Metune, vice chancellor for external relations at the California Community Colleges Chancellor’s Office, highlighted another barrier: “One of the challenges has been direction and resources from the state level.” She noted that higher education systems have worked together on data sharing, and her own office shares a lot of data with researchers and the public. But, she added, information sharing requires resources, and “we have a really small staff.”

Ultimately, the panelists put the ball in Governor-Elect Newsom’s court. As Ajose put it, “I really do think that this issue of a data system requires gubernatorial leadership, that the governor has the unique ability to set the stage around what is important within higher education.”

2020 Census: Counting California’s Northern and Sierra Regions

The decennial census plays an essential role in American democracy. Our series of blog posts examines what’s at stake for California and the challenges facing the 2020 Census, including communities that are at risk of being undercounted.  

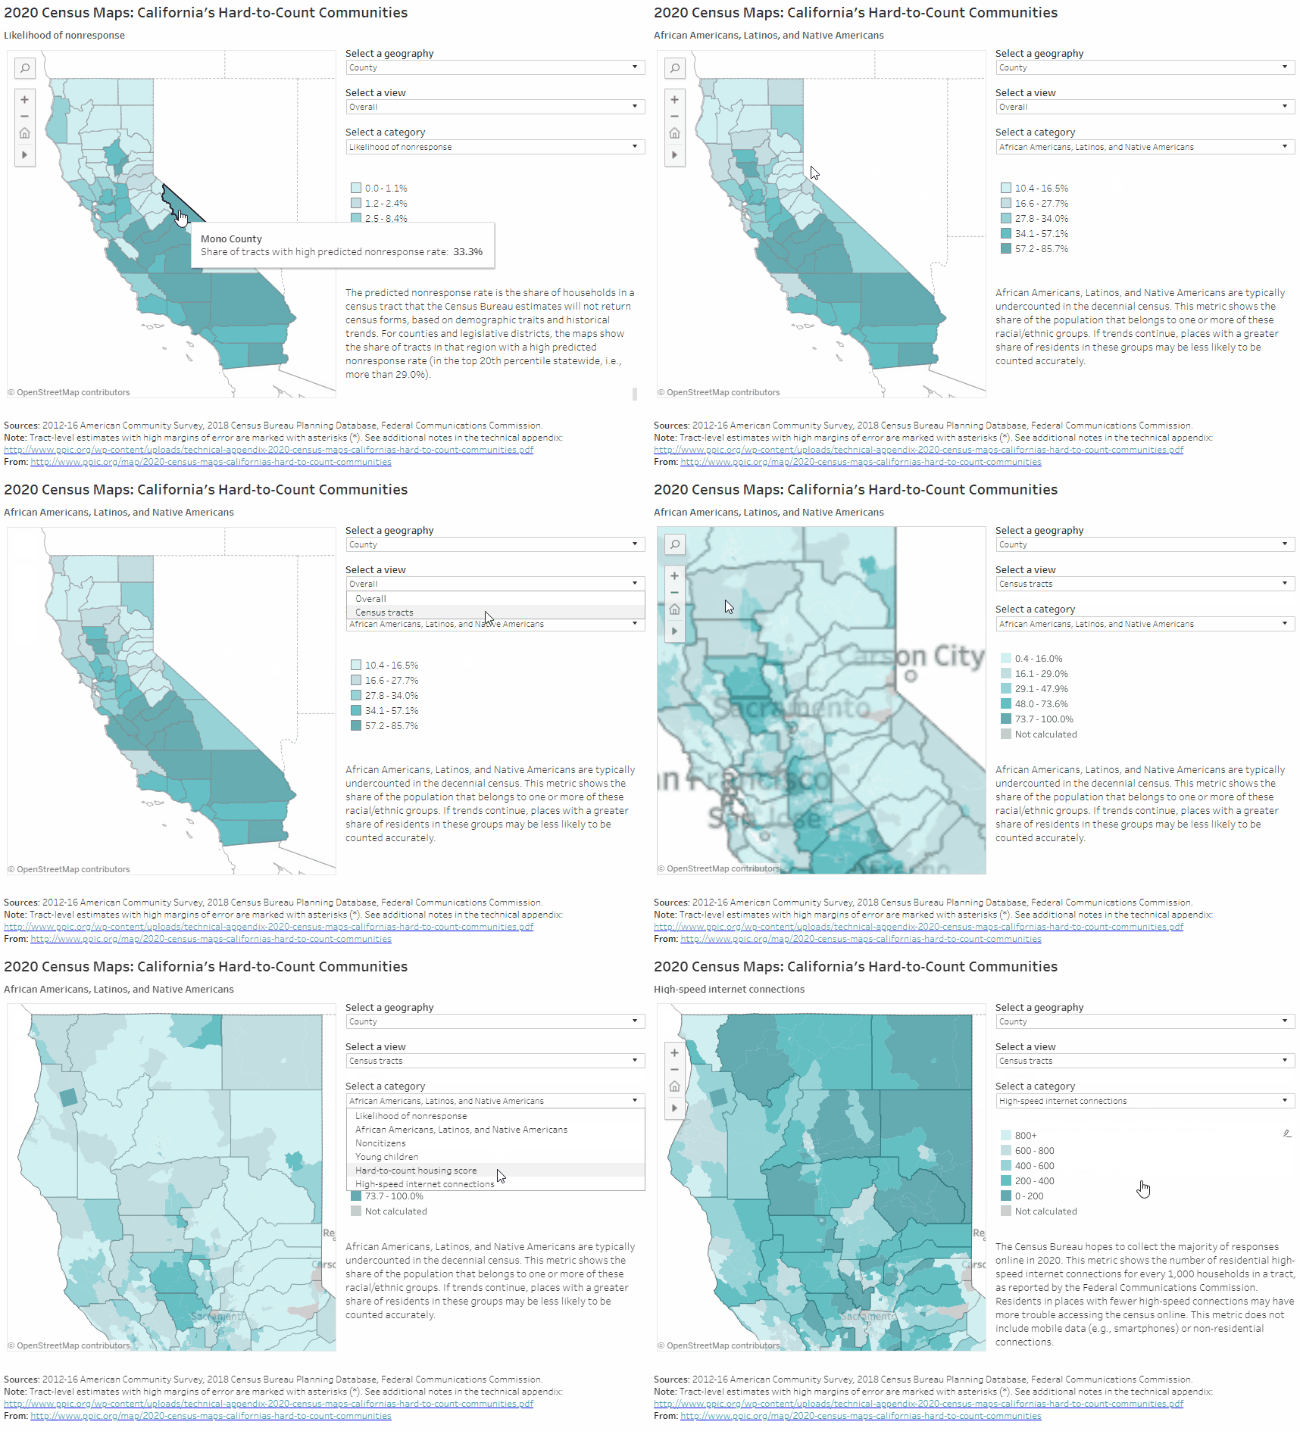
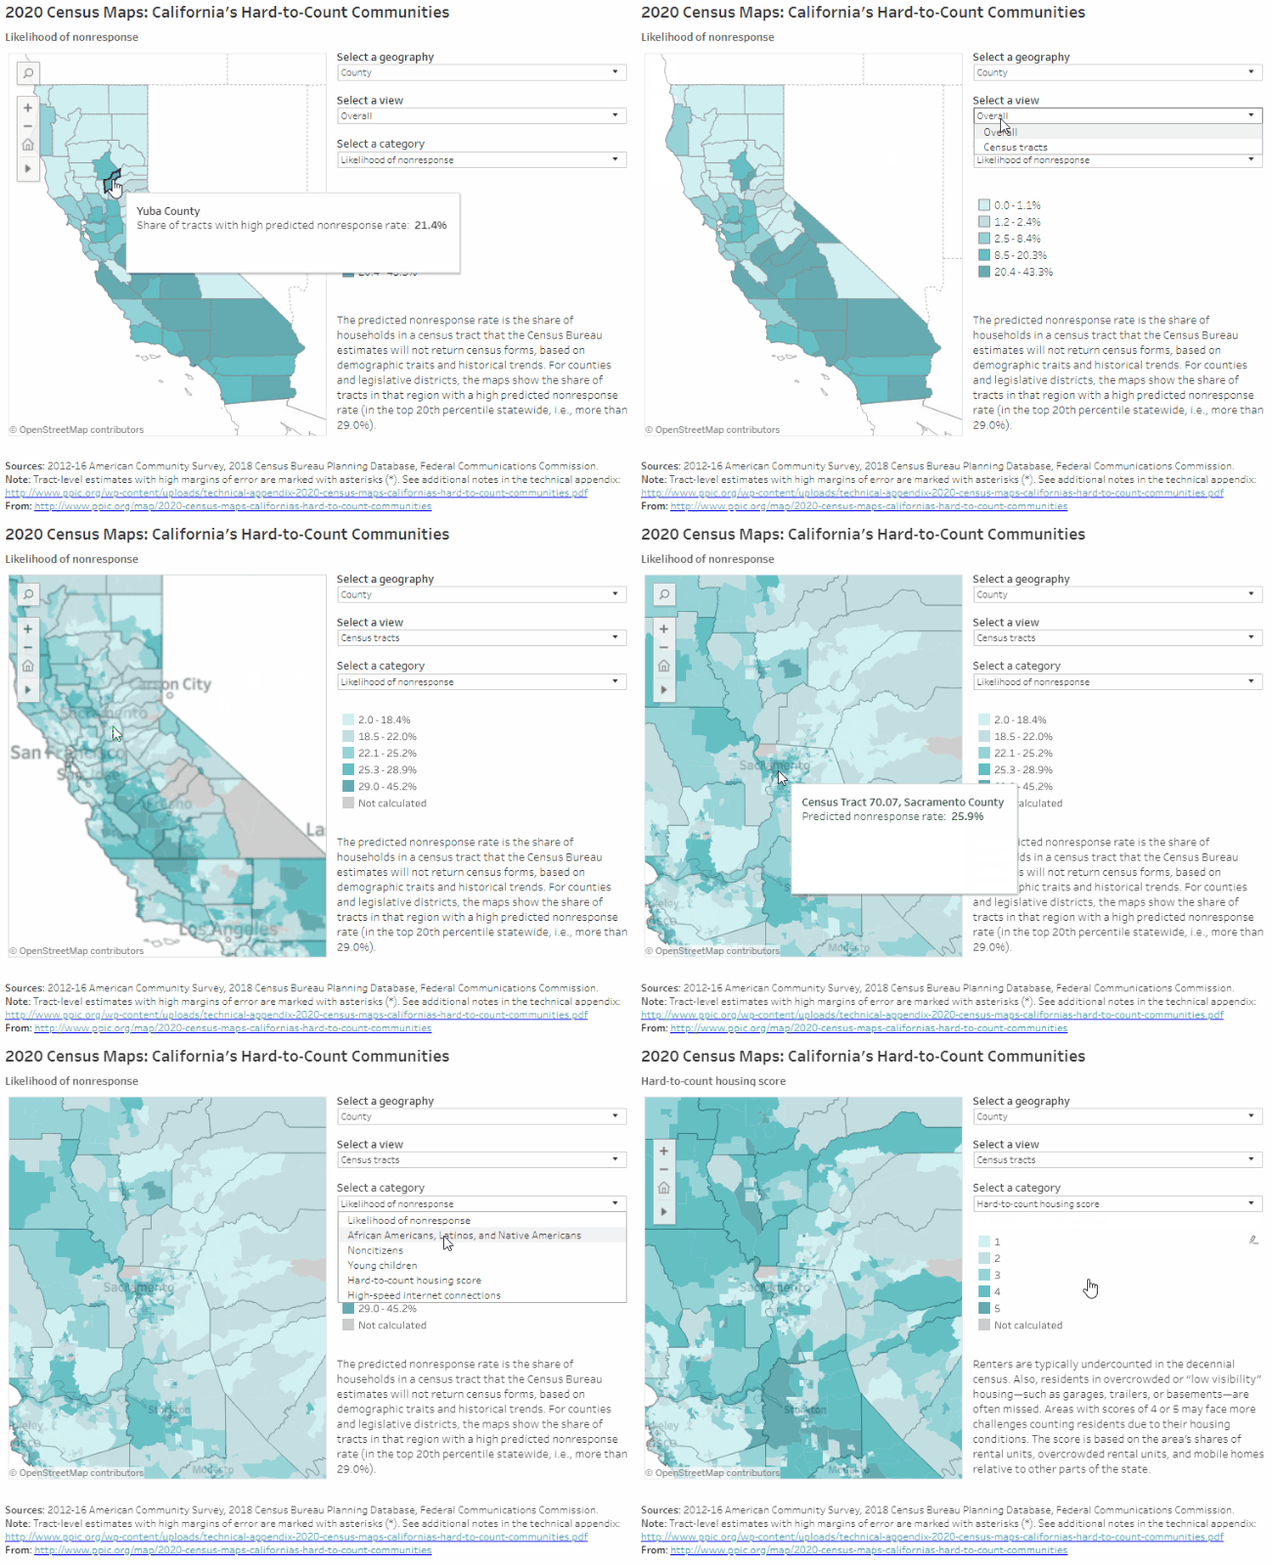
PPIC’s interactive census maps are an important tool for Californians working to ensure an accurate census count. Using estimates from the Census Bureau and the Federal Communications Commission, they highlight hard-to-count communities across the state and pinpoint reasons why certain areas may be hard to reach.

Home to 1.4 million people, California’s northern and Sierra regions cover around 40% of the state, spanning 23 counties: Alpine, Amador, Butte, Calaveras, Colusa, Del Norte, Glenn, Humboldt, Inyo, Kings, Lake, Lassen, Mariposa, Mendocino, Modoc, Mono, Plumas, Shasta, Sierra, Siskiyou, Tehama, Trinity, and Tuolumne. The hardest-to-count areas in these regions are found in Arcata, Chico, and Mammoth Lakes in Humboldt, Butte, and Mono Counties, respectively. Households in these very hard-to-count areas are the least likely to respond initially to census forms, according to Census Bureau estimates that draw on local demographic characteristics (e.g., race/ethnicity, age, citizenship, and housing conditions) and historical trends.

Some highlights:

  • Follow-up from census workers will likely be needed across the north and Sierras. In most census tracts in California’s northernmost and rural Sierra counties, estimates suggest 19% to 29% of households would need in-person follow-up from census workers to be counted. Further, these estimates from the Census Bureau predate the Camp, Carr, and Mendocino Complex fires, which have likely made it more difficult to count residents.
  • Housing conditions could be an obstacle to counting residents in coastal areas as well as around the northern Sacramento Valley. In these areas, large shares of housing units are rentals, overcrowded rentals, and/or mobile homes—all of which can make residents harder to count accurately. For example, more than 20% of households live in mobile homes in much of Trinity and Tehama Counties, and one out of five rentals in northeastern Siskiyou County is overcrowd Recent wildfires have likely increased the share of households in hard-to-count housing, as displaced families seek shelter elsewhere.
  • Low internet access may pose a challenge throughout the regions. The Census Bureau plans to collect the majority of responses online in 2020—a change from previous practice. Northeastern and central Sierra counties have some of the lowest rates of internet access in the state: in Plumas County, for instance, fewer than 200 out of every 1,000 households have high-speed internet access, on average. In places with limited residential internet access, participation may rely more heavily on paper forms, in-person census takers, or internet provided by local institutions.
  • Undercounting Native Americans would disproportionately affect northern and Sierra counties. African Americans, Latinos, and Native Americans have historically been undercounted in the census. There are tribal lands throughout these regions, which have a higher share of Native American residents than other parts of the state. Working with tribal governments to reach Native Americans will be an important part of accurately counting residents in the northern and Sierra regions.
  • Local knowledge is necessary for effective outreach. Colusa County has the regions’ highest share of residents from historically undercounted racial/ethnic groups (60%) and the highest share of noncitizens (15%). Noncitizens may be less likely to respond to the 2020 Census due to the planned addition of a citizenship question and concerns about deportation and privacy. Ensuring that these communities are counted in 2020 will require an understanding of the local landscape. For example, one area east of Susanville in Lassen County that includes two correctional facilities has a high share of people of color. However, incarcerated people, who are counted where they are held, are unlikely to be undercounted in the census.
  • Some northern counties have high shares of young children. Young children are historically underrepresented in the census. Along the I-5 corridor in the Sacramento Valley, and in parts of Lake, Mendocino, Humboldt, Del Norte, Siskiyou, and Lassen Counties, more than 8.5% of residents are children under five years old, compared to 6.5% statewide.

We hope these maps serve as a starting point to help local, regional, and state leaders think about which activities, resources, and partnerships—including language assistance, awareness raising, and community outreach—might be most effective for accurately counting different parts of California. Stay tuned for future posts that examine hard-to-count communities in other regions of the state.

Federal Immigration Proposal Could Have Widespread Impact

The Department of Homeland Security (DHS) has recently proposed changing how it decides whether a person is or will likely become dependent on government assistance. If implemented, this change would make it harder for immigrants to meet the government’s standard of self-sufficiency—and may deter them and others from using government services for which they are eligible. Through December 10, DHS is requesting public comments on the proposal, which could potentially have wide-ranging impacts on California and its large immigrant population.

The federal government can typically deny applications for green cards or entry into the United States to people who are or will likely become “public charges,” i.e., dependent on government assistance. Under current guidance, DHS considers an immigrant a public charge if they receive more than half of their income from cash assistance—which includes TANF (known as CalWORKs in California), General Assistance (GA), and Supplemental Security Income (SSI)—or are in government-funded, long-term institutional care (like a nursing home).

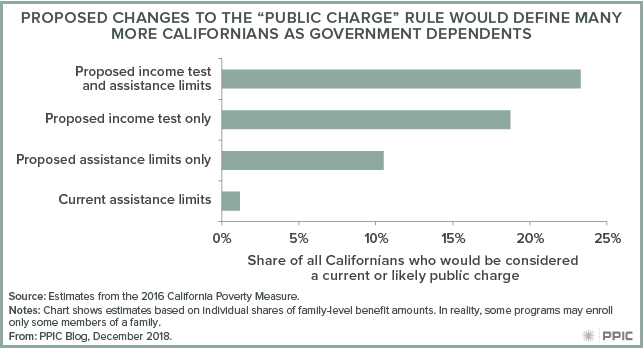
The proposed rule is much broader: it defines dependence as receiving more than about $1,800 (for 2018) in assistance from not only the current programs but also the food assistance program SNAP (CalFresh) and/or Section 8 housing vouchers and rental assistance. DHS also proposes that an income of less than 125% of the federal poverty level ($25,100 in 2018 for a family of four) would be a strong predictor of becoming a public charge and recommends length of enrollment in certain health programs as another factor to consider.

How big of a change is this? While data aren’t available to examine safety net participation among the noncitizens whose immigration cases would be affected by the rule, we estimate that even before including health programs, as many as 23% of all Californians would be considered public charges, or likely to become so—which gives a sense of how broad the proposed rule is. Some 18.7% of Californians would be considered likely to become public charges based on their income level alone. By contrast, at most 1.2% of all Californians receive more than half their income from CalWORKs, GA, and SSI, and would be considered public charges under the current rule. These calculations are based on the California Poverty Measure (CPM), a joint effort of PPIC and the Stanford Center on Poverty and Inequality.

California has more immigrants than any other state—and hence much at stake. For those on visas, the proposed rule would make it harder to qualify for a green card or extend their stay. But in practice, the largest impact would likely be on immigrants and their families who, purely out of caution, forego safety net benefits for which they are eligible. DHS cites this sort of disenrollment as a source of long-term savings—but notes that these savings are liable to be offset by worse public health outcomes and increased poverty rates. Based on studies of welfare reform in the 1990s, the UCLA Center for Health Policy Research estimates that if the rule change takes place, 15% to 35% of families with noncitizens might disenroll from safety net programs. At the high end, as many as 765,000 people could disenroll from CalFresh and Medi-Cal, leading to around $1 billion less in federal aid to California each year.

California’s attorney general and some local governments have already voiced their opposition to the proposed changes, which come at a time when the state has been expanding access to health and social safety net programs. Reduced participation in these programs, whether from reasonable or unnecessary caution, would directly counteract the state’s efforts to reduce poverty. Public comment for the proposal closes on December 10.

Toward Understanding Racial Disparities in Arrests

With tensions between law enforcement and minority communities continuing to make headlines, media outlets and academic researchers both report stark racial and ethnic differences in criminal justice experiences, including sentencing and incarceration. The disparity between African Americans and whites is especially striking. For example, the prison incarceration rate in California is 4,180 per 100,000 residents for African American men, compared with 420 for white men. It is likely that this inequality is significantly affected by the first step in the criminal justice process—arrests.

California’s various law enforcement agencies make a substantial number of arrests each year—1.35 million in 2016. While this is a staggering number, it’s also the lowest number of arrests since 1980 and marks a dramatic decline of more than one million arrests (64%) since a peak in 1990.

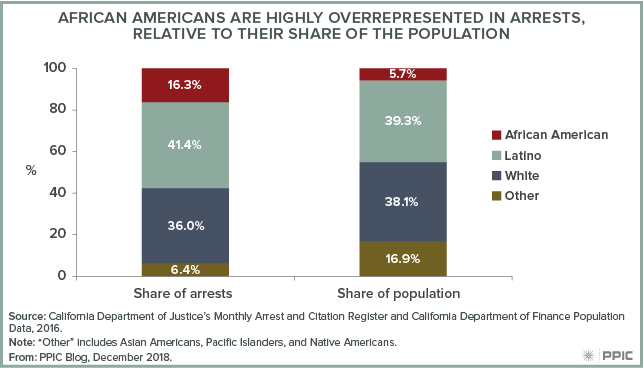
Looking at racial disparities, we find that African Americans are significantly overrepresented among those arrested in California. In 2016, African Americans made up less than 6% of the population but more than 16% of arrests. Latinos were slightly overrepresented in arrests as well, representing 39% of the population but 41% of arrests.

Though much of the penal code is determined by the state legislature, the state does not closely monitor how arrest decisions change over time or vary across jurisdictions, nor how these decisions may affect demographic groups differently. Two efforts—one implemented by the state legislature and one by PPIC—seek to fill this knowledge gap and will bring data-driven information into the broader discussion about policing and community relations.

In 2015, California’s legislature passed the Racial and Identity Profiling Act (AB 953). This legislation requires law enforcement agencies to begin collecting data in 2018 on all initial police interactions with the public, including reason, location, race/ethnicity, gender, and age. While this will provide an opportunity to learn more about law enforcement interactions, the data will not be available for statewide analysis until 2023 or later.

In the meantime, PPIC has launched a project to begin identifying areas in need of attention in California arrests and to frame the conversation for sustainable solutions at the state and local level. In our first report, we examine trends over time and provide a descriptive profile of arrestees, including patterns in race/ethnicity, gender, age, offense type, and the county where the arrest took place. Our interactive tool allows for deeper exploration of arrest rates across California counties.

Over the next two years, we will further examine whether arrestees were booked into jail or cited and released in the field. We will also seek to understand possible contributing factors to these arrest patterns—such as crime rates, law enforcement and correctional resources, economic conditions and expenditures, and demographics. This project uses unique data from the California Department of Justice’s Monthly Arrest and Citation Register (MACR).

As the state and local jurisdictions continue their data collection efforts on police interactions, PPIC’s research will provide a better understanding of long-term trends in arrests and differences throughout the state. Stay tuned for more insights on this critical but understudied aspect of California’s criminal justice system.

2020 Census: Counting the Sacramento Area

The decennial census plays an essential role in American democracy. Our series of blog posts examines what’s at stake for California and the challenges facing the 2020 Census, including communities that are at risk of being undercounted.  

PPIC’s interactive census maps are an important tool for Californians working to ensure an accurate census count. Using estimates from the Census Bureau and the Federal Communications Commission, they highlight hard-to-count communities across the state and pinpoint reasons why certain areas may be hard to reach.

Home to about 2.5 million people, the Sacramento area includes the counties of El Dorado, Placer, Sutter, Yolo, and Yuba, in addition to Sacramento. Within this region, Yuba has the highest share of very hard-to-count areas (21%)—in the top fifth of hardest-to-count counties across the state—and Sacramento has the second highest (10%). Households in these very hard-to-count areas are less likely to respond initially to census forms and are therefore at risk of being undercounted, according to Census Bureau estimates that draw on local demographic characteristics (e.g., race/ethnicity, age, citizenship, and housing conditions) and historical trends.

Some highlights:

  • Legislative districts that include the fast-growing city of Sacramento will likely be the hardest to count. In Congressional District 6 (Matsui), Senate District 6 (Pan), and Assembly District 7 (McCarty), between 14% and 19% of neighborhoods are considered very hard to count. Other legislative districts in the region tend to cover more suburban or rural areas and have much smaller shares of very hard-to-count communities.
  • There are small pockets of hard-to-reach areas across the region. Within Sacramento County, hard-to-reach areas are concentrated in the city of Sacramento, as well as around Rancho Cordova and Folsom. In some neighborhoods, 30% or more of households are predicted to not respond initially to the census. Other relatively hard-to-reach areas include Yuba City and Marysville at the border of Sutter and Yuba Counties, Davis and Woodland in Yolo County, and the eastern border of Placer and El Dorado Counties, directly north and south of Lake Tahoe.
  • Local population trends can help guide effective outreach. African Americans, Latinos, and Native Americans have historically been undercounted in the census. Overall, these groups make up a lower share of the population in the Sacramento area compared to the rest of the state. However, in much of the city of Sacramento, around Woodland and northwest Yolo County, and in South Yuba City and northeastern Sutter County, more than half of residents are from historically undercounted communities—primarily African American and Latino. Some of these areas have relatively high shares of noncitizens as well. Noncitizens may be less likely to respond to the 2020 Census because of the planned addition of a citizenship question and concerns about deportation and privacy.
  • Parts of the Sacramento area have high shares of young children. Young children are historically underrepresented in the census. In census tracts in the eastern parts of Sutter County and southern Yuba County, in the city of Sacramento and surrounding suburbs, and the southwestern tip of Placer County, 9% or more of residents are children under five years old, compared to 6.5% statewide.
  • Housing conditions may make an accurate count challenging. High shares of rentals, overcrowded rental units, and mobile homes can make it more difficult to count residents accurately. Around Yuba City and Marysville, all of these factors are prevalent: in some neighborhoods, more than 65% of housing units are rented, about a quarter of those are overcrowded, and 15% of households live in mobile homes. In the city of Sacramento, housing conditions vary, with some neighborhoods seeing high rates of overcrowding but low rates of mobile homes, while others see the reverse. Reaching residents in nontraditional housing will be critical to an accurate count—and will depend on local knowledge of how families make ends meet.
  • Limited internet access may be an issue in rural areas throughout the region. The Census Bureau plans to collect the majority of responses online in 2020—a change from previous practice. Each county in the region has some census tracts with minimal residential high-speed connectivity, with the lowest access outside of the city of Sacramento, Lake Tahoe, Yuba City, and Marysville. Outside of these areas, it may be harder to collect responses online, and participation will rely more heavily on in-person census takers or internet provided by local institutions.

We hope these maps serve as a starting point to help local, regional, and state leaders think about which activities, resources, and partnerships—including language assistance, awareness raising, and community outreach—might be most effective for accurately counting different parts of California. Stay tuned for future posts that examine hard-to-count communities in other regions of the state.


Local Measures Address Water, Fire in the Midterm Elections

The biggest water news from the recent election was the failure of the $8.9 billion statewide water bond, Proposition 3. This was the first time voters have rejected a statewide water bond since 1990. But this wasn’t the only story for water-related measures on Californians’ ballots. The midterms saw 33 local measures go to the voters that addressed issues ranging from flood protection to fire resilience. Here we summarize a few key votes.

In Los Angeles County, Measure W passed. This measure allows the county to collect a parcel tax of 2.5 cents per square foot of impermeable surfaces (such as concrete sidewalks and pavement) to fund rain and stormwater capture and clean-up projects, in addition to projects addressing water quality and groundwater recharge. The measure exempts permeable surfaces from the tax, which could incentivize developers to incorporate more green solutions into development and renovation projects.

In the Bay Area, San Francisco and San Jose both passed local bonds to modernize infrastructure. San Francisco easily passed Measure A, which will issue $425 million in bonds to strengthen the Embarcadero seawall to better withstand earthquakes and rising sea levels. San Jose’s Measure T will allocate $650 million in bonds to repair the city’s aging infrastructure. Although almost half of this bond is dedicated to repaving streets, the measure also includes $85 million for flood protection—a response to the 2017 Coyote Creek flood that caused $100 million in property damage. The bond will fund “green infrastructure” projects in the local floodplain to reduce the risks of future floods and groundwater contamination.

Across the state, the rise in devastating wildfires resulted in nine measures addressing fire protection and intervention services in communities, to be paid for through utility taxes, sales taxes, and parcel taxes. Four of these measures passed, while five failed.

Sonoma County’s newly adopted park and ecosystem restoration bill―Measure M, a one-eighth cent sales tax increase―will collectively fund wildfire prevention, ecosystem restoration, and projects to safeguard water supplies, including rivers and streams. Measure FF passed in Alameda and Contra Costa Counties; it extended an existing parcel tax to fund wildfire prevention and water quality activities on East Bay Regional Park District lands, as well as park maintenance. But voters didn’t approve Measure P in Laguna Beach (Orange County), which proposed a sales tax to pay for wildfire safety measures. It would have funded projects such as undergrounding overhead power lines.

Although the failure of Proposition 3 caught some by surprise, it’s important to remember that state bonds play a relatively minor role in funding California’s water needs. Local revenues—from water and sewer bills to taxes—provide 85% of water funding. The newly passed ballot measures carry on that tradition, with Californians across the state voting to address their communities’ needs and priorities for water, fire safety, and the environment.

Californians’ Priorities for the Next Governor

Mark Baldassare, PPIC president and CEO and director of the PPIC Statewide Survey, spoke to the Sacramento Press Club on November 19, 2018 in a post-election discussion with Mark DiCamillo, director of the Berkeley IGS Poll. Here are his prepared remarks.

While we are still counting votes in California, the 2018 election can be called a sweeping success for Democratic candidates in the statewide races. Democrats also won the coveted two-thirds majorities in the state senate and state assembly, and increased their dominance of the California congressional delegation. The Republican Party’s efforts to stem their losses by getting behind what they hoped would be a popular gasoline tax repeal stalled as Proposition 6 fell short (57% no).

In the governor’s race, Democrat Gavin Newsom defeated Republican John Cox by a double-digit margin that was similar to the re-election win of Governor Jerry Brown over Neil Kashkari in 2014 (60% to 40%). Newsom was the leader in eight PPIC Statewide Surveys on the governor’s race conducted since last December. Cox surged to second place after President Trump endorsed him in the June primary, but he was unable to expand his base much beyond the president’s approval rating (39%, October PPIC survey).

What are Californians’ priorities for Governor-elect Newsom? California voters mentioned health care, immigration, the economy, the environment, and gun policy when asked to choose the most important issues facing the country in the exit polls (CNN poll, Fox poll). This list covers most, though not all, of the most important state issues mentioned in 2018 PPIC surveys. It also offers a good starting point for identifying issues that will shape the Newsom era. Here is what the 2018 PPIC surveys have to say about each one:

Health Care. A record-high 59 percent of Californians have a favorable view of the Affordable Care Act (ACA) in the October PPIC survey. While 65 percent think it is the responsibility of the federal government to make sure that all Americans have health coverage, just 34 percent say it should be provided via a single government program instead of the current mix of private and public programs. While 64 percent of adults favor a single-payer state government health plan, support drops to 41 percent if it means raising taxes, according to the May PPIC survey. In the wake of ACA repeal and replace efforts, California’s health insurance exchange and MediCal expansion seem to be generating more public support, while the desire for wholesale change are tempered by concerns about choices and costs.

Immigration. Seventy-four percent of Californians believe that immigrants are a benefit to the state, while 85 percent say that there should be a way for undocumented immigrants to stay in the country legally, according to the May PPIC survey. About three in four (74%) oppose building a wall along the border with Mexico in the October PPIC survey. Nearly six in 10 (58%) favor state and local governments taking action, separate from the federal government, to protect the legal rights of undocumented immigrants in California in the October PPIC survey. Given the large immigrant population and strongly held public views, the next governor will be expected to lead the resistance against federal policies.

The Economy. About half of Californians say they expect good times financially for the state (48%) and the nation (48%) over the next 12 months, according to the October PPIC survey. Still, jobs and the economy tops their list when asked to name the most important issue facing the state in the September PPIC survey. Related to this concern, 60 percent say that the state government should be doing more to reduce the gap between the rich and the poor in California. At least half across demographic groups and regions say the state should do more. The next governor’s challenge in meeting this expectation will be the ambivalence about footing the bill. Fifty percent say they prefer to pay higher taxes and have a state government that provides more services, and 77 percent of them say the state should do more. But of the 44 percent of Californians who would rather pay lower taxes and have fewer services, just 42 percent hold this view.

Environment. A record-high 56 percent of likely voters say that the gubernatorial candidates’ positions on the environment are very important in determining their vote, according to the July PPIC survey. Many Californians say they are concerned about the personal impact of global warming in the wake of a prolonged drought and in the face of growing evidence that extreme weather from climate change is resulting in more severe wildfires. As the federal government has dramatically changed course on environmental issues, most Californians say they want the state government to make its own policies to address global warming, and many say that it is important for California to act as a world leader in fighting climate change. Californians will be looking to the next governor to build on the work in progress, while dealing with environmental crises like the wildfires this fall and with legal challenges from the Trump Administration.

Gun Policy. Most Californians (64%) say the laws covering the sale of guns should be made stricter, according to the October PPIC survey. The belief that gun laws should be stricter was at a record-high 73 percent in the March PPIC survey, shortly after the devastating high school shooting in Parkland, Florida. In the wake of the recent tragic shooting in a bar in Thousand Oaks, California, the public’s belief that gun laws should be made stricter may climb higher. And with the absence of new federal legislation to address gun violence, the governor-elect will be asked to find ways to improve the current laws restricting guns in California.

Californians’ priorities also include big-ticket items such as universal preschool and tuition-free community college that would add up to “cradle to career” education, initiatives to tackle housing affordability and homelessness, and adequate water and transportation infrastructure. The next governor will also be tested by a Democratic-controlled legislature with pent-up demand for spending after eight years of fiscal caution under Governor Brown. The October PPIC survey offers this guidance if voter approval is needed: a majority of California adults prefer a bigger government with more services to a smaller government with fewer services (54% to 39%); however, a majority of likely voters prefer a smaller government with fewer services to a bigger government with more services (53% to 41%).

As the priorities, plans, and programs of the new governor take shape in the next year, the mission of the PPIC Statewide Survey—­­ to provide a voice for all adults and likely voters— is one that we take very seriously during this critical moment of policy development. And as we look to 2020, it’s important to remember that California will be playing an early and outsized role in the presidential election, with an early March 3 primary. PPIC will host a series of one-on-one public forums next year with state and national leaders, to discuss their leadership style and to explore their vision for the state’s and nation’s future.