California’s Secretary of State Candidates in Conversation

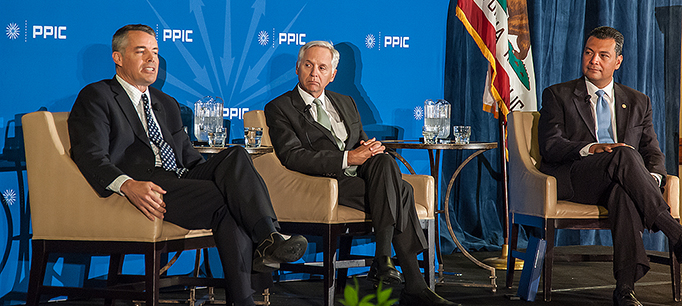
The two candidates running for California secretary of state bring different resumes to the campaign but found much to agree on in a conversation sponsored by PPIC Thursday. Alex Padilla, California state senator, and Pete Peterson, executive director of the Davenport Institute at Pepperdine University, talked about their priorities in a question-and-answer session moderated by Mark Baldassare, PPIC president and CEO.

Both candidates advocated improving the use of technology—to engage voters and improve the voting experience, speed up the disclosure of campaign contributions, and improve the business registration process. Both advocated better use of data and research from outside organizations—from civic engagement groups to the U.S. Census to think tanks and universities—to more proactively register and inform voters. Some of the research PPIC has done on voter participation figured into the discussion of voter engagement, including Voter Turnout in Primary Elections and Expanding California’s Electorate: Will Recent Reforms Increase Voter Turnout?

Each candidate listed a number of goals for their term in office, if elected. Asked to reduce their voter turnout goals to a number, Padilla said he was committed to the addition of 1 million more active voters to the rolls and Peterson said he expected to generate an increase in turnout of 5 or 10 percent.

The event was part of PPIC’s 2014 Speaker Series on California’s Future. PPIC does not support, endorse, or oppose any political parties or candidates for public office.

Improving the Vote-by-Mail System

For the first time in eight years, there is no incumbent running for California secretary of state. This offers a great opportunity to step back and consider where California’s elections are, and where they ought to go next. (You can hear what the candidates have to say about the future of elections at a PPIC event on Thursday, September 11.)

Any such assessment must take a hard look at voting by mail. We see more voters using this option in every passing election, with the growth actually accelerating in recent primaries. If the trend continues, about 57 percent of the ballots in this fall’s election will be cast this way.

The question is no longer whether vote-by-mail is a sensible way to run our elections; it is now how best to manage the vote-by-mail elections we already have. This has put a number of critical issues on the table:

  1. Signature verification. The signature on a vote-by-mail ballot must be compared to the one on file to ensure that the appropriate person cast the ballot. This slows down the process, leaving the outcomes of a few races in doubt for weeks after Election Day. Some counties have been moving to verification by computer to deal with the backlog, but the standards for this sort of verification are murky. The new secretary of state can help clarify which technology is permissible and how this technology should be used.
  2. Late ballots. In a recent PPIC report, we noted that, while the vast majority of vote-by-mail ballots arrive on time, thousands of ballots arrive late and are not counted at all. The legislature has passed a bill (SB 29) that would allow most of these late ballots to be counted. If Governor Brown signs this bill, the next secretary of state will need to monitor the new status quo as it unfolds. In particular, county registrars may face a surge in late ballots as more voters take advantage of the new relaxed standard.
  3. Shrinking postal service. As email and the Internet have grown in popularity, the U.S. Postal Service has been forced to lay off staff and consolidate processing centers. Our PPIC analysis suggests that these changes have not yet created problems for vote–by-mail, but it is a development that deserves constant monitoring.
  4. All vote-by-mail? When 70 percent of the ballots in an election are vote-by-mail, one wonders whether it’s time to abandon the old polling place approach and mandate the vote-by-mail system for everyone. Colorado, Oregon, and Washington use such a system, and it has generally worked well. There are a number of arguments for the change. The persistence of a dual system may add to the complexity of counting ballots, especially with yet another system—same-day registration—coming on-line in the next few years. Moreover, while the evidence for vote-by-mail’s effect on voter turnout is mixed, it generally suggests a small but positive effect. Finally, given the fact that county registrars continue to struggle with small budgets and increasing demands, an all vote-by-mail system would offer a much-needed cost savings.

We will probably never reach a point where every voter voluntarily votes by mail. There will always be some, both young and old, who prefer to show up at a polling place. But we must think carefully about accommodating the new reality of a mostly vote-by-mail system, and how best to make it work for everyone.

Who Are California’s Independent Voters?

The partisan composition of California’s electorate continues to evolve as an increasing number of voters register as independent or decline-to-state. Today, independents make up 21 percent of the electorate, while Democrats make up 43 percent and Republicans 28 percent. Since 2006, the share of voters registering as independent has increased 2 points, while Republican registration has declined 6 points and Democratic registration has not changed. Looking back further, we see that independent registration has more than doubled since 1994 (10% to 21%), while Democratic registration has declined 6 points and Republican registration is down 9 points.

What do we know about independent voters in California?

Among independents considered likely to vote by the PPIC Statewide Survey, about three in 10 identify themselves as liberal and the same number say they’re conservative. Four in 10 say they are middle-of-the-road. About four in 10 independent likely voters say they lean toward the Democratic Party, while about three in 10 lean toward the Republican Party. Three in 10 say they lean toward neither major party.

Given these party leanings, it may not be surprising that independent likely voters often agree with Democrats on issues that divide voters along party lines. For example, 77 percent of Democrats and 63 percent of independents are in favor of legalizing same-sex marriage. Republicans are opposed (55% oppose, 41% favor). And 81 percent of Democrats and 57 percent of independents are in favor of taxing the wealthy, while 68 percent of Republicans are opposed. But on other issues that divide partisans, independents are themselves split. For example, while strong majorities of partisan likely voters fall on each party’s side of the debate over the size of government (Democrats: 63% higher taxes and more services; Republicans: 79% lower taxes and fewer services), independent likely voters are divided (51% lower taxes and fewer services, 44% higher taxes and more services).

No matter where they stand on issues and ideologies, independent likely voters tend to have unfavorable views of political parties. Solid majorities have unfavorable opinions of the Democratic Party (59%, 38% favorable) and the Republican Party (73%, 25% favorable), and 41 percent have an unfavorable opinion of both parties.

These weaker ties to the major parties may help explain why independents make up a disproportionate share (30%) of those we consider infrequent voters. Will they turn out this November? In an election year in which only about half of independents (49%) say they are closely following news about gubernatorial candidates, this is an open question for all contenders on the ballot.

The Politics of Global Warming

The Global Warming Solutions Act, AB 32, was passed with bipartisan support and signed by Republican governor Arnold Schwarzenegger in 2006. The law—which requires state to reduce its greenhouse gas emissions—received strong majority support (65%) among Californians when the PPIC Statewide Survey first asked about it in July 2006, with strong majorities of Democrats (67%), Republicans (65%), and independents (68%) in favor.

Overall support for the law remains strong: in our July 2014 survey, 68 percent of Californians said they favored it. But the partisan makeup of the supporters has changed significantly. While support among Democrats and independents has remained solid, it has gradually decreased among Republicans. Today, 81 percent of Democrats and 62 percent of independents favor the law, but only 39 percent of Republicans do.

What happened?

We have found that this partisan divide is linked to two main factors. The first is the increasingly common belief among Republicans that global warming is not imminent. Fewer Republicans today say the effects of global warming have already begun (47% 2006, 35% today) or that global warming poses a serious threat to California (57% 2006, 48% today). Attitudes among Democrats and independents have not changed much.

The second factor is rising concern among Republicans that addressing global warming will affect the economy and jobs. From the beginning, proponents of AB 32 have argued that the threat posed by global warming requires immediate state action and opponents have expressed concern about the economic impact of regulating greenhouse gases. Our survey shows that during the Great Recession, support for taking action right away declined among all Californians. Support did not drop much among Democrats and independents, and it bounced back as the economy recovered. But immediate action on global warming was never popular among Republicans, so perhaps it is not surprising that even as the state’s unemployment rate declined from its peak in 2010 most Republicans continued to say the state should wait until the economy improved.

Their differences may be growing, but partisans do still agree on some aspects of addressing global warming. Majorities across parties continue to favor requiring increasing energy efficiency for residential and commercial buildings and appliances. They also favor requiring industrial plants, oil refineries, and commercial facilities to reduce their emissions.

These results show that policymakers face a challenge in forging compromises on the contentious aspects of climate change policy. But they also have areas of consensus to build on.

Six Takeaways from the June Primary

For those of us involved in polling and election analysis at PPIC, the just-released California Secretary of State’s (SOS) Statement of the Vote offers a treasure trove of data about how our democracy is working. The latest SOS report also deserves close scrutiny because the top-two primary, which had its debut in June 2012, operated in statewide contests—such as the governor’s race—for the first time this year. My colleagues Eric McGhee and Daniel Krimm have provided an excellent analysis of the outcomes of legislative district races. Here, I’m going to focus on six election trends—regarding statewide offices, state propositions, and voter participation—that surfaced in my read of the final numbers.

  1. Advantage Incumbents. The big winners in the statewide races were current officeholders: the governor, lieutenant governor, attorney general, insurance commissioner, school superintendent, and controller (now running for treasurer). The number two vote-getters trailed these state officials by wide margins in each race, even while PPIC’s polling indicates that half of likely voters say the state is headed in the wrong direction. These primary results underscore the uphill battle faced by political newcomers in statewide elections. This is best exemplified by first-time GOP candidate Neel Kashkari, who received just 839,767 votes or 19% of the vote—even after spending millions of his own dollars on his gubernatorial campaign. The six Democratic incumbents start out with huge numerical advantages in their statewide races in November.
  2. Major Parties Rule. The top-two primary winners in the eight statewide races are all major party members. The November ballot includes seven statewide races in which Democratic and Republican candidates face off. Only the nonpartisan school superintendent’s race has a Democrat facing a Democrat. The candidates from minor parties—which used to have their own primaries—clearly have a harder time prevailing under top-two primary rules. But the statewide candidates with no party preference—also known as independents—were also shut out, even though they are members of a large voting bloc. The absence of minor party and no party preference candidates could result in a depressed voter turnout in November. In California, 28% of voters belong to a minor party or have declared as no party preference, and PPIC polling indicates that many likely voters have unfavorable views about the Democratic and Republican parties.
  3. Legislature Wins Big. Two measures placed on the ballot by the legislature passed easily: State Proposition 41 (Veterans Housing and Homeless Bond Act), with 65 percent of the vote, and State Proposition 42 (Public Records, Open Meetings, Reimbursements), with 62 percent. These two measures attracted little discussion or media interest. Their success in June is consistent with the high pass rate for legislative ballot measures over time. Still, many likely voters say they disapprove of the legislature, making the easy passage of these measures rather surprising. At the same time, this trend bodes well for the legislature’s propositions on the November ballot, such as a rainy day fund proposal and a possible state water bond.
  4. Knowledge Gaps Loom Large. State Senator Leland Yee, who was embroiled in a political scandal, accused of committing felony crimes, and withdrew his name as a candidate, still placed third in the secretary of state’s race. In fact, he received 380,361 votes or 9% of the vote. His surprising showing raises fundamental questions about the level of voter knowledge and the effectiveness of both the state’s media and the official voter guides in providing election information.
  5. Voters Are Disengaged. The primary turnout this June fell to an all-time low of 25% for registered voters and 18% for eligible adults. Even more troubling: turnout among registered voters in Los Angeles (17%), San Bernardino (19%), Riverside (22%), and Orange (24%) Counties was even lower than the statewide average. Since the top-two candidates are chosen in the primary, low primary turnouts may undermine the legitimacy of November elections over time. Moreover, these numbers raise a larger question: Are low turnouts in four populous Southern California counties symptomatic of a deeper civic malaise?
  6. Results Are Slow. A record 69.4% of primary voters mailed in their ballots this year. While this method is growing in popularity, we are learning that it results in a slow vote count that leaves the outcome of tight races in limbo for weeks. This year, the controller’s race was one of the closest in state history, with a 481-vote margin of victory, and the top-two winners were not known until the last day of June. In the future, we could be waiting for weeks to learn the winner in a tight governor’s race, or California’s outdated voting system could be exposed in a close presidential election. The 58 county registrars will need prodding and assistance by the SOS office to apply modern technology to speed up their vote-by-mail counts. Moreover, given the popularity of voting by mail, we should be looking for ways to make it easier for voters to do so—in part to increase voter participation.

Every election occurs in a unique political context. The 2014 primary results could be an anomaly rather than indicative of some flaws with the top-two primary system. The 2016 presidential year and the 2018 gubernatorial year may feature competitive statewide primary races that lead to different outcomes. Still, the six issues that surfaced in this primary also reflect longer-term trends that are worthy of serious consideration.

PPIC has invited California’s two secretary of state candidates to participate in a conversation with me about the future of California’s elections on September 11 in Sacramento. Stay tuned for more information about how you can attend or watch this PPIC event.

The Vanishing Line-Item Veto

California officially has a budget for the coming fiscal year. The state plans to spend $156 billion, about 7.5% more than last year.

As in most other states, in California the governor has line-item veto power. After the budget passes, he can remove or reduce individual provisions without the legislature’s approval. That’s a lot of potential authority over the budget.

What did Jerry Brown do with such tremendous power? Not much. He removed or reduced only 10 budget items, cutting a total of $37.9 million. In the context of a $156 billion budget, that’s a rounding error.

And that’s par for the course with this governor. Brown made his highest number of vetoes (42) in the first budget after his election in 2011; these cuts amounted to one-fifth of one percent of the $267.4 million ultimately spent that year. Last year, he vetoed 30 items that added up to only $40.7 million—that’s like a typical California household reducing its annual spending by about $17.

Many governors have gone light on line-item vetoes, but Brown’s veto numbers are low even in historical context. His vetoes have averaged about a tenth of one percent of each year’s final budget. By contrast, Schwarzenegger (2004–2010) averaged two-thirds of a percent, Davis (1999–2003) and Wilson (1991–1998) about three-quarters of a percent, and Deukmejian (1983–1990) a whopping 2.5 percent. Brown himself, when he was governor in the late 1970s and early 1980s, averaged about three-quarters of a percent in line-item vetoes (we do not have data for 1975, his first year).

There are a number of reasons for the recent harmony between the governor and the legislature. But an important one is likely the new threshold for passing the budget. It used to take a two-thirds vote in each chamber, which required at least some members from each party to sign on. As of 2011, only a simple majority of each chamber is required, so Brown has been able to conduct all the negotiations within his own party. In today’s polarized political environment, that simplifies the process enormously—it also helps explain why each of Brown’s budgets has been approved roughly on time, ending a decades-long trend of budgets passing later and later.

Of course, this streamlining of the process entails sidelining Republicans from budget negotiations. Whether that is too high a price to pay depends very much on one’s perspective. But for better or worse, we may be settling into a new budget status quo.

Local Water Funding in the June Primaries

Much of the current water talk in Sacramento surrounds a new state water bond for the November ballot. Yet as we show in our study Paying for Water in California, most water spending—84 percent—is actually raised locally. While passage rates on local water measures have been fairly high since 1995 (72 percent passing), few make it on the ballot (on average only six per year). This is largely because funding for many critical water services—including stormwater management, flood protection, and ecosystem and watershed improvements—often requires two-thirds of voters to approve, and local officials are reluctant to put such measures on the ballot unless they think they can win. In the June 3 primary election, only two local water measures were proposed. The results illustrate the challenges of funding water services that require direct voter approval.

In Contra Costa County, Orinda’s Road and Storm Drain Repair Bond passed with 75 percent approval. It authorizes the city to issue $20 million in general obligation bonds to fund the restoration and repair of roads and storm drains, plus a property tax increase to pay for the bonds. Broader funding measures like this—which include a water service along with something else—have generally been more successful than exclusively water-focused measures. Local governments seem to have recognized this reality and have increased these kinds of measures in recent years. Unfortunately, measures that fund multiple activities may generate less funding than is needed to fill water service gaps.

The second local water measure, the Lake County Healthy Lake Tax, failed with 64 percent approval (repeating an earlier failed attempt in 2012 that had 63 percent approval). It would have increased the local sales tax by one-half cent for 10 years to pay for the eradication of weeds, algae, and invasive mussels from Clear Lake, the restoration of wetlands, and the improvement of water quality.

As the Lake County example suggests, the two-thirds voter threshold for local special taxes and bonds is a significant obstacle. Orinda twice failed to pass measures in the mid-2000s, despite 64 percent approval. Since 1995, 65 percent of the measures requiring two-thirds approval passed, but 84 percent would have passed at the 50 percent threshold that is required for local general taxes and statewide fiscal measures. We can’t know how many more measures would have been put on the ballot had the voter threshold been lower.

Funding these essential water services through local tax and bond measures is a marked contrast to funding for water supply and sewer services, which are paid for with revenues from monthly customer bills. These services are generally in good fiscal shape because when new funds are needed, providers are required only to give customers the opportunity to protest rate increases.

To help address water funding gaps, California should consider treating flood and stormwater services like water and wastewater. It would also be helpful to treat local special taxes like local general taxes and statewide fiscal ballot measures—requiring a simple majority vote. Of course, this would require constitutional reforms. But without these changes, the state will need to provide much more support to local governments to pay for services that are essential to all Californians.

How Can California Increase Voter Turnout?

Days after a California primary that may set a record for low voter turnout, election experts gathered to take stock: What happened last week and how can the state engage more Californians in elections?

PPIC research fellow Eric McGhee first provided a brief overview of how California’s electoral reforms have worked so far. He noted that the top-two primary probably did not worsen voter turnout but did nothing to reverse the decline either. In the absence of an exciting race or issue, it’s unlikely that a primary reform alone will draw more voters to the polls, he said.

The consensus among panelists is that there is no single reform that will reverse declining primary turnout. Improving outreach, educating voters, making registration and voting easier—all are needed to increase engagement.

Jill LaVine, Sacramento County voter registrar, highlighted the importance of voter education. Because there were no high-profile candidates or issues in the June primary, there wasn’t much advertising on television—where many voters get information. She noted the efforts that election officials have made to make voting easier—for example, an app to help voters find polling places, and phone banks to help answer questions. But many Californians are confused by the number of changes in the state’s primary, from the date to the process of voting itself. Along with other panelists, she stressed the importance of fully funding election programs that are mandated by the state. For example, the state no longer provides funding to counties to carry out the permanent vote-by-mail program, which is used by a majority of the state’s voters.

Ethan Jones, chief consultant of the Assembly Elections and Redistricting Committee, said the legislature is addressing structural barriers to voting, such as allowing residents to register and vote on the same day. This reform, which will go into effect in future elections, will allow Californians who become engaged in an issue or candidate at the last minute to participate. There have also been efforts to address attitudinal barriers, to allow 16- and 17-year-olds who are taking civics classes to “pre-register” to vote and be added to the voter rolls when they are 18, for example.

Astrid Garcia, deputy director of the nonpartisan Future of California Elections, noted that in a state as large and diverse as California, it’s crucial to address all the steps that lead up to voting and make the experience positive, so that voters turn out again in the next election. She noted that beginning this year, legal permanent residents can be poll workers, which will educate these Californians about the process and train a cadre of bilingual poll workers for the future. She also noted the importance of “meeting voters where they are,” by allowing residents to register to vote when they seek government services. She also said that it will take time to realize the results of these reforms.

Is the Top-Two Primary to Blame for Low Turnout?

Turnout in California’s recent primary election was abysmal: the secretary of state is reporting that 21.5 percent of registered voters participated. This report doesn’t include many ballots yet to be counted but, according to educated guesses, those ballots won’t push turnout over 23 percent. This would be a record low for California.

Should we blame California’s new “top two” primary for this sad state of affairs? After all, turnout has been pretty low in both of the top-two primary elections California has had so far. Surely it’s part of the story?

This is an explanation in search of a theory. There is no clear reason why California’s new system would discourage people from voting. Many voters probably don’t even remember that we have a top-two system until they look at their ballot. When I examined this issue in a recent PPIC report, I found little evidence that open primaries affect turnout one way or the other. We can’t credit the top-two, but we can’t blame it, either.

The ups and downs of statewide turnout are driven by top-of-the-ticket competition: president, U.S. Senate, governor, and initiatives. An interesting race in one U.S. House, state assembly, or state senate district is going to engage only the voters in that district—often only a fraction of them.

For better or worse, top-of-the-ticket competition has been in short supply of late. In 2012, the presidential primary season was basically over by the time California had its primary, and Dianne Feinstein’s reelection to the U.S. Senate that year was all but a foregone conclusion. This time around, there is no presidential contest and no U.S. Senate race, and the gubernatorial contest has yet to catch fire. On top of all that, statewide citizen initiatives are now banned from the primary ballot. The legislature can place its own measures on the primary ballot (and did so in 2014), but these often lack the hot-button excitement of a citizen initiative campaign.

California does need to think seriously about how to improve primary turnout, which has been declining for decades. But we can’t pin this primary’s low participate rate on the top-two system. It was a predictable result of the statewide campaigns offered to voters. We had one of the highest primary turnouts on record in February 2008, when both the Republicans and Democrats had competitive presidential primaries and California had a say in deciding the outcome. If we get more competition in 2016 or 2018, we’ll probably see a different outcome than we did last week.

Quirks of the Top-Two Primary

This week, California voted for the second time under its new top-two primary system. The boldest innovation of this system is that it allows the top two primary winners to be from any party, even the same one. There will 25 such same-party races this fall, out of 160 total.

In an earlier blog post, I pointed out key differences between the primary and the general electorates: primary voters are typically older and less diverse—and often tilt Republican. These differences can end up producing same-party contests in places where they probably would not have occurred if primary and general election voters weren’t so different.

These same-party contests do not raise questions unless they occur in a district in which either party would typically have a legitimate shot at winning. And so far, the vast majority of same-party contests have been for seats that would have gone to somebody of that party no matter what.

But in 2012, Congressional District 31 in San Bernardino County hosted a same-party Republican runoff—although this district would likely be competitive between the two parties under most circumstances. The complexion of the primary electorate partly explained this outcome, but it also occurred because more Democrats than Republicans competed for the seat. This caused the Democratic candidates to split the loyal Democratic vote too many ways—none of them gained enough support and two Republicans advanced.

The pattern has continued in 2014. Congressional District 31 is again in the mix, avoiding a same-party Republican runoff by just 390 votes (out of more than 42,000). Meanwhile, in Los Angeles and Ventura Counties, Congressional District 25 will host a runoff between two Republicans—although this district slightly preferred Obama in 2012. That doesn’t necessarily mean that CD 25 would have been competitive this year, but all the same, it’s worth thinking about whether a same-party contest is really the match-up voters there would like to see.

The most surprising contest to come close to same-party status this cycle is the statewide race for California controller. The Democrats ran three candidates and the Republicans ran two. At the time of this writing, a same-party Republican race in the fall has been avoided by just 1,924 votes out of almost 3 million cast, a difference of less than one-tenth of one percent. This outcome may well hold, but races this close occasionally flip as more ballots are counted.

These sorts of outcomes are never going to be common under the top two. But in two election cycles they have been common enough that we ought to think about ways to address them. As part of the top-two reform, the legislature banned write-in and independent candidacies in the fall election. I have suggested we revisit that decision, and allow for such candidacies if there is demand. The bar could be set high enough to ensure that the option was rarely used, but low enough to make the option realistic, just in case.

The question is not whether same-party competition is a good idea. In uncompetitive seats, one can make a solid case that it offers choices that voters would not otherwise have—choices about which faction of the party ought to represent the district. But in places where the real conflict is between Democrats and Republicans, a same party contest closes off the very choice the top two is meant to promote.