Are Voters Ready for the Primary?

All signs point to a low turnout in the primary next week. The most important factors that might bring voters to the polls are absent. California recently shifted all citizen initiatives to the fall ballot, depriving this year’s primary ballot of the draw that comes from those campaigns. And the race at the top of the ticket, for the governor’s seat, has not energized voters, as our latest PPIC Statewide Survey shows.

We find that Governor Brown, with the support of 48 percent of primary likely voters, will likely advance to the November general election. In the contest to see who would meet Brown in November, Republicans Tim Donnelly and Neel Kashkari are locked into a close race (Donnelly 15%, Kashkari 10%). However, one in four primary likely voters (27%)—including 34 percent of Republicans and 35 percent of independents—are still unsure of who they will vote for (17% of Democrats are undecided). And there are other signs that point to voter malaise.

We asked primary likely voters how closely they are following news about the gubernatorial candidates, finding that just 46 percent of primary likely voters are following news about candidates very or fairly closely. By comparison, in May 2010, 67 percent of likely voters were closely following news about candidates. And while attention this year has dropped across parties, it is especially low among Republicans. Today, just 39 percent of Republicans report closely following news about gubernatorial candidates; in May 2010, 68 percent said they were doing so (Democrats: 52% today, 66% 2010; independents: 52% today, 66% 2010).

Looking elsewhere in the survey, we find that only half of primary likely voters (53%) say they are satisfied with their candidate choices in the primary election for governor, while one in three are not satisfied (32%). Democrats (65%) are by far the most satisfied with their choices, while fewer than half of Republicans (43%) and independents (48%) express satisfaction. Of particular note, among those who are not satisfied nearly half (46%) say they are undecided on who they would vote for.

So with the election just days away, it appears as though many Californians have yet to tune into the governor’s race. Time will tell whether future gubernatorial contests can capture the attention of California voters and reverse the state’s recent history of low turnout in its primary elections.

Who Likes Proposition 13?

One of the most remarkably stable trends in California public opinion is the strong majority support for Proposition 13, even as the state’s demographics and politics have changed dramatically. This historic citizens’ initiative had the immediate fiscal impact of lowering property tax rates, restricting annual property tax increases, and raising the bar for local special taxes to a two-thirds majority vote. It also fundamentally changed the state-local relationship in California and ushered in the national tax revolt. Its supporters are shaping our fiscal choices today—even though many were not old enough to vote when the measure passed 36 years ago.

Proposition 13 passed in June 1978—toward the end of Jerry Brown’s first term as governor—with a 65 percent yes vote. Our most recent poll finds that 63 percent of likely voters today say that Proposition 13 has been mostly a good thing—as majorities have said since we began asking this question in 2003.
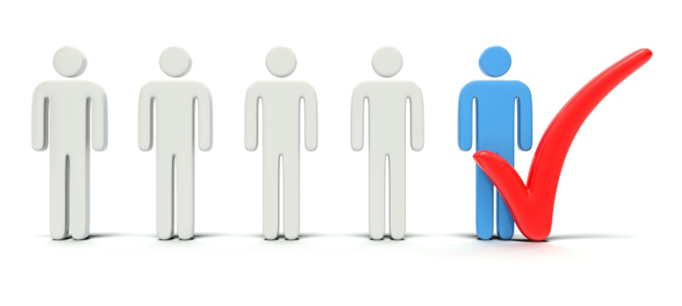
Among Proposition 13’s supporters today, about half were not old enough to vote, and 14 percent were not even born in 1978. As a group, they are mostly whites and homeowners, with annual household incomes of $60,000 or more. But they are also politically diverse. Supporters are evenly divided along party lines, with four in 10 Democrats, four in 10 Republicans, and two in 10 independents or other party members in this camp. More than half describe themselves politically as middle-of-the-road or liberals, while 45 percent say they are conservatives. About half live in the San Francisco Bay Area or Los Angeles.

What unites Proposition 13 supporters? One of their signature features is their higher level of distrust in state government. Large majorities say that the state government wastes a lot of the taxpayer’s money, believe that the state government is run by a few big interests looking out for themselves, and say that they trust the state government to do what is right only some time or none of the time. Six in 10 say that the state is headed in the wrong direction, disapprove of the way that the state legislature is handling its job, and rate the state budget situation in California as a big problem. Most say they would prefer to use the budget surplus to pay down the debt rather than restore social services. They are evenly divided when asked if they approve or disapprove of Governor Jerry Brown’s job performance—however, seven in 10 are in favor of his budget plans and approve of a rainy day fund plan that is going to the voters in November.

Proposition 13 supporters register the most consensus when asked about who should make choices for the state budget today: 83 percent want the California voters to make some of the decisions about spending and taxes at the ballot box, while only 13 percent want the governor and legislature to make all of the decisions.

Perhaps the most enduring contribution of Proposition 13 is that it has given the voters a significant and growing role in fiscal policymaking. Voters will decide the fate of the rainy day fund proposal, as well as a multibillion-dollar state water bond also scheduled for the November ballot.

When voters cast their ballots this year, it is important to be aware of the mindset of the sizable and politically diverse coalition of Proposition 13 supporters: a suspicious view of state government and a cautious approach to spending—even in the context of a strengthening fiscal and economic recovery in California.

May Survey Looks at Views on Budget, Drought

The May edition of the PPIC Statewide Survey, Californians and their Government, explores attitudes toward the governor’s latest proposed budget and gauges preferences in the gubernatorial primary. It also examines opinions on health care reform, the drought, poverty, and climate change.

PPIC research associate Dean Bonner presented the results of this wide-ranging survey at a lunch briefing in Sacramento last week.

Electoral Reforms Face New Test

California’s political reforms—redistricting and the top-two primary—were meant to shake up the status quo through radically redrawn voting districts and a primary system that let voters choose any candidate of any party, and advanced the top two candidates (also regardless of party) to the fall election.

The first time out the gate, in 2012, the reforms didn’t disappoint: numerous incumbents retired, many seats were open, and a lot more candidates threw their hats in the ring. It was the shot across the establishment’s bow that supporters had been looking for.

Things are calmer in this year’s legislative and congressional races. The most obvious sign: an unusually large number of candidates facing no formal opposition. There were eight such races in 2012 and an average of 7 under the previous primary system. Today there are 20.

These candidates may not remain completely uncontested, since there are reasons to think we may see more write-in candidates this time around. The deadline for filing as a write-in—at least one whose votes are actually counted—comes after the normal candidate filing deadline. Under the top two, potential write-ins can wait to see whether a heavyweight ends up uncontested and then jump into the race for less money and effort. As the only other candidate, these write-ins will be guaranteed a spot in the fall campaign. This was not a popular approach in 2012, but candidates are still learning the system, so we may be seeing this strategy coming into its own. We will know more once the official write-in list is announced later this month.

In 2012, there were also a number of incumbents who faced challengers from within their own party. This was a sign, in part, of the better odds facing those challengers under the top two system: so long as they finished at least in second place, they would get another chance to topple the incumbent in the fall campaign. Nonetheless, only a handful of these challenged incumbents lost. Perhaps as a result, fewer incumbents overall face an intra-party challenge this time: 28% this year compared to 42% in 2012. And with only a couple exceptions, even those incumbents facing an intra-party contest are in a dominant financial position.

Finally, there are fewer open seats this year. In 2012, an extraordinarily large number of incumbents chose to retire or run for another office, leaving nine seats open for the U.S. House and 35 open for the state assembly (open seats for the state senate were more in line with past experience). This year, there are six open seats for the U.S. House—still high by historical standards, but less so. And the 23 open seats for the assembly aren’t all that many, at least in the era of term limits.

However, the seats that have come open are hotly contested, as open seats usually are. The great majority of these races feature at least three candidates, and a few have far more than that—with the prize going to Congressional District 33, where no fewer than 18 candidates are vying to replace retiring incumbent Henry Waxman. Moreover, fundraising in these races is much more evenly distributed across a range of candidates.

We are still early in the election cycle, and between the primary and the general there are still plenty of opportunities for surprises. But so far, it looks like the revolution, such as it was, is coming to a close, and a new status quo may be settling into place.

The Power of the Primary Voter

Voters are starting to think seriously about whether or not to vote on June 3—in fact, the first vote-by-mail ballots are already being returned. And because of a recent change to California’s primary system, this decision about voting will be more important than ever.

The voters who turn out in California’s primary elections have typically been different than the ones who vote in the fall. They have been older and less diverse, with a smaller share of Latinos and Asian-Americans. They have also tilted Republican in most cases. In short, the primary electorate is the California we once were, not the California we have become.

These differences mattered in the past, but not as much as they might have. Any party that placed a candidate on the primary ballot would be guaranteed to have a candidate on the ballot in the fall. Indeed, that was the point of the primary: to choose one person to represent each party in the general election. Now California has a radically open “top two” primary. Voters can vote for any candidate they like, and the top two candidates, regardless of party, advance to the fall election. That means a party is no longer guaranteed a spot in the final round.

Before the top two, the differences between the primary and the general electorate could affect the kind of candidate nominated by each party, but not whether the party nominated a candidate at all. Today, the primary electorate has much more say over what the general election will look like.

When the state first used this system in 2012, almost one-fifth of the races ended up with same party contests in the fall. This included Congressional District 31, where two Republicans faced off in a competitive district that otherwise leaned Democratic. If the general electorate had turned out in the primary, it almost certainly would have been enough to change District 31 into a race between a Democrat and a Republican—and the Democrat would have had a decent chance of winning. That’s a problem. Of course, this was just one district. But a bias in the primary electorate could create—or prevent—a same-party contest in a statewide race as well.

What’s the solution? Every primary system runs some risk of strange results, but the top two is especially aggressive at closing off alternatives. It might make sense to offer a sort of “safety valve”—the option of a third candidate in the fall in cases where there was enough demand for one. California used to allow both independent and write-in candidacies in the fall, but the top two banned both. The legislation removing these options was passed with a simple majority in the legislature, so it would be relatively easy to change. The bar for such safety-valve candidacies could be set high enough to ensure they would remain rare. (Of course, there could always be legal challenges, but the merits of that approach are better left to lawyers to determine.)

The top two offers a lot more choices to those who show up to vote in the primary. We should be careful about giving these voters too much power to then dictate the choices for everyone else.

California’s Taxing Dilemma

As the April 15 deadline for filing taxes looms, we asked Californians in the latest PPIC Statewide Survey how they view their state and local tax burden. Their responses point to a disconnect between public opinion and the views of many fiscal reformers.

A record-high 60 percent say that they pay more than they feel they should in state and local taxes. Just two years ago, 46 percent held this view. Today, six in 10 Californians also have the perception that California currently ranks above average or near the top in state and local tax burden per capita. And they are correct: A Tax Policy Center report recently ranked California’s 2011 state and local tax burden as the 11th highest in the nation.

Further, a record-low 50 percent of Californians say that the present state and local tax system is very or moderately fair. In contrast, 57 percent said it was at least moderately fair two years ago. Across income categories today, perceptions of the fairness hover around 50 percent.

What changed in the last two years? For one thing, voters passed Proposition 30, temporarily raising the state sales tax, as well as state income taxes on wealthy residents.

Today, eight in 10 Californians say that major or minor changes are needed in our state and local tax system. But their views of change don’t necessarily match those of fiscal reformers, who have argued for years that our state budget is too dependent on wealthy individuals with volatile income tax payments. Some reformers have argued that broadening the sales tax base to include services would be an effective way to avoid the extreme ups and downs in state revenues that play havoc with state and local government budgets.

But Californians appear to have little interest in changing the tax system in ways that may impact their pocketbooks. Among four types of state taxes that we asked about in our March 2014 survey, six in 10 oppose extending the sales tax to services that are not currently taxed, and fewer than half favor extending the sales tax to services even if it means lowering the overall state sales tax rate. However, six in 10 would support raising income taxes on the wealthy, while about half favor raising state taxes paid by California corporations.

Voter opposition to extending the sales taxes to services is higher among those who feel that they are already paying more than they should in taxes. Even the more popular proposals—raising corporate taxes and income taxes on the wealthy—are favored by fewer than half of the voters who feel they are paying more taxes than they should.

Meanwhile, voters are saying that they want more state funding for education and health and human services. Some state and local elected officials would also like to raise more state revenues to restore funding for services that were cut during the Great Recession, or pay for new state and local programs. Others are thinking about how to maintain revenues after the sunset of Proposition 30’s temporary taxes.

If tax reform proponents ask voters to raise taxes or to make changes to the state and local tax system any time soon, they will need to be mindful of voters’ current views on these issues.

Video Highlights New Survey’s Key Findings

The March PPIC Statewide Survey examines several major issues in California, including water, high-speed rail, marijuana legalization, and taxes. The survey also finds that three months before the primary, Governor Jerry Brown remains a strong favorite for re-election this year.

The wide-ranging survey also looks at Californians’ views on national issues—such as immigration and health care reform, and abortion —and provides approval ratings on federal elected officials.

PPIC research associate Jui Shrestha presented the results of the survey at a luncheon briefing in Sacramento.

Should Marijuana Be Legal?

As advocates of marijuana legalization consider another ballot measure in California, how do residents view the issue today?

Currently, our new PPIC Statewide Survey shows that Californians are split: 49 percent favor legalization and 47 percent want to keep it illegal. Last September for the first time a slim majority of residents—52 percent—said they were in favor of making marijuana legal.

Likely voters are more supportive of legalization, as they have been since we first asked about legalization in 2010. Today, 53 percent are in favor and 44 percent are opposed.

There are stark differences across parties and demographic groups on this issue. Majorities of Democrats, independents, whites, blacks, residents with at least some college education, Californians age 18–34, men, and residents in the San Francisco Bay Area and Inland Empire favor legalization. Opponents include majorities of Republicans, Latinos, residents with a high school degree or less, women, and those age 35–54, parents with children age 18 or younger, and Californians living in Los Angeles and Orange/San Diego Counties.

There are divisions, too, among the state’s leaders. Governor Brown and Senator Feinstein have recently expressed reservations about legalization, while fellow Democrat Lt. Governor Gavin Newsom disagrees.

Nearly four years ago Proposition 19—which would have legalized marijuana and allowed it to be regulated and taxed—failed in California by 6 points (47% yes, 53% no). Today, other states are considering following the lead of Colorado and Washington to legalize. It’s clear that the issue is not going away in California—the first state to legalize medicinal marijuana nearly 20 years ago.

Looking at the demographic divisions in California, it will be interesting to see what strategies proponents and opponents use the next time the issue makes the ballot.

Chart sources: PPIC Statewide Surveys: March 2014, September 2013, May 2010.

Rebooting California’s Congressional Delegation

We’ve just passed through retirement season in California politics: the weeks leading up to the candidate filing deadline when incumbents who have decided to step down often make their announcements. Six of California’s 53-member delegation to the U.S. House of Representatives have decided not to run; the latest is Democrat Gloria Negrete McLeod, who is leaving after only one term to run for the San Bernardino County Board of Supervisors. Also retiring are John Campbell, Buck McKeon, Gary Miller, George Miller, and Henry Waxman.

Six retirements might seem like a lot, but California’s rate of open seats this year (11%) is only slightly above the national rate (9%) and in line with the national rate in other recent non-redistricting years. (The disruption caused by redrawn district lines usually increases the number of retirements.)

California had gotten used to low turnover in part because the districts drawn by the legislature in 2001 preserved the status quo. But the new independent redistricting commission and top-two primary have opened the floodgates. Fourteen incumbents either retired or were defeated for reelection in 2012. With this year’s retirements (not all of which can be traced to the reforms), more than a third of the delegation will have turned over by the time the dust settles this fall.

This turnover is having a dramatic impact. At the start of the 112th Congress in 2011, California’s delegation had served an average of 15.1 years, far higher than the national average of 9.8 years (this number comes from the Congressional Research Service). But by the start of the 113th Congress in 2013, California’s average had plummeted to 10.2 years, and with this year’s retirements it will fall to 9.7 (or lower if some incumbents are not reelected). In the context of congressional history, that’s like pressing the reset button.

This rapid change raises questions about what we need from our representatives. On the one hand, we want turnover in Congress. New members can bring new ideas and fresh perspectives. At the very least, we want to feel like we can kick members out of office if we get fed up with them.

On the other hand, experienced representation can be more effective for both the state and the nation as a whole, and even mediocre representatives gain influence over time. Incumbent retirements or losses since 2010 have included the top majority or minority member on eight committees and 10 subcommittees, some of them among the most influential in Congress. The state should expect a diminished profile on Capitol Hill as a result.

Which is better: experience or responsiveness? There’s no simple answer. Without passing judgment on the specific members who have retired, one might argue that the pre-reform delegation had gotten out of whack, with too many members serving too long. But if things shift too far the other direction we could lose all the benefits of experience.

The recent turnover puts California at the national average for the first time in decades. We’ll see what impact that has on both behavior and legislation.

California’s Quietest Reform

California has adopted a lot of high-profile political reforms recently, including a new way of drawing district lines and a radically open primary system. But there’s another reform that is transforming the state legislature without attracting nearly as much national attention.

In June 2012, California voters approved Proposition 28, an important change to the state’s term limits law. Before the reform, a single person could serve a maximum of three two-year terms in the Assembly and two four-year terms in the Senate, a total of 14 years. Under the new law, a person can serve up to 12 years in the Assembly, the Senate, or both. The reform sounds like a tightening of term limits—12 is less than 14—but because legislators no longer face a limit in each chamber, the average length of service will probably increase significantly.

A lot of people have blamed dysfunction in the legislature on the old term limits. Observers have argued that the legislature is short on the kind of relationships and expertise that develop over time, which has led to acrimony and reliance on the expertise of lobbyists. Also, it is often said that members looking to build their records as quickly as possible flood the legislature with unimportant bills, while big problems linger because they take too much time and expertise to address.

When will we know whether the new term limits are helping? Sooner than you might think. Turnover in the legislature has been high since the law took effect. Redistricting helped force a lot of retirements in 2012, a few incumbents lost to newcomers, and there have been several special elections in 2013 to fill vacated seats. As a result, more than half of the Assembly (42 out of 80) is already covered by the new limits.

The new law’s effect on the Senate has been smaller: only two senators, Richard Roth and Andy Vidak, are covered by the new limits. But that’s because termed-out members of the Assembly dominate Senate races and probably will for a while to come. So even though it may take longer for the Senate to switch over, it’s less important if we’re concerned about expertise: since most senators are former members of the Assembly, they already have legislative experience.

Regardless what happens in the Senate, the pace of turnover in the Assembly won’t slow down much. Sixteen assemblymembers will term out this year, and it looks like another seven will be stepping down anyway. When the dust settles this fall, no more than 17 members of the Assembly will be covered under the old limits. The rest will be legally free to serve for at least another 10 years—in some cases 12.

The new California Legislature is coming, ready or not.