Commentary: State Universities Are in a Budgetary Bind

This commentary was published in the New York Times on Monday, April 11, as a response to the question, “Are Public Universities Neglecting In-State Students?”

Many people don’t realize that the states—not the federal government—are the primary funders of public higher education in the United States. Faced with periodic budget crises, competing priorities and difficulty in raising additional revenue, almost all the states have reduced their funding for higher education over the past couple decades.

Continue reading this commentary and the full discussion on nytimes.com.

Introducing the PPIC Higher Education Center

California’s higher education system is not keeping up with the state’s changing economy. Population and education trends suggest that California will face a shortfall of 1.1 million college graduates by 2030. To close this gap and meet future workforce demand, the state needs to act now.

The good news is that higher education policy has gained new prominence in Sacramento. Concerns about affordability and efficiency have opened the way for wide-ranging change in higher education. Identifying policies and resources that improve both student success and institutional effectiveness are essential.

And that is where PPIC comes in.

Today, we are pleased to announce the establishment of the PPIC Higher Education Center. It is dedicated to advancing practical, evidence-based solutions that enhance educational opportunities for all of California’s students—improving lives and expanding economic growth across the state. The center expands on the model of independent, nonpartisan research and constructive engagement that defines all of PPIC’s work.

PPIC laid the groundwork for the center over the past decade with high-quality research on major higher education issues and productive conversations about solutions. The PPIC Higher Education Center represents a significant ramping up of investment in this critical area, and we thank the Sutton Family Fund for its core support of this effort.

The center will focus on three critical issues:

  • Expanding access. Identifying policies that increase and strengthen pathways to higher education, ensuring that all Californians have the opportunity to earn a college degree.
  • Managing finances. Helping to determine the most effective funding approaches, to keep college affordable and broaden the impact of the state’s higher education investments.
  • Improving outcomes. Promoting strategies that produce more college graduates and prepare Californians—and the state’s economy—to be successful in a changing world.

In conjunction with the launch of center, PPIC is releasing Higher Education in California, a set of seven policy briefs on the state’s most critical challenges in higher education. This briefing kit is designed to inform state leaders and to raise awareness more broadly about the important higher education issues facing California.

We invite you to read Higher Education in California and visit our new PPIC Higher Education Center online. We also invite you to stay up to date with PPIC Higher Education Center activities: ·

Photo courtesy of Public Affairs/Sacramento State.

Testimony: Closing California’s Degree Gap

PPIC senior fellow Hans Johnson testified at a joint hearing of the Assembly Higher Education Committee and Assembly Budget Subcommittee on Education Finance yesterday (March 2, 2016). The topic was “Closing California’s Certificate and Degree Attainment Gap.” Here are his prepared remarks.


Thank you for organizing this joint hearing on such an important topic. My name is Hans Johnson. I am a senior fellow at the Public Policy Institute of California. PPIC is a nonpartisan, independent research institute and as such does not take positions on bills before the legislature. My testimony today is based on a recently released PPIC report, Will California Run Out of College Graduates?, which I authored with my colleagues Marisol Cuellar Mejia and Sarah Bohn.

Educational attainment is the single most important determinant of economic well-being for individuals, for states, and for countries. As the California economy continues to change, becoming more technical and requiring more skills of workers, a key question is whether the state’s workforce will be ready to meet these future challenges.

To answer this question, PPIC has developed projections of California’s workforce skills through 2030, focusing on the supply and demand for workers with a bachelor’s degree. We find that the state will fall about 1.1 million college graduates short of economic demand if current trends persist—a problem we call the workforce skills gap. We project that 38 percent of all jobs will depend on workers with at least a bachelor’s degree, but only about 33 percent of workers will have one in 2030. These projections are based on recent economic trends and on forecasts that show a continued increase in the demand for highly educated workers, a demand that is not going to be met by expected increases in the supply of college graduates. So the challenge is clear: either improve educational outcomes for Californians or face a future that has relatively dim economic prospects.

Already we see evidence of strong and increasing demand for highly educated workers. In today’s labor market, workers with a bachelor’s degree have better economic outcomes than those with less education, and that advantage is at or near all-time highs. Over time, college graduates have seen lower rates of unemployment and higher wages than other workers—even through the Great Recession and certainly in the recovery—illustrating that college degrees have become increasingly valuable in California’s labor market.

Future Jobs

To assess California’s future job market, we rely on long-term occupational projections from the state’s Employment Development Department (EDD). Here, we are concerned not just with changes in the state’s overall occupational mix but also with changes in skill requirements within occupational categories. Understanding these changes helps to provide a clearer picture of where the growth in demand for college degrees is likely to occur. To do so, we look at both broad occupational categories, such as business operations, and jobs within those categories, such as marketing specialists.

The projections suggest that the mix of occupational categories in California’s labor market is not going to change drastically over the next decade or so. The fastest-growing categories will include both high and low skills. Among the ten fastest-growing categories, five require high levels of educational attainment and five do not. This means that the bifurcation of California’s occupational mix, an important component of wage inequality, is expected to continue.

Because the demand for highly educated workers within occupational categories has been growing over the past decade, even though the mix of these categories is not shifting much, we expect the economy to require a higher share of educated workers by 2030. In most occupational categories, the share of workers holding at least a bachelor’s degree is projected to increase by 2030.

These increases are projected to occur in most occupational categories, from those regarded as high skill (such as management) to those regarded as low skill (food preparation). Some of this increase will be caused by a shift toward specific occupations within broader occupational categories. But the larger shift is likely to be an increase in educational attainment within specific occupations themselves.

Business operations is a case in point. In 2000, about half of the workers in the business operations occupational category held a bachelor’s degree; by 2013, this share had increased to 60 percent. If these trends continue, 74 percent will have a bachelor’s degree in 2030—a 14 percentage point increase over 17 years. But as an overall occupational category, business operations will make up a similar share of the economy as it does today—3.0 percent in 2030, compared with 2.7 percent in 2013.

The increase in educational attainment within this occupational category is occurring because its fastest-growing specific occupations include some with high levels of education—for example, market research analysts and marketing specialists, 75 percent of whom hold at least a bachelor’s degree. In addition, some specific occupations have seen a large increase in the share of workers with college degrees—for example, the share of fundraisers with a bachelor’s degree increased from 44 percent in 2000 to 84 percent in 2013.

Overall, there are no indications that the rocky economic landscape of the recent recession has shifted the trend in demand for highly educated workers. In the past, a strong demand for highly educated workers occurred as the economy shifted toward occupational categories and industries that demanded these workers. But in the 1990s and—based on our current analysis—through the 2000s, the strong demand for highly educated workers has reflected growth in education levels within industries and occupations.

Do these projections indicate a real demand, or are they simply evidence of a trend toward overeducating the workforce? One way to distinguish between these two possibilities is to examine the wage premium paid to college workers—that is, the extra wages employers are willing to pay college workers compared with less educated workers in the same occupational category. Positive and increasing wage premiums for college-educated workers reflect the economic demand for high skills. In general, the college wage premium is large and increasing economy-wide; moreover, we find that within occupational categories, the same is generally true. College-educated workers enjoy positive and significant wage premiums within almost every occupational category. These findings indicate that the strong demand for highly educated workers is likely to continue because employers and the economy require the skills associated with more highly educated workers.

Of course, the labor market does not value all college degrees equally. For degrees in highly lucrative fields, such as engineering and computer science, the lifetime wage premium—that is, the expected present value of the gain in wages by completing college, even after accounting for college costs—can total more than $1 million; but even for degrees with the lowest economic returns, the lifetime wage premium totals more than $200,000.

Future Educational Attainment

The share of adults in the workforce with a bachelor’s degree or more will increase only slightly—about 1 percent—by 2030. To a great extent, this slow growth stems from the retirement of the numerous and very highly educated members of the baby boom generation. Today, the best-educated age group in California consists of adults age 60 to 64. By 2030, these adults will be retired.

In the past, retirees tended to be less educated and relatively few in number—and they were replaced by younger, more-numerous, and more-educated adults. In the future, this will no longer be the case. Indeed, the retirement of the baby boomers represents the first time in California’s history that such a large and well-educated generation is exiting the labor force. This loss helps to explain the size of the skills gap we see in 2030.

California is unlikely to attract enough highly educated migrants from elsewhere to close the skills gap. For a long time, the state has relied on migrants to supply employers with the college graduates they need. Until recently, more of California’s college graduates, by percentage, were born elsewhere in the United States. And since 1980, the share of college graduates from other countries has increased quickly, a reflection of the globalization of the state’s economy—and we expect this to continue. Were it not for these increases, the size of the skills gap would be even larger.

California residents are making slight improvements in educational attainment. Indeed, in 2010, for the first time in the state’s history, more of California’s college graduates were born in the state (37%) than in other states (33%) or internationally (30%). Going forward, California’s best approach to closing its skills gap will be to concentrate on improving the educational attainment of its residents.

Policy Implications

We believe that the most promising approach to closing the workforce skills gap is to concentrate on improving the educational attainment of California residents. Here, I will outline four key strategies for the state and its colleges and universities to pursue. Implementing these strategies—which should be the core of a new state plan for higher education—would require increased coordination across institutions.

First, increase access. Research shows that students are much more likely to earn a bachelor’s degree if they first enroll in a four-year college, rather than in a community college—even when we account for differences in academic preparation. This means that increasing the share of high school graduates eligible for the University of California and California State University would be an important step toward increasing the number of college graduates. It would also improve access for students from low-income families and other underrepresented groups.

Second, improve completion rates and time to degree. Despite progress by both university systems to address these issues, only 19 percent of students at CSU and 60 percent of those at UC earn a bachelor’s degree in four years. Current strategies to graduate more students more quickly should be assessed to identify which are most effective. And new approaches—such as offering colleges fiscal incentives to increase the share of students taking a full, 15-unit course load—should be considered.

Third, expand transfers to four-year colleges. Improving transfer pathways from community colleges to four-year institutions is essential because California relies heavily on its two-year institutions. Currently, the vast majority of community college students do not earn degrees or certificates. Associate degree programs guaranteeing that qualified community college students can transfer to CSU should be expanded. These programs now depend on individual agreements between specific campuses and apply only to specific majors; expanding them to include more majors and transfers to UC is likely to increase the number of students who ultimately earn bachelor’s degrees.

Finally, be smart about aid. Grant and aid programs mean that most low-income and even some middle-income students do not have to pay tuition at the state’s public colleges and universities. But other educational costs are not well covered and student debt has been rising, raising questions about whether state Cal Grants should cover more than tuition. The state should also consider increasing the size of Cal Grants to students attending private colleges that have good graduation rates and low loan-default rates.

In summary, a state plan for higher education should ensure that enough high school graduates are ready for college, enough slots are available for new college students, more community college students are able to transfer to four-year institutions, and more students complete college in four years. Of critical importance, California and its higher education institutions must strengthen access to and success in college for low-income and underrepresented students, who make up an increasing share of the state’s population. Ultimately, closing the workforce skills gap will result in a more productive economy, higher incomes, greater tax revenues, less pressure on the social safety net—and a brighter future all Californians.

Video: A Conversation with Legislative Leadership

At a PPIC event last week, Kevin de León, senate leader pro tem, and Chad Mayes, the Assembly Republican leader, were asked to name the top three issues the legislature should work on with the governor. Though the leaders come from different sides of the aisle, the list of issues they named before a large Sacramento audience had a lot in common. De León’s priorities began with income inequality between the coastal and inland regions, a “tale of two states.” He also listed water and making targeted investments, particularly in higher education. He went on to list a fourth issue: climate change.

Mayes named water and a lack of water infrastructure, and the many Californians left behind in the state’s economic recovery. His third issue was transportation, the focus of an ongoing special legislative session.

“Everywhere that I go in California,” he said, “I’m stuck in traffic. So we know there’s a problem.”

The leaders’ top issues dovetail with findings from the latest PPIC Statewide Survey in which Californians identify water and the economy as the most important issues for the legislature and governor to work on in 2016. 

Though De León and Mayes named similar priorities, there was much less agreement on solutions. But the two maintained a collaborative tone throughout their conversation, denounced what Mayes termed “demagoguery on the national stage,” and repeated their commitment to working together productively.

De León said the legislature can avoid being mired in bitter national political debates if leaders continue to work cooperatively to “get some real tangible victories for Californians.”

“We’re doing things very differently in the state of California,” he said.

Interpreting California’s Latest SAT Scores

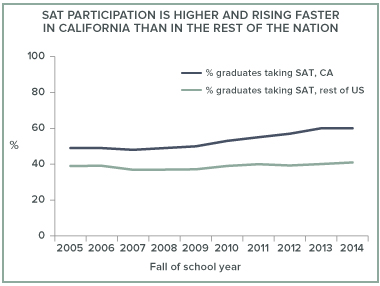
An increasing share of California students are taking the SAT. This is good news for California, suggesting that more and more students are preparing for college. Sixty percent of the high school graduating class of 2015 took the SAT, a much higher share than in the rest of the United States (41%). Moreover, SAT participation has been growing faster in California than in the rest of the nation.

Even though raw scores have declined, once we adjust for the increased share of graduates taking the SAT, the latest scores represent an improvement from a decade ago. On average, California’s graduating class of 2015 scored 1,492 out of 2,400 points on the SAT college admission tests—28 points lower than a decade ago, and 2 points higher than the national average. However, once we factor in the increase in participation over the past decade, California’s 2015 score actually represents an improvement compared to a decade earlier. As participation in the SAT increases, the mix of students taking the exam shifts towards those less academically prepared. In states with high average SAT scores, participation rates are very low, because the only students who participate tend to be very well prepared. On average, a 1 percentage point increase in participation is associated with a 3.4 point decrease in average performance. Given the 11 percentage point increase in participation among California high school seniors over the past decade, we would expect the state’s average SAT score to drop 10 points more than it did.

Latino students have experienced the largest increase in SAT participation. Over time, SAT participation has increased steadily among all major racial/ethnic groups—including Asian, white, Latino, and African American students. But the largest gain has been among Latino students. For instance, in the 2013–14 school year, 43 percent of Latino graduates took the SAT, up from 35 percent in 2005–06. (Graduation data for 2014–15 has not yet been released.)

Race/ethnicity-related performance gaps are changing. Asian students outperformed white students in the 2014–15 school year by 11 points, reversing a trend in which whites were the higher scorers. The gap between African Americans and whites has narrowed over time. In the 2014–15 school year, white students scored 295 points higher, on average, than African American students and the score gap has decreased from 317 points in the 2005–06 school year. However, the Latino-white gap has increased slightly—not very surprising given the huge increase in Latino students’ participation in the SAT.

Parental education level, family income matters more now. Parental education and family income are closely related to SAT performance. In 2014–15, students whose parents have bachelor’s degrees scored, on average, 1,601 points—200 points higher than students whose parents have only a high school diploma. Over time this gap has widened, mostly because students whose parents have graduate degrees are scoring higher on the SAT. There is also a widening performance gap connected to gaps in family income, particularly at the upper end of income distribution. For instance, the performance gap between students whose families make more than $200,000 (roughly the top 10 percentile) and those from families earning $60,000 to $80,000 (roughly the median household income) widened from 172 points in 2007 to 251 points in 2014.

The increase in SAT participation, especially among groups that are underrepresented in higher education, is good news for California. At the same time, the continuing gaps in performance represent an ongoing challenge that must be addressed, especially given California’s changing demographics.

Chart source: (TOP) National Center for Education Statistics, College Board, 2005–14. Chart notes: (TOP) Participation rate is based on the projection of high school graduates by the Western Interstate Commission for Higher Education (WICHE), and the number of seniors who took the SAT in each state. Participation varies widely across states and can be partially explained by state policies. For instance, all public high school juniors in Maine have been required to take the SAT since 2006. Similarly, since 2011, Delaware has made the SAT available to all public high school juniors. And, starting with the class of 2014, all juniors in District of Columbia public schools take the SAT.
Chart source: (MIDDLE) College Board, 2014–15.
Chart source: (BOTTOM) College Board, 2014–15. Chart note: (BOTTOM) Orange vertical line indicates the College Board’s College and Career Ready (CCR) benchmark.

How the New FAFSA Can Help Californians

Last month the Obama administration unveiled a revamped Free Application for Federal Financial Student Aid (FAFSA). The new FAFSA is available in October rather than January, so high school seniors won’t have to wait until their spring semester to apply for aid. This means that students can factor their federal grant and loan eligibility into their college application process, instead of getting information about aid after they apply or even after they are admitted. The FAFSA will also be easier to fill out. In the past, students had to wait until their parents filed taxes in January (or later) and then fill out the FAFSA, but the updated form allows families to electronically transfer their tax data from the previous year’s IRS returns, which means that many income-related questions can be filled in automatically. This will drastically reduce the amount of time it takes to fill out the FAFSA.

These changes can benefit Californians in multiple ways. A streamlined FAFSA that families can fill out earlier may induce more students to complete the application, which is likely to lead to an increase in Pell Grants. According to nationwide estimates, 6 to 10 percent of college students from families with incomes under $48,000 fail to fill out the FAFSA; this suggests that many students in California and elsewhere are currently missing out on Pell Grants.

For Californians, the FAFSA is not just a federal aid application; it is also a prerequisite for participating in many state and institutional aid programs for students from low-income families. Cal Grants, the largest source of state aid, can cover up to the full tuition at a UC or CSU for students who qualify. UC’s Blue and Gold Opportunity Program combines federal, state, and local aid to ensure that students from families making less than $80,000 per year do not pay any tuition. But students who do not fill out the FAFSA are not eligible for any of these programs. National data show that about 20 percent of families who make from $48,000 to $75,000 do not fill out the form and therefore are potentially paying more than necessary for college.

Increased FAFSA completion rates may also benefit students from higher-income families. As PPIC has noted, the increases in tuition between 2007 and 2011 primarily raised the cost of attending a UC or CSU for many students from middle- and upper-income families. Filling out the FAFSA can help these students qualify for California’s Middle Class Scholarship, which covers a portion of the tuition and fees at UC and CSU for students with family incomes of up to $150,000 per year. In addition, FAFSA completion can help students qualify for federal loans and decrease their reliance on private loans, which can be more expensive and potentially riskier than federal loans.

Lastly, students who get financial aid—and who find out about it earlier in the application process—are better able to assess their college options. For instance, a student who knows that financial aid is available might apply to a four-year university instead of a two-year college. While the four-year school may be more expensive, research suggests that students who begin at a four-year institution are more likely to get a bachelor’s degree than if they begin at a community college with the intention to transfer to a four-year school. In other words, making the FAFSA process easier may not only help students afford college and take on less debt; it may also lead to higher baccalaureate degree completion rates.

Video: Higher Education & Our Economic Future

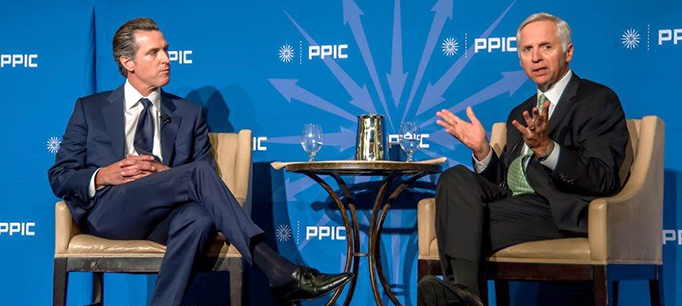
“The world is radically changed,” Gavin Newsom, California’s lieutenant governor, told a Sacramento audience this week.

“We’re competing against billions and billions of people, not just competing against cheap labor now, but against cheap genius,” he continued.

Newsom—who is also a University of California regent and California State University trustee—spoke in a conversation with Mark Baldassare, PPIC president and CEO. PPIC’s new report Will California Run Out of College Graduates? provided the context for the discussion. The report concludes that California will fall 1.1 million college graduates short of economic demand by 2030, if current trends persist.

Newsom said that “there is not a major industrialized nation in the world that is not focusing with intention on radically transforming their education system. One of the remarkable things about California is that we do not have a plan.”

He summed up: “We need goals. And we need to be able to measure those goals. And those goals must emanate from the state itself.”

Newsom was not the only speaker at the PPIC event to use words like “radical” and “revolution” to describe changes needed in higher education.

At a subsequent panel discussion, state assemblymember Catharine Baker said she is concerned that the state is falling short of the workforce needed even now. She noted that there is bipartisan agreement in the legislature that higher education is important but not about the need for major change. “There is a lot more focus on issues around the margins, that is, on how many students are we admitting, what few changes we can make in the community college system.”

Eloy Ortiz Oakley, superintendent-president of the Long Beach Community College District, said, “We almost need a revolution in our system. We started to get there when we were in crisis mode.”

“During the recession, we saw more creativity than ever before in the community college system and we began to focus,” he said. “I fear that post-recession that focus will start to dissipate.”

Hans Johnson, coauthor of the PPIC report and PPIC senior fellow, said the big challenge for the state is replacing the retiring baby boom generation with young, well-educated workers.

“I think there is a very clear path to closing that skills gap,” he said. “We need to have more students going to colleges—especially four-year colleges. We need improve completion rates—that opens up room for more students. We need to improve transfer rates from community colleges to the four-year colleges. And if we do all of those things—and these are all decisions we can make, as policymakers and higher education officials—we can actually close that skills gap.”

Timothy White, California State University chancellor, said CSU can do its part to fill the workforce skills gap—with the help of its educational and funding partners. He called the PPIC report “a very sobering clarion call that is of crisis proportion— not for the CSU or for the University of California, or the community colleges, but rather for California. And I hope we take it with the seriousness that it deserves.”

What the New College Scorecard Can—and Can’t—Tell You

Last month, as high school seniors were beginning to apply for college, the US Department of Education released its yearly scorecard to help students and their parents make informed choices. In addition to information on graduation rates, access, net price, this year’s scorecard includes earnings data for former students. The earnings profiles will be especially helpful—until now, students, parents, and the public lacked access to official information about earnings nationwide. They may also help hold colleges accountable for student outcomes.

The new earnings data is exciting—but not perfect—so it is important to determine what it actually tells us. The US Department of Education—which administers financial aid, mostly in the form of Pell Grants and federal student loans—generates the earnings profiles by linking its data on college students who get federal aid with earnings data from the US Department of the Treasury. This covers about 70 percent of students nationwide. Of course, the shares of students receiving federal aid vary across colleges—at some postsecondary institutions, fewer than half receive it. But the scorecard’s explanation of its methodology suggests that, aside from family income, college students who receive federal aid are similar to those who do not.

Another caveat is that the earnings measure for each institution represents all students receiving federal aid who started there—including those who didn’t graduate and those who transferred to other schools or pursued post-graduate degrees.

Still, it is instructive to compare the earnings of former students across institutional sectors. The table shows what you would see if you looked up earnings profiles for different types of California colleges. We chose colleges with median earnings that were closest to the median of each sector.

The median student who started at UC Davis earns about $8,000 more than a student from Azusa Pacific University, about $10,000 more than a student from Sacramento State. The differences among the sectors align with what we know from prior research: earnings of former students of colleges that grant bachelor’s degrees are, on average, higher than those of former students of colleges that grant only associate degrees or certificates. Moreover, research has found that students at private for-profit institutions end up with lower earnings than those of comparable students from public or private non-profit four-year universities.

What the scorecards don’t show is that the difference between colleges is far smaller than the difference within colleges. The figure shows the variation in earnings at the same campuses included in the table above. First, note the tremendous overlap: many students who start at community college end up earning more than some students who started at UC and CSU. The difference in median earnings between the typical CSU and the typical UC is approximately $10,000. But the difference between the 25th percentiles and the 75th percentile of UC Davis student earnings is almost $50,000.

Looking at these differences alone is not enough to judge the quality of an institution. The differences that we observe across colleges might reflect differences in the type of students who enroll in different institutions, or variations in completion rates. They may also have to do with differences in the fields of study that attract large numbers of students. For example, some colleges have high concentrations of students enrolled in STEM (science, technology, engineering, and math) fields—these students traditionally go into higher-paying jobs. Other colleges may have a high concentration in less remunerative majors. Similarly, the dispersion that we observe in student earnings within institutions is likely tied to a number of factors, including fields of study and rates of completion.

PPIC research has found that a worker’s wages vary tremendously depending on his or her college major. At the high end, those with engineering degrees earn a median annual wage of $96,000. At the low end, those with degrees in education administration and teaching have a median annual wage of $57,000. The Department of Education plans to include earnings by area of study in future versions of the scorecard, and we think this will make the scorecards much more valuable to students and families.

Californians will find the federal scorecard particularly useful, since the state currently lacks a student tracking system. Many other states have maintained more robust and inclusive student tracking systems for years. These systems allow calculation of more precise earnings information by major and degree for all graduates in a state—and some states are collaborating to track outcomes and earnings of former students who move from one state to another.

In California, only the community college system provides salary information for its graduates. At a time when state and national leaders are urging that colleges and universities be held accountable, the state’s parents, students, and taxpayers would benefit from more and better information about student outcomes.

College Readiness and the New State Exams

Last week, California released the results of the new statewide tests aligned with the Common Core State Standards for students in grades 3-8 and grade 11. The 11th-grade test—from the Smarter Balanced Assessment Consortium (SBAC)—is designed to measure whether students are on track to be ready for college and careers after graduation. In fact, the CSU and community colleges can use scores from the test to determine if students are ready for college level courses. The results show that about half of 11th-grade students are at least conditionally ready for college level courses in English and less than a third are ready for college level math courses.

The fact that most 11th-grade students are not yet ready for college is not necessarily news for California. Since 2004, California students have been able to participate in California’s Early Assessment Program (EAP), which used an optional statewide test to determine college readiness levels of 11th-grade students. The college readiness identification component of the new tests is based on the EAP and informs 11th grade students whether they are ready, conditionally ready, or not ready for college.

We cannot directly compare the test results to see if students have improved, as the EAP was optional for all students and the math section was only offered to students in advanced math courses, meaning a large portion of students were untested by the EAP. But the two tests are similar in that they show that a majority of high school juniors are likely not ready for college in both English and math. The new test data does show that a large majority of students are now tested in English and math, meaning more students now know whether they are ready for college level work.

But there is also some good news here for California. For students, new ratings regarding college readiness come early enough for the information to help before they enroll in their 12th-grade classes. Prior research on the EAP suggests that the optional testing helped lower the likelihood that a student would need remediation. Now, because the SBAC test is mandatory, almost all students in California will know whether they are ready for college or need to make improvements during their senior year.

This year, over 90,000 more students than last year were given a rating of “conditionally ready” in English. This will give them an opportunity to avoid remediation in college, by taking a prescribed 12th-grade English class and receiving at least a C grade.

And while it might seem that informing almost 200,000 more math students that they are not ready for college would be discouraging, prior research on the EAP suggests that a “not-ready” rating did not discourage students from enrolling at a CSU. Finally, the SBAC can serve as one of multiple ways for students to demonstrate college readiness. Research suggests that using multiple measures—rather than relying solely on a placement exam—can keep students from being misdirected into remediation.

For the state, the new test provides a benchmark by which to measure future progress and a way to compare across states. Of the eight states that have released test scores, California is 4th and 5th in the proportion of students who are at least conditionally ready for English and math, respectively. As more states release their scores, California will have a clearer picture of how well it is preparing high school students for college on a national scale.

Chart notes: Data from the EAP and CDE websites. The number of students in each category of the SBAC are estimated from the total numbers tested and the percentages given by CDE.

Expanding Education, Reducing Recidivism

This month, the Obama administration unveiled a pilot program to allow access to Pell Grants to those incarcerated in state or federal prison. In addition to expanding access to higher education, this program presents a new opportunity to leverage federal dollars to improve public safety and generate savings in the form of reduced correctional costs.

The federal program complements a bill passed last fall by the California Legislature aimed at increasing educational programming to prison inmates. Authored by State Senator Loni Hancock (D-Berkeley), SB 1391 allocates $2 million to create and fund higher education programs for inmates in four pilot sites, under the leadership of the California Community Colleges Chancellor’s Office and the California Department of Corrections and Rehabilitation (CDCR).

These federal and state policy initiatives come in response to mounting evidence that education—particularly at the post-secondary level—reduces recidivism and related correctional costs. Inmates who participated in education programs had 43% lower odds of reoffending after being released into the community, according to a 2013 RAND report funded by the U.S. Department of Justice. This reduction in recidivism translates to $5 in direct correctional cost savings for every $1 spent on educational programming. Efforts to take advantage of these potential returns are in line with other recent initiatives, such as California’s public safety realignment, that emphasize the use of evidence-based practices to address the state’s historically high rates of recidivism.

However, past efforts to provide educational services to inmates in California—and elsewhere—have not always been successful. Numerous studies have documented the growth of private companies that have profited from providing a range of correctional services—including secondary education, GED classes, and vocational training—with little oversight or evaluation to ensure that public money is well spent. As the federal government makes additional funds available for higher education in prison, some of these service providers will likely seek to expand into post-secondary programming. At the same time, new players, both public and private, attracted by a promising new revenue stream may well enter the field. This means it is critical to ensure that the institutions receiving Pell Grants for inmate education have sufficient and appropriate training, staff, and capacity to offer high-quality college classes and student support services. A 2015 report from UC Berkeley’s Warren Institute and Stanford’s Criminal Justice Center outlines key recommendations for improving and ensuring the quality of inmate education programs, including an emphasis on face-to-face instruction inside prison and transitional programs on the outside for students.

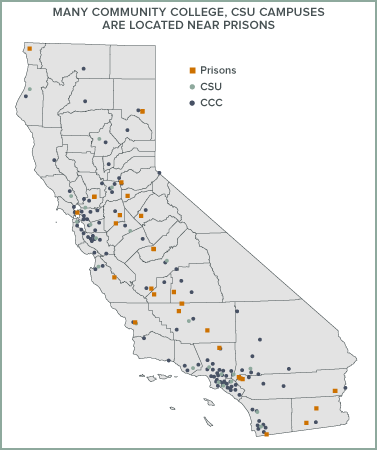
Given their experience in providing a range of educational services, the California Community College (CCC) and California State University (CSU) systems stand out as promising candidates to lead efforts to increase post-secondary education among inmates. The map below shows the close proximity of these educational institutions to prisons across the state.

California currently supports community college education for all low-income students, including inmates, through fee waivers. However, these waivers are not available for students who wish to pursue four-year degrees. These students rely on other forms of aid, including federal Pell Grants. The Pell Grant pilot program presents an opportunity for CSU to begin working with CDCR to leverage federal dollars to expand access to high-quality, onsite higher education for inmates in state prison.

The security and operational constraints of correctional facilities pose unique challenges to service providers. It is likely that even organizations with experience providing quality education programs, such as well-performing state universities and community colleges, may find that they have a steep learning curve when it comes to operating within a prison. Careful planning, detailed oversight, and rigorous evaluation therefore will be critical to ensuring that SB 1391 and the Pell Grant pilot achieve their goals.

Chart Source: California Post-Secondary Education Commission and California Department of Corrections and Rehabilitation.