Uncertain Future for Cap-and-Trade

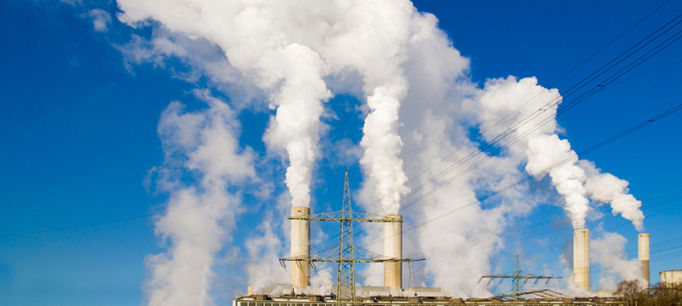
To date, California’s actions to combat climate change have been funded mostly through its cap-and-trade program, which allows the state to collect funds from greenhouse gas emitting sources. California was the first state to institute a cap-and-trade program. To date it has collected more than $4 billion in auctions of permits to companies and significantly reduced greenhouse gas emissions through the program. But the state program has been challenged in the courts, and its statutory authority is set to expire in 2020. At least in part due to the program’s uncertain future, there has been a drastically reduced collection of revenues this year.

The program is an interesting blend of regulation and free-market practices. The Air Resources Board—the agency in charge of the program—sets a cap on state’s greenhouse gas emissions and allocates emission permits for each company that releases them. Usually the permitted amount of emissions is lower than the company’s current level of emissions. To make up the difference, companies have the option to buy more permits from the state or from other companies that can reduce their emissions at lower cost. These permits, both private and public, are auctioned quarterly in a public online market. This market-based mechanism enables the state to promote technological innovation and brings flexibility to the effort to reduce emissions.

The funds collected also serve to pay for mitigation and adaptation programs. Under the current law, 60 percent of cap-and-trade proceeds are continuously appropriated to public transit, affordable housing, sustainable communities, and high-speed rail. The remaining funds are appropriated on a one-time basis each year to programs for disadvantaged communities, clean transportation and the environment. As of this September nearly $2.3 billion had been appropriated, including more than $700 million for high speed rail, almost $500 million for affordable housing and sustainable communities programs, $325 million for low carbon transportation, more than $200 million for transit programs, and the remaining for a variety of other programs including energy efficiency, agriculture, forests, and other environmental programs.

This year’s one-time investment will go to support programs that reduce greenhouse gases while benefiting disadvantaged communities, support clean transportation, and help protect ecosystems. The legislature and governor were unable to come to an agreement to spend all of the discretionary funding, and reserved an additional $462 million for future appropriations. This decision may have been motivated by uncertainties surrounding the future of the cap-and-trade program.

Virtually all allowances that were offered for sale in cap-and-trade auctions in 2015 by the Air Resources Board were sold. However, that has not been the case in 2016. The February 2016 auction saw a small amount of allowances go unsold. In the May and August 2016 auctions, the Air Resources Board sold less than 2 percent of the allowances offered. As a result, the May 2016 auction brought in only $10 million, and the August auction brought in $8 million—compared to $517 million from the February auction.

If the state does not address these uncertainties, revenues may continue to be small, forcing the state to cut spending on programs funded by cap-and-trade or look for other ways to meet its ambitious actions to address climate change.

California’s Snow Drought

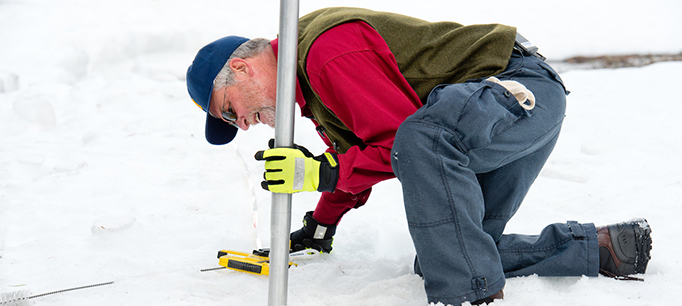
Snow—or the lack of it—has been making headlines lately. California has had unusually low snowpack for the past several years, and the winter of 2015 was the all-time lowest snowpack in recorded history. Low snowpack brought major challenges to water managers.

Snow plays a disproportionately large role in water and environmental management in California. About a third of our average annual water supply starts out as snow. It flows into our major reservoirs in spring and early summer, when water demand on farms starts to ramp up.

“Snow droughts” typically coincide with reduced overall precipitation. This is always associated with a reduced number of large storms during winter (California relies on a handful of large storms every year to supply most of its water.) Snow droughts are also associated with unusually warm conditions.

Temperature affects snowpack in several ways. During warm winters, rain turns to snow at higher elevations than in colder years. This means that a smaller area is covered by snow, and there is less snowpack. Snow—like water—can also evaporate when conditions are warm. This process, known as sublimation, can dramatically reduce the snowpack. Finally, warm conditions cause early melting of the snowpack. The thinner the snowpack and the warmer the conditions, the sooner it will melt. In an average year, California’s snowpack starts to melt around April 1. During warm drought years, it can melt as much as a month or more earlier.

A good snowpack helps bolster our reservoirs precisely when the demand for water—principally for irrigation for farms—is highest. Many reservoirs are required to maintain space for capturing winter floods to protect downstream users. The spring snowmelt is critical for refilling these reservoirs to meet water supply needs. Snow droughts add special challenges to water management because changes in the timing and volume of runoff can have a big impact on reservoirs.

Environmental management is also complicated by snow droughts. State and federal laws require that many reservoir operators release cold water to support downstream habitat for steelhead and salmon. During the warm days of summer, managers tap into the pool of cold water that accumulates at the bottom of a reservoir (cold water is denser, so it sinks). Snowmelt runoff lowers the temperature and increases the volume of a reservoir’s cold water pool. This gives greater flexibility to managers for meeting both water supply and habitat needs, which are often in competition.

Snowpack is also the source of most of the state’s hydropower generation. A small or early snowmelt can cause significant reductions in hydropower, forcing utilities to make up the difference with other sources (most typically, fossil fuels).

Finally, snow droughts may be increasing in frequency and intensity. Recent studies throughout the West are showing that temperature—rather than reductions in precipitation—may have the most significant influence on drought conditions. And most climate projections suggest that this trend will likely worsen over the course of this century. The 2012–15 snow drought—along with all its water management challenges—may become much more common in the future.

There are no simple solutions to the loss of snowpack. To adapt, California will have to shift from its historic reliance on snowpack for storing water. This will require more flexible operation of our surface reservoirs to accommodate changes in timing and volume of snowmelt runoff. We’ll have to shift more water into aquifers to support flexible operation of dams, particularly those that need to make space to capture winter floods. And environmental managers will have to find innovative ways to conserve cold water to sustain salmon and steelhead populations, especially as the climate warms.

All of these adaptations are doable and need not represent major increases in costs or disruptions to water supplies. But we’ll need new policies, changes in the traditional ways we manage water, and a willingness to act to address the snow drought challenge.


Learn more

Read California’s Water: Climate Change and Water (from the California’s Water briefing kit, October 2016)
Watch “California’s Water Challenges: Water Supply”
Visit the PPIC Water Policy Center drought resource page

The Top-Two System and Election 2016

This election marked the third outing for the state’s “top two” primary system. The system allows voters to choose any candidate they like in the primary, with the top two vote getters advancing to the fall. One of the reform’s major goals is to promote moderation by removing the partisan barriers that structure candidate and voter choices. What has this election suggested about the reform?

The two candidates who advance to the fall election can be—and often are—from the same party. The most visible example this year was the US Senate race between Democrats Kamala Harris and Loretta Sanchez. It was the first statewide same-party race, and many did not know what to expect. Of the two candidates, Kamala Harris was seen as a traditional liberal Democrat, while Loretta Sanchez made more efforts to appeal to Republicans. In the end, Kamala Harris won by a wide margin—mirroring the substantial margins in most public opinion polls. Polling had also suggested that between a third and half of Republicans were likely to opt out of casting a ballot in this race. At the time of this writing, about 1.1 million more ballots have been cast for president than for US Senate, a number roughly consistent with these polling estimates.

There were also 27 down-ballot same-party races in this cycle, in line with 25 in 2014 and 28 in 2012. These races continue to be a lot closer than cross-party contests: this year, an average of 32 points separated the candidates in cross-party races, compared to 25 points for candidates of the same party. About a quarter of this year’s same-party races were decided by less than 10 points, also similar to previous years.

At the same time, the share of cross-party races decided by narrow margins has been falling over time—from 18% in 2012 to 15% in 2014 to just 11% this year—and is rapidly approaching the average share during the previous redistricting cycle (7%). This most likely reflects the aging of the redistricting plan, which was drawn by an independent commission in 2011. At the beginning the plan was very disruptive to established patterns, but as candidates have come to understand which seats are likely to be competitive and which are a stretch, the level of cross-party competition overall has declined.

Establishment candidates did well this year, as they have on average under the top-two reform. Just 6 out of 123 incumbents lost, and the average margin of victory for incumbents was the same as before the reform. This is not to say that the top-two primary has not altered the playing field in some cases. In fact, three of the six losing incumbents ran in same-party races. But the broader field of play is similar to the past.

Same-party races were in part expected to promote contests between the moderate and liberal/conservative wings of each party. It is not clear that this has happened much on the Republican side, but there are typically several same-party contests that feature this dynamic on the Democratic side. In this election cycle, most of these contests were won by the more moderate, business-backed Democrat. Nonetheless, in at least two cases—Raul Bocanegra vs. Patty Lopez in Assembly District 39 (San Fernando Valley) and Eloise Reyes vs. Cheryl Brown in Assembly District 47 (San Bernardino County)—a less traditional Democratic incumbent lost to a more traditional Democratic challenger (Bocanegra was technically a challenger, but he was also a former incumbent).

In short, this year’s top-two outcomes mostly fit the post-reform pattern, but there were some interesting deviations. It is still early in this reform’s life, so it will be important to keep monitoring it to understand how it unfolds.

Next Steps for Proposition 57

The passage of Proposition 57 brings significant changes to California’s criminal justice system. At the same time, the initiative lacks specificity and there is great uncertainty about what its impact might be.

The measure increases the chances for parole of felons in state prison who are convicted of nonviolent crimes and expand inmates’ opportunities to earn credits for good behavior. This loosening of parole rules will ease prison overcrowding through the early release of thousands of inmates. Less controversially, it will also allow judges, rather than prosecutors, to decide if juvenile defendants over age 14 can be tried in adult court.

Proposition 57’s impact will depend on which inmates will be eligible for parole, how early they are released, and the effectiveness of the new credits—which will depend, in part, on whether the California Department of Corrections and Rehabilitation (CDCR) has the capacity to immediately provide effective rehabilitative programs.

The initiative is the latest of a number of reforms adopted since 2009, when a federal court issued a mandate to reduce overcrowding in the state’s prison system to improve inmate health care. Over the past several years, the total prison population has declined by about 41,000. At 113,700, the institutional population is now almost 2,200 below the court-mandated target of 137.5% of design capacity. Early in 2016, however, the prison population began to increase, and is now about 1,900 higher than it was at the end of January. If this average monthly increase of more than 200 inmates continues, the prison population could be above the mandated target within a year.

Proposition 57 gives CDCR two tools to address this population pressure. First, it makes prison inmates serving time for “non-violent” felonies eligible for parole consideration after serving the full sentence for their primary offenses, without having to serve time for additional crimes or enhancements, such as gang affiliation or prior felonies. But it is not clear which specific crimes will make inmates ineligible for early parole. The list of 23 violent felonies in the state penal code does not include crimes such as assault with a deadly weapon, certain rapes, and some gang crimes.

If eligibility is extended to those who have not been convicted of these 23 violent offenses, the Legislative Analyst Office (LAO) estimates that about 30,000 inmates currently in state prison would be eligible for early parole, as would an additional 7,500 inmates admitted in each year thereafter. However, the number of inmates who will be granted early release will almost certainly be lower than 30,000. The CDCR has the discretion to determine eligibility, and eligible inmates will be granted parole based on their assessed risk to public safety by the Board of Parole Hearings (BPH). There were 5,300 parole suitability hearings in 2015, and BPH granted parole to only 906 inmates, a rate of about 17%.

Second, and importantly, the initiative gives CDCR authority to award credits for good behavior and rehabilitative or educational achievements. In addition to reducing the prison population, the incentive of early release based on completion of programs aimed at reducing the likelihood of reoffending is also likely to increase inmate demand for approved rehabilitative or educational programming.

The proposition’s advocates hope that more effective programming combined with incentives to participate will better prepare inmates for reentry into the community. They also hope it will lower the state’s high recidivism rates—we recently reported that about two-thirds of inmates released from prison are rearrested within two years and about two-fifths are re-convicted of a new crime.

It will be up to the CDCR secretary to determine which programs are credit-eligible and the size of the credit inmates would receive for participating. It is unclear whether CDCR will have the capacity to meet new demand for these programs—this will be crucial to implementing Proposition 57.

A key question to be answered in the years to come is whether Proposition 57 will affect crime rates. To answer it, we need to know how many inmates are released early, who they are, and to what extent they complete effective programming.

For all of the unknowns, one aspect of Proposition 57 is clear: it does push the state to focus on evaluating, implementing, and meeting the demand for evidence-based programs that help inmates prepare for successful reentry into the community.

Women in Jail

Women are the fastest growing segment of America’s jail population, yet the characteristics of female inmates are not well documented. Nationally, their numbers have increased 14-fold from 1970 to 2014. In California, the women’s jail population has risen 6-fold—from 1,725 in 1970 to 12,054 in 2014—twice as much as the male jail population over the same period.

PPIC’s work on jail populations shows that female jail inmates differ in lots of ways from their male counterparts, most notably in the types of offenses they are held on. This work is based on detailed records provided by 11 counties—which contain two-thirds of the state’s jail population—as part of a long term project PPIC has undertaken in collaboration with the California Board of State and Community Corrections to improve outcomes for correctional populations in California.

In the participating counties, women are more likely than men to be booked into jail for misdemeanors (54% of women to 48% of men). They are also more likely than men to be booked for property and drug offenses (46% to 36%). Women also serve less time for drug, property and all other crimes at both misdemeanor and felony levels.

Because of the different offending patterns between men and women, California’s recent corrections reforms have affected them differently. Public safety realignment, which took effect in 2011, transferred authority for thousands of lower-level felons from the state prison system to county correctional systems. Today, many lower-level felons now serve their sentences in jail rather than prison. These offenders have committed crimes considered non-serious, non-violent, and non-sexual—the type women are more likely to commit.

Both male and female offenders charged with these crimes increased in the first three years after realignment. However, a higher proportion of women who would have been sent to state prison before realignment were held in jails after realignment. By September 2014, three years after realignment began, 37% of the female jail population and 30% of the male jail population were charged with lower-level felony offenses.

In 2014, Proposition 47 reclassified several property and drug crimes from felonies to misdemeanors. These offenses are also committed by a greater share of women than men. As with realignment, Proposition 47 had a greater impact on women than men, and women appear to have more greatly benefited. One year after the proposition passed, the percentage of women in custody for Proposition 47 offenses dropped from 32% to 16%. The percentage of men in custody for Proposition 47 offenses dropped from 22% to 12%. In other words, a greater proportion of Proposition 47 offenders were women, and the share of women in jail dropped by a greater percentage after the proposition. The racial and ethnic composition of female offenders did not change across the reforms.

More broadly, research suggests that the reasons for and consequences of female offending are different. Treatment and intervention that will be most effective for women—called “gender responsive” strategies—need to be at the forefront of policy discussions about how to manage female offenders. Moreover, because of the short time most women actually spend in custody, those strategies should not focus solely on jail, but must extend to women’s reentry into the community.

Acting Locally to Address Sea Level Rise


The author is a member of the PPIC Water Policy Center research network.

October brought a preview of some of the climate risks that coastal regions face. Hurricane Matthew wreaked havoc from Haiti to the eastern seaboard and the West Coast’s first “atmospheric river” storm brought flood warnings in some areas. The risk of coastal flooding is growing as a warming climate causes more intense precipitation and a gradual rise in sea level from Earth’s melting ice sheets. Both worsen the effect of high tides and large storms.

We have a few decades and perhaps up to a century to adjust to sea levels that are at least three feet higher than they are today. Coastal communities can expect a host of costly and dangerous problems from storms, including flooded wastewater treatment plants, shoreline erosion, industrial facilities spilling chemicals into waterways, and water supply systems inundated by seawater. The effects of floods are projected to be the most costly part of climate change. Some estimates put the global losses at $1 trillion a year by 2050, or roughly two percent of global GDP.

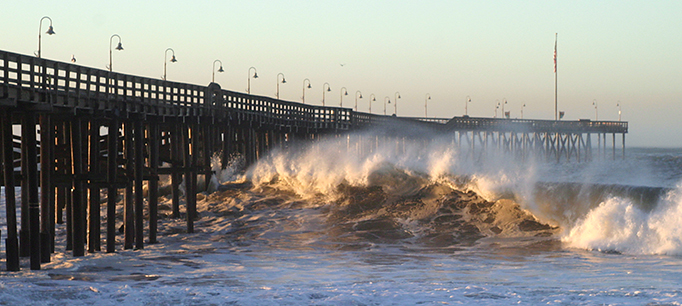
Although seas are rising relatively slowly, change will not be gradual at the community level. A series of strong winter storms that combine high tides, large waves, and intense rainfall can radically reshape a community in a matter of days.

For California to adapt, every coastal community will need a plan that envisions a future with higher sea levels and greater risk of coastal erosion and flooding. The plans will need to outline specific projects needed to weather changing conditions over coming decades. Communities will need to figure out how to raise roads, buildings, and critical infrastructure, and ways to enhance natural protective systems, such as beaches. Some combination of building codes and assistance programs is likely to be necessary. So far, most California communities are in the early stages of planning to adapt to rising seas.

Research shows that increasing awareness and knowledge of hazards is not enough to head off losses from disaster. A complicating factor in adaptation planning is how to make the scientific information actionable at the local level.

One new approach shows promise. A UC Irvine program called FloodRISE is bringing together experts in flood disasters, engineering, and the social sciences with local experts and community members in a number of Southern California communities and Tijuana, Mexico. As part of that program, we’re working with decision makers, community groups, NGOs, and personnel from key departments such as public works, city planning, emergency management, and environmental resources. The teams work together to create advanced visualizations of flooding. Using the latest climate science and data, local knowledge and flood modeling technology, they focus on addressing specific issues that communities care about the most.

How well we manage the problem of rising seas will to some degree depend on funding choices we make now. My FloodRISE collaborator Richard Matthew, a political scientist and disaster expert at UCI’s Blum Center for Poverty Alleviation, notes that funding for planning and preventing disaster risks is dwarfed by the resources that pour into communities after disaster strikes. In the chaos of emergency management, decisions must be made quickly and with very limited information, which too often leads to wasteful spending. Allocating more funds to climate-risk planning efforts would not only help local communities prepare for a rising sea and coastal flooding—it could help reduce wasteful spending later.

Learn more

Read California’s Water: Preparing for Floods (from California’s Water briefing kit, October 2016)
Read “Floods in California” (PPIC Water Policy Center fact sheet, February 2016)
Visit the PPIC Water Policy Center’s floods resource page

Testimony: California’s Future Need for Bachelor’s Degrees


Patrick Murphy, PPIC research director, testified before the Senate Budget Subcommittee Number 1 on Education at San Diego City College in San Diego today (November 1, 2016). Here are his prepared remarks.

The Public Policy Institute of California (PPIC) projects that between now and 2030 California will fall 1.1 million bachelor’s degrees short of workforce demand. Closing this gap will require substantial improvements in access to four-year colleges, transfer rates from community colleges, and completion rates among college students. This testimony describes specific targets for California’s public and private colleges and universities to help ensure that the state will have a sufficient number of highly educated workers in the future. It also briefly describes a recent pilot program in California that offers bachelor’s degrees at community colleges and similar efforts in other states in the context of closing the workforce skills gap.

PPIC senior fellow Hans Johnson, in testimony before the Assembly Budget Subcommittee Number 2, has offered a scenario for how the state might close the workforce skills gap relative to its current baseline. Assuming that college enrollment rates, completion rates, and transfer rates remain at current levels, the state will produce 3.1 million bachelor’s degrees over the next 15 years. Our closing-the-gap scenario charts a course to producing 4.2 million bachelor’s degrees by 2030—a 36% increase over the baseline for the entire projection period. It should be emphasized that this goal cannot be realized unless the state substantially improves the attainment of degrees by currently underrepresented groups, including first-generation college students, low-income students, Latinos, and African Americans.

There are two important issues to note regarding our closing-the-gap scenario. First, successfully reaching this goal requires contributions from all three of the state’s higher education systems as well as private colleges. Our scenario sets the following targets:

  • Access to four-year public institutions will increase, with eligibility increasing 5 percentage points over current levels at UC (the top 17.5% of high school graduates will be eligible for UC, up from the 12.5% set by California’s Master Plan for Higher Education) and 6.7 percentage points at CSU (the top 40% will be eligible for CSU, up from the top third). These new eligibility levels will be phased in over an eight-year period.
  • The number of transfer students from community colleges will grow incrementally to 35% above baseline levels over a five-year period.
  • Completion rates will increase 9 percentage points at UC and 17 percentage points at CSU. At UC, completion rates for students who enroll as freshmen will increase incrementally from 83% in 2016 to 92% by 2026. Completion rates for freshmen at CSU will increase incrementally from 57% in 2016 to 74% by 2030.
  • Private nonprofit colleges, which produce about one-third of all bachelor’s degrees annually, will keep pace with the relative rate of growth, increasing their production of degrees by 26% over baseline levels.

The second notable point is that there is no single solution to closing this gap. Our scenario represents only one path toward reaching the number of bachelor’s-degree holders the state needs. Based on the structure and performance of the current system, our scenario estimates the relative contribution that higher education segments could make in the future. Other combinations are conceivable. For example, a smaller expansion in eligibility and greater improvements in completion rates could also close the gap.

The assumptions underpinning our closing-the-gap scenario are clearly ambitious. Are the assumptions realistic? Is it possible to, for example, raise the completion rate at CSUs by 17 percentage points? Based on recent improvements, we think so. In another PPIC report, my colleagues Jacob Jackson and Kevin Cook observed that, from 2009 to 2015, the CSU system increased its six-year graduation rate 6 percentage points, from 51% to 57%. These increases came at a time when the system was focused on improving completion as part of its 2015 Graduation Initiative. This past September, Chancellor White announced that CSU seeks even greater improvements as part of its 2025 Graduation Initiative. The recently announced goals, including achieving a six-year graduation rate of 70% by 2025, are consistent with our closing-the-gap scenario.

We did not include in our scenario any assumptions regarding the potential for California’s community colleges to produce bachelor’s degrees. Beginning in 2015, the California Community Colleges Chancellor’s Office granted approval to 15 colleges to offer bachelor’s degrees in specific majors as a pilot program under Senate Bill 850. At this time, these programs are quite small and it is difficult to predict what impact they may have on the long-term production of bachelor’s degrees. A brief review of the experiences of two other states provides examples of different trajectories this pilot program could take.

Community colleges in Washington State began a pilot program offering applied bachelor’s degrees following legislation passed in 2005. The program, which focuses on fields currently not addressed by the state’s four-year public institutions, became part of the state’s regular programming in 2010. Community colleges currently offer bachelor’s degrees in 30 fields but produced only about 300 (less than 1%) of the more than 33,000 bachelor’s degrees conferred in the state in 2015.

In Florida, legislation authorizing community colleges to begin offering bachelor’s degrees passed in 2001. Florida has been quite aggressive in expanding the programs and schools offering bachelor’s degrees, with 24 of the state’s 28 colleges offering a total of 170 such programs. In 2015, these colleges produced 6,900 (about 7%) of the state’s 100,500 bachelor’s degrees.

As it is currently configured, California’s pilot program resembles the Washington approach. It has the potential to supply applied degrees in specific fields, making a contribution to the demand for skilled labor in some professions. But, due to its small scale, it is unlikely to have a significant impact on the overall workforce skills gap in the near term.

This is not to suggest that community colleges do not play a role in meeting the growing demand for bachelor’s degrees. In fact, about 103,000 community college students in California transfer to four-year institutions each year. Our closing-the-gap scenario assumes an increase in the number of transfers of 35% over five years—which would mean an additional 36,000 students moving on to four-year institutions. Should those students complete their bachelor’s degrees at rates similar to today’s transfer students, this would lead to tens of thousands of additional bachelor’s-degree holders by 2025.

Community colleges, UC, CSU, and private colleges must all play a role in the state’s efforts to meet the demands of a changing economy. Closing the workforce skills gap will lead to better economic outcomes for all Californians, increased state revenues, and reduced social service demands.