1 in 4 Child Care Workers in California Lives in Poverty

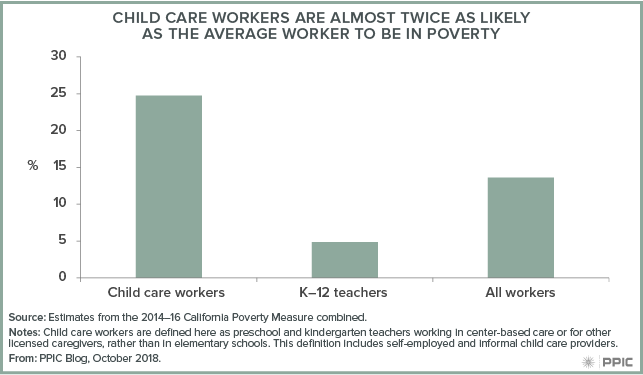
While preschools and child care providers in many parts of California are straining to fill a unmet need, the state’s child care workers are poorly paid and almost twice as likely to live in poverty than workers overall.

California’s child care workers earn significantly less than their school-based counterparts. Given that about 95% of child care workers not based in schools are women, and 53% are African American or Latina (compared with 43% of the overall workforce), women—particularly women of color—are most affected by low pay in the child care workforce.

UC Berkeley found that in 2017, the median hourly wage for child care workers in California was $12.29—just one-third the median wage for kindergarten teachers. Earnings among child care workers track more with low-wage workers across California (defined as those earning less than two-thirds of the median wage). These low wages translate to about a quarter of child care workers living in poverty as compared to 14% of all working adults (ages 18-64)—according to the California Poverty Measure, developed by PPIC and the Stanford Center on Poverty and Inequality.

Low wages are just one piece of the poverty puzzle. Relative to all working adults, child care workers are more likely to have only part-time work (more than a third, compared with less than a quarter of the overall workforce), which is associated with dramatically higher poverty rates than full-time employment. Many have completed some college credit or have an associate’s degree (44%), but just a fifth have a four-year degree, in a workforce where more than a third of working adults have four-year degrees. And while people working in child care are as likely to have children as the average working adult, those who do are more likely to be parenting alone (11%) than the average worker (6%).

The social safety net is an important part of helping child care workers make ends meet. Half of all child care workers benefit from at least one safety net program or tax credit, with the two largest being CalFresh (25%) and the federal Earned Income Tax Credit (37%). Without this assistance, poverty among child care workers would be even higher—2.5 points higher without the Earned Income Tax Credit, and 2.1 points without CalFresh. Minus all major safety net programs, one in three child care workers would live in poverty.

Recent policy changes could start to boost incomes for child care workers. Expanded eligibility for 18–24-year-olds for the state’s new Earned Income Tax Credit, starting in 2019, will specifically help the 20% of the workforce who are under 25. Steady increases in California’s minimum wage could improve earnings of child care workers employed by providers subject to minimum wage laws. Yet many workers are self-employed, providers often operate with limited incomes, and the cost of care itself is already high for low-income families. Minimum wage increases will likely result in a better-paid child care workforce only if they are accompanied by sector-wide changes aimed at making child care both affordable and accessible.

The needs of child care workers will affect efforts to improve and expand California’s complex child care system. While the state and federal governments have begun to increase access to child care with expanded programs and additional funding, improving living standards for child care workers will be a major challenge for California’s next governor.

The Connection between Groundwater and Surface Water

When the California Legislature created the “modern” water rights regulatory system more than a century ago, it focused exclusively on surface water, exempting groundwater from the permitting system. Yet in most watersheds, surface water and groundwater are closely linked. Actions that change one often have an impact on the other. The arbitrary legal divide has made it harder to manage the state’s water. But a recent law and a new court decision have done a better job of connecting surface water and groundwater.

When rain falls or snow melts in the foothills and mountains of California, water follows several pathways downhill and into rivers and streams. Some water moves across the land or through deep soils and weathered bedrock, arriving in rivers hours to weeks after rain or snowmelt. And some percolates deep into the ground, becoming groundwater.

As groundwater tables rise in winter and spring, they discharge water into rivers and streams, either directly through river beds and banks or indirectly through springs. This is why many of California’s rivers and streams flow long after the rain stops.

The exchange between surface water and groundwater continues when rivers emerge from mountains and flow across the state’s large valleys. Winter flooding, along with rainfall in the valleys, recharges groundwater during the winter. Some of that groundwater moves back into rivers and helps maintain flow in the dry season. Shallow groundwater also supports wetlands and riparian vegetation.

Groundwater pumping alters the exchange between surface water and groundwater. In many of the state’s large valleys, such as the Central Valley and valleys in the Central Coast and Southern California, streams and rivers that historically flowed all year are now intermittent due to lowered groundwater tables. In many cases, groundwater tables are so far below the surface that water only flows one way: from the river bed to the aquifer.

The arbitrary legal divide between surface water and groundwater has begun to change. A big step was the 2014 enactment of the Sustainable Groundwater Management Act (SGMA). SGMA requires water users in overdrafted groundwater basins to develop and implement groundwater sustainability plans to bring groundwater use and recharge into balance by 2040. SGMA mandates that these plans include measures to avoid undesirable effects from pumping, such as reduced stream flows and harm to groundwater-dependent ecosystems like wetlands. This is one of the few explicit legislative acknowledgements of the links between groundwater pumping and surface water flows.

Additionally, the California Court of Appeal recently added an important legal connection between groundwater pumping and surface water uses. In litigation to protect salmon and steelhead in the Scott River, the court ruled that the public trust doctrine―which protects the public’s right to use waterways for navigation, fishing, boating, natural habitat protection, and other activities―applies to groundwater pumping that adversely affects a navigable river or lake. The court also held that SGMA doesn’t override the public trust doctrine in groundwater cases.

These developments will have far-reaching implications for how California’s groundwater will be managed in the future. They also bring the law closer to hydrologic reality, which is likely to improve the effectiveness of both surface water and groundwater management.

A more extensive analysis of the Scott River decision by PPIC senior fellow Brian Gray was published on the California WaterBlog. Richard Frank, a UC Davis law professor and a member of the PPIC Water Policy Center’s research network, has also written a summary of the case.

Are K–12 Students Keeping Pace in Math?

The California Department of Education recently released 2018 SBAC test scores that showed very modest improvement. Since last year, the percent of students meeting or exceeding state standards grew 1.1 percentage points in math. But focusing only on these year-to-year comparisons means that we miss the longer-term picture. That is, we don’t see how the same group of students are progressing over time. When we look at SBAC math scores in this manner, we have some cause for concern—but there are bright spots, too.

In the figure below, we show the growth in math test scores from grade to grade—that is, we can see how last year’s third graders performed in fourth grade, and so on.  If growth is less than 100 percent, students aren’t keeping up with grade-level standards. If it is greater than 100 percent, student growth is outpacing what is expected by the standards. For instance, fourth grade students gained roughly 80 percent of the increase needed to keep pace with the proficiency standards.

Across all grades student scores grew, but only in grades 6 and 7 did the average student growth keep pace with the growth in standards. In all other grades students fell behind, with fewer keeping pace with the growth in grade-level standards. Perhaps more discouraging, the math scores of African American and Latino students grew less than the average student across all grades, meaning that racial and ethnic disparities are growing as students progress through school. These results suggest that growth among low-income students also lags the standards, since African American and Latino students account for more than 75 percent of economically disadvantaged students.

There is a silver lining in the 2018 growth numbers. Across most grades, growth in math was higher in 2018 than it was in 2017, meaning that fewer students are falling behind as they progress through school. This can be seen in the figure below, which shows how math score growth has changed between 2017 and 2018. Growth did slow for seventh graders, yet as the previous figure shows they still managed enough growth to outpace state standards, despite the slowdown.

Also encouraging: racial disparities in growth rates are smaller in 2018 than they were in 2017, as African American and Latino student improvement in math was greater than average student improvement across every grade. For instance, among African American fifth graders math scores improved about 11 percent more in 2018 than their counterparts’ improved in 2017. Thus, while achievement gaps still grow as students advance, gaps in growth are shrinking, and these disparities are growing more slowly than in years prior.

Standardized Testing and College Eligibility

In California and across the nation, there has been a growing focus on increasing college access by improving college readiness for high school students and encouraging more eligible students to attend college. To this end, many states and educational institutions have changed how they use college entrance exams like the SAT and ACT.

One approach has been to have more students take the SAT or ACT in hopes of identifying those who are eligible for college but might not have taken a college entrance exam on their own. As of 2016–17, 25 states use the SAT or ACT as their standardized test for 11th graders.

Assemblymember O’Donnell (D-Long Beach) has proposed AB 1951, which would give districts the option to use the SAT or ACT in place of California’s 11th-grade standardized test. Though Governor Brown vetoed the bill at the end of the 2017–18 legislative session, O’Donnell promised to bring it back in the next session, when California has a new governor.

But even as many states are administering the SAT or ACT to all students, a growing number of colleges and universities are dropping these tests as an entrance requirement. Citing concerns about biases in the exams, as well as the extra financial or time constraints for students, liberal arts colleges like Mills College in California and prominent universities such as the University of Chicago have made submitting test scores optional. Currently, California State University (CSU) does not require students to submit an SAT score (though most still do) if they meet the high school GPA threshold of 3.0 or higher. Despite this trend, most four-year colleges continue to use college entrance exams in their admissions decisions and a growing share of high school graduates take either the SAT or ACT.

In his veto message, the governor suggested another possible way to expand eligibility. California universities could consider using the state’s standardized test (SBAC) as an eligibility measure. All California 11th graders in public schools take the SBAC, which is aligned with the Common Core State Standards and is already used as an early diagnostic of college readiness at CSU and many community colleges. New evidence suggests that the SBAC does as well as the SAT in predicting first-year performance at California’s public universities.

Any of these strategies could increase the number of students eligible for California’s universities—but not all of them would work well together. For example, the University of California and CSU are further scrutinizing the role of the SAT in the admissions process. If the systems decide to drop the SAT requirement, then AB 1951 might have less of an impact. Looking forward, as state policymakers and districts continue to craft policies to improve college access, they should first consider how California’s universities are using—or not using—standardized tests.


Partisan Loyalty Trumps Gender Solidarity in California

A month until the midterm elections, California’s voters are gearing up for decisions that will have ramifications across the nation. Much has been discussed of a potential “blue wave,” with Democrats eyeing to flip seven Republican congressional seats in California—nearly one-third of the 23 seats needed to shift party control in the US House of Representatives. Concurrently, there are a record number of women running for US Congress and statewide executive offices, including 37 in California. With women comprising 54% of the state’s likely voters, how large a role will they play in the upcoming election?

According to PPIC’s September Statewide Survey, 50% of female likely voters say the upcoming election is more important to them than past midterms; just 3% say it is less important and 46% say it is about the same. Yet when looking at the partisan breakdown among female likely voters there are notable differences: 63% of Democratic women say the upcoming election is more important while 37% of Republican women say the same (sample sizes for independent female likely voters are too small for separate analysis).

In the generic ballot for the US House of Representatives, California’s female likely voters prefer the Democratic candidate over the Republican candidate (58% to 34%). Nearly all partisan female likely voters say they would vote for their own party. When asked about qualities they prefer in a candidate, six in ten Democratic women (60%) prefer those who have experience in politics to those who are new at it, while Republican women are divided (41% experience, 41% new to politics).

Recent prominent events at the national level may impact women’s preferences and turnout in the midterms. Our September survey was fielded following the initial Senate confirmation hearings for Judge Brett Kavanaugh’s appointment to the Supreme Court but prior to the additional hearing on sexual abuse allegations featuring Dr. Christine Blasey Ford. Nonetheless, nearly all female likely voters in our September survey view the choice of the next Supreme Court justice as either very (74%) or somewhat (18%) important to them personally. Across parties, Democratic women are much more likely than Republican women to say the choice is personally very important (82% to 62%).

Meanwhile, President Trump’s approval rating reflects sizable partisan differences among California’s female likely voters: 91% of Democratic women disapprove of the way Donald Trump is handling his job as president, while 80% of Republican women approve.

With women poised to play a pivotal role in the upcoming election, we may see the emergence of a “pink wave” that rivals the “Year of the Woman” associated with the 1992 election. Stay tuned to the PPIC Statewide Survey as we continue to monitor the preferences and attitudes of Californians, with a particular interest in female likely voters, leading up to the midterm.

New Laws on Drought, Forests, and Safe Drinking Water

The legislative session that just wrapped up addressed a number of water and forest management issues. Progress was made in three major areas—urban drought management, forest health, and safe drinking water.

Urban water use efficiency and drought management: Assembly Bill (AB) 1668 requires the State Water Board and the Department of Water Resources to adopt long-term efficiency standards for residential water use and efficiency metrics for commercial, industrial, and institutional water use by June 2022. The law complements Senate Bill (SB) 606, which requires urban water suppliers to develop local water use budgets by November 2023. Progress toward those objectives will be overseen by state agencies. SB 606 also strengthens local drought planning requirements and increases transparency of information about drought risks and responses. The law requires suppliers to regularly analyze the risk of a five-year severe drought and report short-term water shortage risks and responses to the state each spring. Suppliers must also revamp their drought response plans to include new elements such as descriptions of supply forecasting procedures, new ways of reporting water shortage levels, and protocols for communicating with customers during droughts. AB 1668 also includes provisions to increase drought preparedness for small rural water systems and large agricultural water suppliers.

Wildfires and forest management: SB 901 takes substantive steps toward reducing wildfire risks by increasing the pace and scale of forest health improvements. Cal Fire will have access to new, stable funding from cap-and-trade revenues—$200 million per year for five years—to pay for forest management. The law also helps lower management cost barriers for family forest owners, which occupy about one-quarter of the state’s headwater forests. It relaxes some timber harvest regulations to make it easier for these owners to reduce wildfire risk. A provision that increases the size of trees owners can harvest should expand their ability to raise funds from selling timber. The law also allows multiple landowners to work under the same timber harvest permit. Finally, SB 901 includes provisions that apply to forests managed by the US Forest Service, which make up more than half of our headwater forests. In particular, it streamlines California’s environmental permitting process for collaborative fire risk reduction projects on federal lands that are approved under the federal National Environmental Policy Act.

Safe drinking water for vulnerable communities: Drinking water received significant attention this year, as lawmakers attempted to fill the funding gap for small disadvantaged communities facing water quality and quantity problems. Proposals to tap urban water customers and agricultural fertilizer users for safe drinking water funds ultimately failed in the legislature. However, new laws signed by the governor will strengthen tools for addressing drinking water quality issues. AB 2501 increases the State Water Board’s ability to require the consolidation of vulnerable water systems with larger, more reliable systems. The new law expands the board’s authority to require the consolidation of communities served by domestic wells. AB 2501 also extends the board’s authority over support services to help communities provide safe drinking water where consolidation is not an option. Another new law, AB 2541, gives severely disadvantaged communities expanded access to the Drinking Water State Revolving Fund for water infrastructure projects. The law makes it easier for the board to provide full grant funding in addition to low-interest loans.

The governor also signed more than a dozen other bills related to water, in areas such as sewer system consolidation, on-site treatment regulations and rules for the reuse of non-potable water, and the establishment of an office within the State Water Board to help address water-rights matters.

We will keep track of updates and new proposals in 2019.

Tectonic Shifts in Orange County

Orange County has evolved from a Republican stronghold to a credible target of opportunity for the Democrats seeking to take control of the U.S. House of Representatives in the November election.

Until the most recent presidential election, Republican candidates had won in every top-of-the-ticket statewide race in Orange County for 20 years. In fact, the last time that a Democratic presidential candidate carried Orange County was in 1936. But in 2016, Democrat Hillary Clinton defeated Republican Donald Trump by 51 to 42 percent, a margin of 102,813 votes. Moreover, Clinton received more votes than Trump in each of the four Orange County House seats now held by Republicans.

Tectonic shifts in Orange County’s demographics and voter registration set the stage for the surprising 2016 presidential outcome and the competitive 2018 House races. First, Orange County’s population is transitioning. Since 2000, the proportion of whites has declined from 51 percent to 41 percent of the population. Latinos now make up to 34 percent and Asian Americans make up 21 percent of the population. Most Latino and Asian American likely voters are registered Democrats today.

Second, Orange County’s political stripes have changed from red to purple. Since 2000, the proportion of registered Republican voters has declined from 49 percent to 36 percent. Registered Democrats have increased to 34 percent and independents have increased to 27 percent. Today, most independent likely voters lean toward the Democratic Party. In sum, Republicans’ electoral clout is diminishing in Orange County.

Since this midterm election is a referendum on the president, how is Donald Trump viewed by Orange County voters? The Public Policy Institute of California’s Statewide Survey has been tracking President Trump’s popularity by asking the following question, “Overall, do you approve or disapprove of the way that Donald Trump is handling his job as president of the United States?” In five 2018 PPIC surveys, 40 percent approve and 56 percent disapprove of President Trump when combining the results for registered voters in Orange County.

Approval of Trump’s presidency in Orange County varies widely by party: 79 percent of Republicans, 30 percent of independents, and 13 percent of Democrats. Half of whites approve of his performance, while 28 percent of nonwhites approve. Overall, Trump’s approval rating in Orange County of 40 percent in 2018 closely mirrors his 2016 vote total, which was 42 percent. This indicates his political base in Orange County has not grown during his time in office.

Voter turnout will be the political wildcard in Orange County. Since 2000, Orange County’s voter turnout in midterms has been on average 21 points lower than in presidential elections. Low turnout this year would be a throwback to the “old” Orange County electorate—more Republicans and whites. A high turnout would reflect the “new” Orange County—more Democrats, independents, and nonwhites.

We’ll know in a month whether the new or old Orange County will prevail in 2018. But given the demographic and registration trends, the Orange County of the future will be very different from the one that consistently voted for Republicans.

College Rankings and Social Mobility

As high school seniors decide where to apply, numerous websites, magazines, and organizations are releasing lists of the “best colleges.” These rankings try to evaluate a college’s quality or highlight a particular factor, such as best value. Most rankings use similar data sources and variables, but each weighs factors differently in order to define and evaluate quality. Popular categories include student outcomes (graduation rate, earnings after college), measures of institutional quality (faculty quality, monetary value of resources for students), and affordability (net cost, institutional aid). Improving a college’s rank generally involves doing better in one or more of those areas relative to other institutions.

Recently, many rankings have started to consider social mobility—a school’s ability to move students up the ladder of economic opportunity. But the importance of social mobility in overall rankings varies widely. Just this year, US News World Reporta longtime leader in college rankings—removed acceptance rates from its methodology and instead factored in graduation rates for students who receive Pell Grants (these students are from the lowest-income families in the nation). Even so, the US News and World Report rankings do not give much weight to that measure. In contrast, Washington Monthly, another well publicized ranking, bases one third of its ranking scores on social mobility, including new data on graduation rate gaps between students who receive Pell Grants and those who do not. At the other end of the spectrum, the relatively new CollegeNet Social Mobility Index (established in 2014) focuses exclusively on elements of social mobility.

Research by the Equality of Opportunity Project shows that California’s public colleges do relatively well in promoting social mobility, particularly in moving students from the lowest to the highest quartile of income. The figure below shows the number of California’s public universities the top 50 according to each of three rankings; the greater the importance of social mobility, the higher California public universities rank relative to both private and public schools in other states.

Colleges pay attention to rankings, and highly rated schools publicize their ranks and use them in recruitment literature. A closer link between higher rankings and improved social mobility can be a win for California, its colleges, and its students.

2020 Census: Counting Los Angeles County

The decennial census plays an essential role in American democracy. Our series of blog posts examines what’s at stake for California and the challenges facing the 2020 Census, including communities that are at risk of being undercounted.

PPIC’s interactive census maps are an important tool for Californians working to ensure an accurate census count. Using estimates from the Census Bureau and the Federal Communications Commission, they highlight hard-to-count communities across the state and pinpoint reasons why certain areas may be hard to reach.

Home to about a fourth of the state’s population (10.3 million people), Los Angeles County may be one of California’s hardest-to-count regions in 2020. A third of the county’s census tracts are likely to be very hard to count, according to Census Bureau estimates that draw on local demographic characteristics (e.g., race/ethnicity, age, citizenship, and housing conditions) and historical trends. These areas tend to be concentrated in central and east LA south through Compton, as well as parts of Long Beach, the San Fernando and San Gabriel Valleys, Pomona, and Palmdale. Households in these very hard-to-count areas are less likely to respond initially to census forms and are therefore at risk of being undercounted.

Some highlights:

  • An undercount could reshape political representation in the region. Disproportionately undercounting parts of LA County could affect how district lines are redrawn after the census. Legislative districts in central and south LA have some of the highest concentrations of very hard-to-count communities in the state: In State Assembly District 59 (Jones-Sawyer), 96% of census tracts are considered very hard to count. In ten more legislative districts representing parts of central and south LA, over half of neighborhoods are considered very hard to count.
  • Undercounting people of color would dramatically misrepresent LA County’s urban core. About 57% of LA County residents are African American, Latino, or Native American—populations that have historically been undercounted in the census. In most central, south, and east LA neighborhoods, for example, African Americans and Latinos make up 80% to 100% of residents, compared with less than 15% in parts of nearby Beverly Hills and San Marino. If the 2020 Census again undercounts these groups, political representation could shift away from LA’s urban centers.
  • LA County’s hard-to-count housing is concentrated in communities of color. It can be difficult for the Census Bureau to accurately count people in rentals, overcrowded units, and mobile homes. Housing in LA County is among the hardest to count in the state. Moreover, in many neighborhoods with the hardest-to-count housing, nearly all residents are African American and/or Latino. Recognizing ways that hard-to-count communities intersect with each other will be important to conducting effective outreach to LA residents. In addition, reaching homeless Angelenos during the three-day window for counting people at shelters, tent camps, and other places will be critical to a complete and accurate count in the region.
  • Neighborhoods throughout the county have high shares of young children. In particular, east and south LA, as well as Lancaster and Palmdale, have larger concentrations of young children—who are typically undercounted in the census. In many of these neighborhoods, children under five years old make up more than 10% of residents, compared to less than 7% statewide.
  • Low responses from noncitizens would lead to a notable undercount in the region. Noncitizens may be less likely to respond to the 2020 Census due to the planned addition of a citizenship question and concerns about deportation and privacy. About 17% of LA County residents are noncitizens, compared to 14% statewide. In several neighborhoods in central and south LA, east LA, the San Fernando and San Gabriel Valleys, and Pomona, more than a quarter of residents are noncitizens.
  • The county has pockets of low internet access, including in the city of LA. The Census Bureau plans to collect the majority of responses online in 2020—a change from previous practice. Though urban areas generally have better internet access than rural areas do, a number of neighborhoods in central and south LA actually have fewer high-speed residential internet connections than the surrounding suburbs. The northeastern corner of the county also has lower levels of internet access. In these places, it may be harder to collect responses online, and participation will rely more heavily on in-person census takers or internet provided by local institutions.

We hope these maps serve as a starting point to help local, regional, and state leaders think about which activities, resources, and partnerships—including language assistance, awareness raising, and community outreach—might be most effective for accurately counting different parts of California. Stay tuned for more posts that examine hard-to-count communities in other regions of the state.

Video: Californians and Their Government

As the November election approaches, Democrat Gavin Newsom has a 12 point lead over Republican John Cox in the race for governor. In the US Senate race, Dianne Feinstein leads fellow Democrat Kevin de León by 11 points. Half of likely voters see this election as more important than past midterms; most lean toward Democratic candidates in US House races. These and other key findings in the latest PPIC Statewide Survey were outlined by PPIC researcher Dean Bonner at a Sacramento briefing last week.

A slim majority of California’s likely voters oppose Proposition 6, a ballot measure that would repeal recently enacted increases in the gas tax and vehicle registration fees. Proposition 10—which would expand the authority of local governments to enact rent control—is also trailing.

Other survey highlights:

  • Three in four likely voters view the choice of the next Supreme Court justice as very important to them personally.
  • Majorities of registered voters across parties say they do not want to see the Supreme Court’s Roe v. Wade decision completely overturned.
  • A third of likely voters approve of President Trump’s job performance and only 20% approve of Congress; by contrast, more than half approve of Governor Brown and the state legislature has a 44% approval rating.
  • Likely voters are most likely to name jobs and the economy, immigration, and housing as the most important issues facing the state.