The COVID-19 Crisis Is Affecting Low-Income Workers

As California responds to COVID-19, its low-income workers face particularly urgent difficulties. These Californians are not necessarily at high risk of health complications from COVID-19, but they will be deeply affected by the economic consequences of the steps being taken by cities, counties, and regions to contain the outbreak and protect public health.

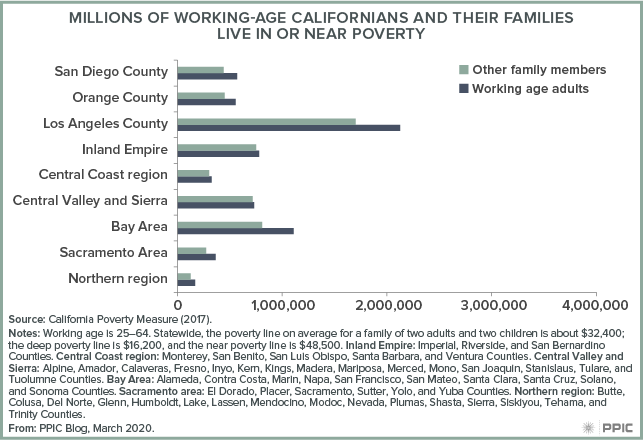
About 12.3 million Californians in families headed by working age adults live in or near poverty; a majority (58%) are Latino, while 21% are white, 12% are Asian, 6% are African American. About 1.5 million live in deep poverty (with resources less than half of the poverty line), while 4.3 million are just below the poverty line and 6.5 million are just above it (within one and one and a half times the poverty line).

The largest number of poor and near-poor Californians live in Los Angeles County (about 4 million), followed by the Bay Area (about 2 million).

figure - Millions of Working-age Californians and Their Families Live in or Near Poverty

The federal and state governments have been developing a range of short-term measures that promise to bolster the resources of Californians who are economically affected by this public health emergency. These measures include the expansion of food assistance benefits, paid sick leave, and unemployment benefits.

Steps like these are important because 12.2% of California’s working adults live in poverty, and after-tax income from work makes up 72% of poor and near-poor family resources, on average. A loss of $500 in annual income would push an additional 215,000 Californians into poverty, while a loss of $1,000 would put an additional 425,000 Californians below the poverty line. In short, even a relatively small financial loss can make a big difference.

Communicating to California’s Seniors about Coronavirus

Older adults are especially vulnerable to the coronavirus (COVID-19). Early data show that mortality rates among people age 60 or older are many times higher than among younger adults. Protecting this population is paramount to limiting the health consequences of the COVID-19 pandemic. In California, this means communicating information in ways that can effectively reach a particularly diverse older population.

California’s senior population is large and growing fast. In 2018 the number of older adults in California reached 8.0 million, up from 5.7 million ten years earlier, according to the American Community Survey. Today, one in five Californians is age 60 or over, a record high.

The rapid growth in the older population is not unique to California. Throughout the nation—as in most developed countries of the world—populations are aging rapidly. The aging of the very large baby boom cohort, declining birth rates, and increasing life expectancy have expanded the senior population.

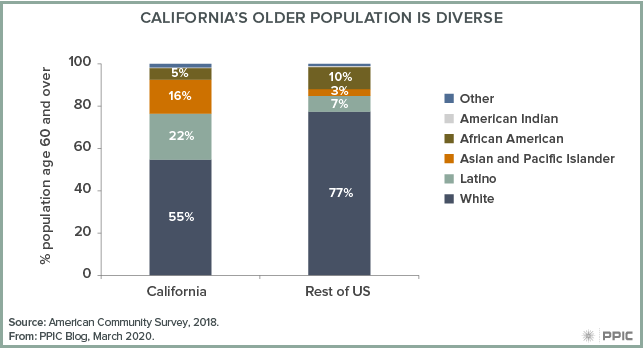
What sets California apart is its diversity. People of color make up almost half (45%) of California’s 60 and over population, about double the share of the rest of the nation (23%). In California, Latino and Asian American populations make up relatively high shares.

figure - California’s Older Population Is Diverse

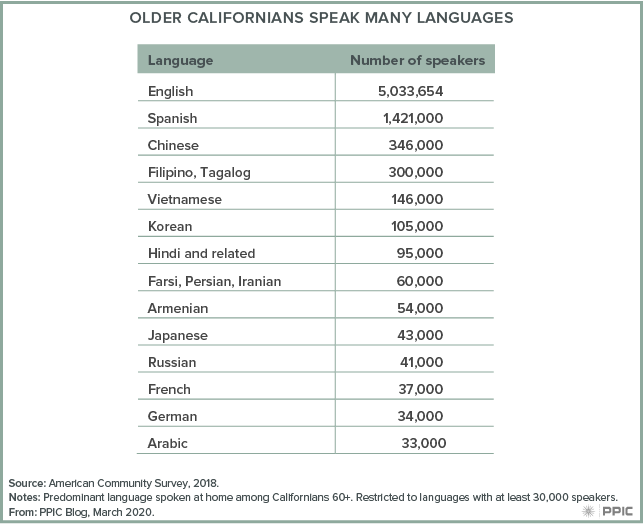
California’s older population is also diverse in terms of language: 37% of older Californians speak a language other than English at home, compared to 13% in the rest of the nation. While Spanish predominates among non-English speaking households, dozens of languages have at least 10,000 speakers. Among the 2.9 million Californians who do not speak English at home, 1.2 million are not proficient in English (speaking only some or no English).

figure - Older Californians Speak Many Languages

The vast majority of older adults live in the state’s large metropolitan areas—Los Angeles, Orange, San Diego, and Ventura Counties, along with the Bay Area. But in some lightly populated rural counties, they make up one-third or more of the population. These counties, in the far northern part of the state (Modoc, Trinity, and Siskiyou) and in the Sierra Nevada (Alpine, Amador, Calaveras, Mariposa, Nevada, Plumas, Sierra, and Tuolumne), could face acute local health care challenges.

It is essential that health services and public health messaging in California consider the state’s diverse population of older adults. Culturally and linguistically appropriate public health announcements, news, and services will help ensure that all Californians in all regions of the state have up-to-date information on the novel coronavirus and steps they can take to protect themselves and lessen its spread.

Will Students without Home Internet Fall Behind During Coronavirus Shutdowns?

K–12 schools across California are preparing for closures due to the coronavirus outbreak, to protect students from unnecessary exposure and to sanitize facilities. As schools consider moving classes online to mitigate the disruption to student learning, broadband access at home presents a formidable challenge.

The good news is that K–12 schools have the means to deliver classes online. PPIC research has found that the overwhelming majority (90%) of California schools met the Federal Communications Commission’s (FCC) minimum threshold for digital learning in 2018, and 59% of schools met the FCC’s long-term targets.

However, internet access is a bigger problem for students in their homes. In 2017, close to 1 million (15.6%) school-aged children (ages 6–17) had no internet connection at home, while over 1.6 million (27.5%) did not have broadband access. About 9.5 percent of households with school-aged children reach the internet only via a cellular data plan, which can be slower and more expensive. For these same households, the devices available are limited as well, with 12.7 percent reporting no laptop, desktop, tablet, or other portable wireless computer at home.

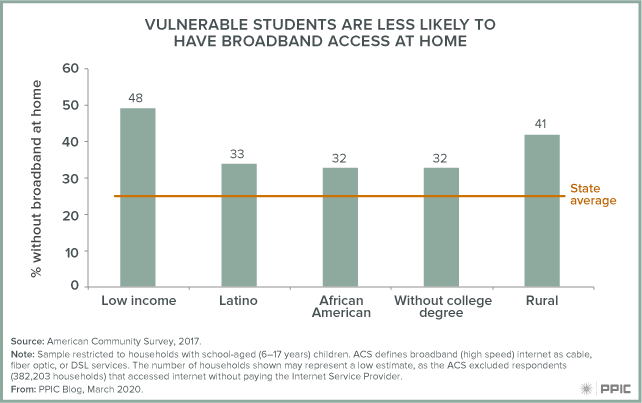
Underrepresented students are most at risk of falling further behind during school closures. About a third of Latino or African American students and students whose parents do not have a college degree lack a broadband subscription at home. Nearly half of low-income households with school-aged children have no broadband at home. Affordability remains a key barrier, as half of low-income households did not subscribe to broadband because of the cost.

In rural areas, access may depend on whether an area offers services. Forty-one percent of rural households with school-aged children do not subscribe to broadband at home, which is much higher than the state average (25%). For households with no internet access, 33.2 percent indicated internet was not available where they lived compared to 1.3 percent of respondents in metropolitan areas.

Households may not have internet or broadband for many reasons, including financial, technological, and topographical barriers.

figure - Vulnerable Students Are Less Likely to Have Broadband Access at Home

As the state and local authorities consider alternatives to in-person instruction, policymakers will need to consider how internet access will affect all students in the days and weeks ahead.

A Reality Check on Groundwater Overdraft in the San Joaquin Valley

This year marks a new phase in California’s landmark Sustainable Groundwater Management Act (SGMA). At the end of January, water users in 21 critically overdrafted basins delivered their first groundwater sustainability plans to the state Department of Water Resources. In this series, we examine the 36 plans submitted for 11 critically overdrafted basins in the San Joaquin Valley—California’s largest farming region. PPIC has done extensive work on what SGMA means for this region, where excess pumping is a major challenge. This post addresses key questions about groundwater budgets.

What are water budgets, and why do they matter?
Water budgets track the water coming into and going out of the groundwater basin. If more groundwater is pumped than the amount replenished over time, the basin is in overdraft. In our study of the valley’s 30-year water balance (1988‒2017), which used data on inflow and outflow to the San Joaquin Valley as a whole, we found a long-term overdraft of 1.8 million acre-feet per year—about 11% of net water use.

Under SGMA, water users need to bring their basins into long-term balance and avoid undesirable effects from excess groundwater pumping—such as lowering groundwater levels and causing lands to sink. Understanding the extent of the overdraft problem is key to taking appropriate action. As the saying goes, you can’t manage what you don’t measure.

What type of groundwater budgeting does SGMA require?
The regulations require groundwater sustainability plans (GSPs) to include three types of water budgets—historical, current, and projected—but allow a lot of flexibility on the specifics. Historical budgets only need to include 10 continuous years of data, including the most recent years available for that basin. Current budgets need to show present-day conditions, and projected budgets need to look ahead 50 years and consider anticipated changes in population, climate, and other factors that could affect water supplies and demands. The plans can then choose which budget to emphasize for addressing overdraft.

In many basins, water users have opted to develop separate GSPs for different areas. In those basins, the GSPs must use a common timeframe and a common overall budget. But there’s no requirement for consistency across neighboring basins. The regulations also leave it up to locals to choose their methods for elements that must be estimated, such as how quickly groundwater moves from one basin to another. Budgets can look better or worse depending on assumptions about such factors.

The span of years covered by budgets can also matter a lot, given California’s variable climate. Budgets with more wet years will look better than budgets with more dry years. The figure below shows the budget timeframes that the valley’s plans use for their preferred estimates of overdraft. These timeframes vary widely. Basins in the wetter northern part of the valley (the San Joaquin River hydrologic region) are more likely to include the recent drought than are the basins in the drier, more groundwater-dependent southern valley (the Tulare Lake Basin hydrologic region).

figure - Timeframes Used to Estimate Overdraft Vary across Basins


Do the plans acknowledge the valley’s overdraft problem?
In general, yes. As the figure below shows, the plans report a considerable amount of overdraft—around 1.4 million acre-feet (maf) per year. But since they cover different timeframes, it’s misleading to simply add up the totals reported. To compare apples to apples, we looked at the eight years that are included in all of the budgets: 2003‒10. This short period is instructive, because it includes both wet and dry years. The plans estimate around 1.7 maf of annual overdraft in these years—fairly close to our valley-wide estimate of 1.9 maf for the same period. So overall, the plans are telling a story that is broadly consistent with the overall regional water balance. This apples-to-apples comparison also reduces the wet-year bias in many of the Tulare Lake Basin budgets.

figure - Plans Acknowledge Significant Overdraft

Even so, some basins are probably underestimating overdraft. And if the future is drier than the past, the overall challenge for the valley could be greater. We found, for instance, that the region-wide overdraft for 2003‒17—a period that included a record-breaking five-year drought—was 2.4 maf/year—a good deal higher than the 30-year average of 1.8 maf.

What’s next?
Acknowledging overdraft is important, but it’s just the first step. The options to end overdraft include augmenting water supplies, reducing water demand, or some combination of the two. Next week’s post will examine what the plans propose to do.

Note: The underlying data and additional notes on the water budgets used in these plans can be found in Data Set: PPIC San Joaquin Valley GSP Water Budgets.

California’s Population Slowdown

The decennial census is fast approaching. Starting this Thursday, March 12, most households in the country will be sent an invitation to fill out a census form online. Over the next several months, the US Census Bureau will prod those who have not responded to make sure they are counted. The count will have important implications for political representation, federal funding, and a wide range of research.

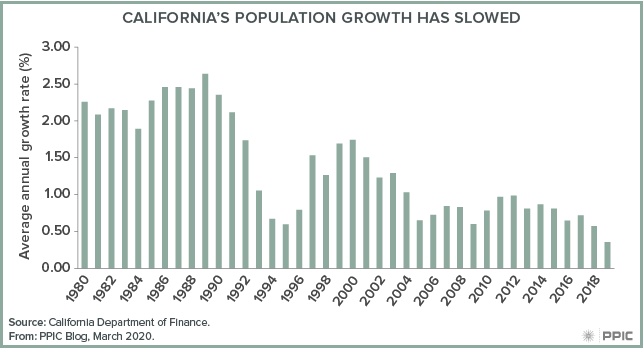
Thanks to yearly estimates from both the Census Bureau and our state’s Department of Finance, we already know a lot about how the state population has changed, even before the census count begins. The latest numbers suggest a marked slowdown since the early 2010s. The California Department of Finance estimates annual growth of just 0.35% in 2018 and 2019, down from nearly 1% from 2010 through 2012.

figure - California’s Population Growth Has Slowed

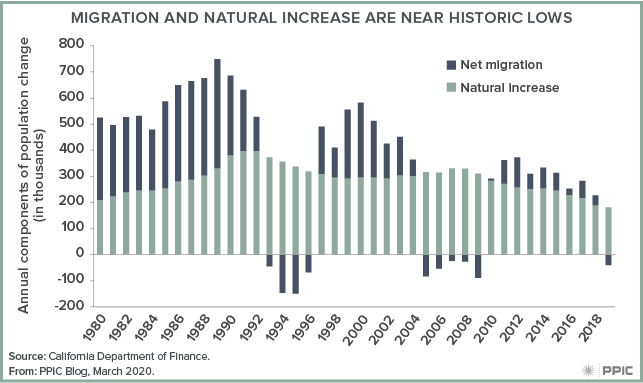
California is now a net loser in overall migration—that is, migration to and from both other states and other countries—for the first time since the Great Recession. The state has long experienced net losses in domestic migration—it has had net gains in only 3 of the past 30 years—but the losses have risen from 116,000 in 2017 to 198,000 in 2019.

International migration used to make up for domestic losses, but it has also slumped in recent years. The California Department of Finance estimates that net immigration from other countries has dropped from a gain of 217,000 in 2017 to a gain of 181,000 in 2019. The US Census Bureau reports an even bigger drop in international migration, enough for a total population estimate that is 447,000 people smaller than the one from the Department of Finance.

California’s population is also getting older, and the state’s young adults are having fewer children. Natural increase—the difference between births and deaths—has been falling since the early 1990s. It remained above 280,000 each year from 1991 to 2010, but since 2015 it has fallen from 247,000 to just 181,000. This decline mostly comes from a downward trend in births. In 2019, California had 11.3 births for every 1,000 residents, its lowest rate in well over a century.

figure - Migration and Natural Increase Are Near Historic Lows

Natural increase is essential to understanding California’s future. Net migration may rebound, as it has in the past. But the state’s birth and death trends indicate that California’s population will grow slowly for years to come.

Video: Fiscal Challenges of Declining Enrollment in California Schools

Enrollment declines in California’s public K–12 school system are expected to intensify in the coming decade. Districts with falling enrollment face financial pressures, as state funding falls along with the number of students they serve. Lower enrollment also has important implications for the state budget. At a lunchtime event in Sacramento last week, PPIC researcher Paul Warren outlined a new report on declining enrollment and a panel of experts offered state and local perspectives.

Warren explained that enrollment is falling in about half of California’s school districts. In the coming decade, declines will be significant in coastal areas—and in many of the state’s largest school districts. The state budget cushions the fiscal impact of declines in enrollment by delaying attendance-based funding cuts for one year. But enrollment declines are almost always long term, and district costs do not fall at the same rate as district revenues.

Renee Arkus, executive director of fiscal services for the Long Beach Unified School District, said that adjusting to lower enrollment hinges on knowing the speed and the spread of declines. Long Beach, the state’s third-largest district, has been experiencing declines for 15 years. “We’ve lost 25% of our population,” she said, adding that the district has been losing 1,500 to 2,000 student each year, and those losses have been spread across a number of schools.

Sara Bachez, assistant executive director of governmental relations for the California Association of School Business Officials, noted that declining enrollment is one of many fiscal pressures districts are facing. She cited a growing demand for special education, pension and health care costs, aging infrastructure, and the challenge of offering proper compensation for district staff.

Claudia Davis, associate superintendent of the Calaveras County Office of Education, highlighted the challenges that small districts face. Like Long Beach, Calaveras County has been experiencing declines for the last 15 years. But because Calaveras is a small county, it is challenging to find ways to reduce spending. “We have district offices with three people in them,” she said, so cutting staff would have a big impact: “The work has to get done regardless of the size of your district.”

Mike Fine, chief executive officer of the Fiscal Crisis and Management Assistance Team, pointed out that the fiscal challenges that Calaveras County faces are typical, as more than half of the state’s districts serve fewer than 2,500 students. In his view, the best guide to addressing these challenges is the Local Control and Accountability Plan (LCAP) that each district is required to develop. “We have to clearly define what are our core services that we can’t do without, and then everything else is up for discussion,” he said.

Most districts could benefit from state assistance in forecasting and responding to declining enrollment. As Arkus put it, long-term planning is “the only way that some districts can survive this.” And Davis noted that small districts don’t have the human capacity for exhaustive planning. “Long-term planning is difficult when you’re . . . just trying to keep the doors open.”

Voting Matters to Most Californians, but Many Don’t Show Up

Most Californians see voting as critical to a healthy democracy. In our February Statewide Survey, overwhelming majorities of adults (86%) and likely voters (96%) said voting in the 2020 elections is very important, a view held among those registered (90%) and not registered (76%) to vote.

However, while most hold this view, we know that 85% of California adults are eligible to vote but only 70% are registered. Low political participation is cause for worry in and of itself. If a small electorate does not represent the population—as is the case in California—there is even greater cause for concern.

Today, California’s adult population is 42% white and 35% Latino; the remainder are Asian American (15%), African American (6%), and other (3%). Yet 57% of California likely voters are white—only 20% are Latino, and the balance are Asian American, African American, and other. The percentage flips among nonvoters: 56% are Latino and only 22% are white.

figure - Likely Voters Do Not Represent California’s Diversity

And while a third of adults are foreign born, 83% of Californians who frequently vote in state elections are US born. Among nonvoters, 34% are US born (California Department of Finance 2019).

Differences between likely voters and nonvoters sharpen along age and socioeconomic lines. Frequent California voters are age 45 and older (65%), own their home (64%), have attended (39%) or graduated (41%) college, and have annual household incomes of $60,000 or more (59%). Nonvoters are younger than age 45 (65%) and renters (65%); about one in five are college graduates, and one in four earn $60,000 or more.

The political attitudes of voters and nonvoters also differ markedly and often reflect their socioeconomic conditions. Although the many nonvoters in the state may make their preferences known in public opinion surveys on issues, the views of likely voters prevail at the ballot box, when they decide on important matters that affect all Californians.

For example, single-payer healthcare has been a topic of robust discussion leading into the Democratic primary. In California, a split has emerged between nonvoters and likely voters over the question of whether health care coverage should be the responsibility of the federal government. While most nonvoters (72%) say it is the government’s responsibility, fewer likely voters (55%) hold this view.

figure - Nonvoters View Healthcare as a Government Responsibility

On Election Day, it’s important for all Californians eligible to vote make their voices heard. The state has made participating in elections more seamless than ever—even those not yet registered can take advantage of same-day voter registration at a local polling place. Californians overwhelmingly believe in the importance of elections. Today is the day to act on that belief.

Why the Big Drop in California’s Colorado River Water Use?

In 2019, California’s use of the Colorado River—a major water source for Southern California’s cities and farms—dropped to the lowest level in decades. We asked John Fleck—director of the University of New Mexico’s Water Resources Program and a member of the PPIC Water Policy Center research network—about the ongoing changes in California’s use of this water, and what it means going forward. He is the author, with Eric Kuhn, of the new book Science Be Dammed: How Ignoring Inconvenient Science Drained the Colorado River Basin.

photo of John Fleck

PPIC: What are the main reasons Californians are using less Colorado River water?

JOHN FLECK: The biggest reason for the recent drop is that Metropolitan Water District (MWD)—the state’s biggest urban user of the river—didn’t need to take as much water in 2019. But this decline also reflects a longer term trend. Prior to the early 2000s, MWD generally took the maximum it could from the Colorado River, usually more than a million acre-feet per year. In recent decades, it has substantially reduced its dependence on the Colorado, only taking a full supply in years of State Water Project shortage. Water conservation has been an enormous success in Southern California. There was a lot of progress in conservation during the latest drought, and even after it ended. We’re seeing a lot more effective use of water in the basin, with a growing emphasis on groundwater recharge, stormwater capture, and reuse efforts. The excellent snowpack in the Sierra in 2019 meant the agency got a good water allocation from the State Water Project, meaning it needed less from the Colorado.

The other part of this story is the conservation success in the Imperial Irrigation District (IID)—the largest user of Colorado River water in the entire basin. On-farm water conservation was part of transfer agreements with Southern California’s urban water suppliers. IID is now using 600 thousand fewer acre-feet per year than before those transfers took place. The agricultural community took cuts and was compensated for them. Farmers have adapted well: revenue has held up even as they’re irrigating less land. What we’ve seen is an increase in acreage in high-dollar crops like winter lettuce and vegetables, and a reduction in alfalfa and forage crops, which bring in less revenue per unit of water and area of land.

figure - Use of Colorado River Water Is Dropping, Especially in California

PPIC: Do you expect similar drops in coming years in California or the six other basin states?

JF: We’re going to have ups and downs—especially because MWD use of Colorado River water tends to go up when its supplies from the Sierra are low. But California has really demonstrated that it needs less Colorado River water. It’s taken awhile, but it’s been a really successful adaptation. Scarcity is the norm now in the basin, so the fact that California can succeed in using less imported water is incredibly important. It shows how we can find opportunities for more flexible problem-solving going forward.

We’re seeing similar things going on across the basin. California isn’t giving up water so others can use more. Nevada is using substantially less than they used to—their use peaked in the early 2000s and has dropped since then. Arizona’s use is down, too. And we’re seeing really flat to declining use in all the other basin states. So the notion that economic and population growth means an increase in water use just isn’t the case in the basin.

PPIC:  What does this change mean for efforts to bring the basin into balance?

JF: Because we made mistakes over a century ago in allocating more water than the river can provide, these successes are important, but not enough. We’ll need to see more reductions, especially in the lower basin states.

The next steps require renegotiating the rules that govern the basin’s water allocation to solve the basin’s problems. The Bureau of Reclamation is spending 2020 reviewing how the current rules are working, with the expectation that negotiations on new rules will begin soon after that review is complete. There will be a lot of give and take in how that will play out, and we have to let that happen. Once farmers and communities have a clear idea on how much water they will get, they’re pretty good at figuring out what steps are needed to work within those limits. Various options that might come into play include compensating farmers to use less water, additional conservation, and more expensive options like increasing the use of recycled water and building desalination plants. The negotiations will be hard, but the successes we’ve seen in California and elsewhere around the Colorado River Basin suggest that we have the tools needed to respond to the challenges to come.

Video: Californians and Their Government

In California’s March 3 primary, the state ballot will feature several initiatives—including a $15 billion bond for the construction and modernization of public education facilities. Slightly more than half of likely voters approve, while 42% are opposed and 8% are undecided. PPIC researcher Dean Bonner outlined this and other key findings from the latest PPIC Statewide Survey at a briefing in Sacramento last Friday.

In November, Californians may be asked to vote on a constitutional amendment that would require state and local governments to provide housing or shelter beds to all homeless residents. About six in ten adults and 55% of likely voters say they would vote yes on such an amendment. Majorities of adults and likely voters also support Governor Newsom’s proposal to allocate $1 billion to address homelessness.

Other survey highlights:

  • More than six in ten Californians say housing affordability is a big problem in their part of the state, and the cost of living is causing many to consider moving out of California.
  • A majority of Californians (53%) approve of the way Governor Newsom is handling his job; this is the governor’s highest approval rating to date.
  • Views on the governor’s plan to scale back the high-speed rail project are mixed, while most approve of his proposal to build only one tunnel under the Sacramento–San Joaquin Delta.
  • Bernie Sanders leads all other Democratic presidential candidates with 32% support among Democratic primary likely voters. Joe Biden has 14% support, 13% support Elizabeth Warren, and Pete Buttigieg and Michael Bloomberg were tied at 12%.

Electability Matters in the Democratic Primary

Californians will head to the polls next Tuesday for the Democratic primary—and over 2 million have already returned their mail-in ballots. As Democratic and independent (also known as no party preference) voters prepare to choose their presidential nominee, the question arises: do they care more about electability or a candidate’s position on the issues?

Electability seems to edge out issue position for likely voters. According to our February 2020 survey, choosing the candidate most likely to defeat Donald Trump is more important to nearly six in ten Democratic primary likely voters (57%), while one in three (33%) say nominating a candidate whose positions on the issues come closest to theirs is more important. Findings were similar in our November 2019 survey (55% electability, 36% issue positions).

This view is widely held among Democratic primary likely voters, with at least half across nearly all demographic groups saying electability is more important. Among the lone outlier group—likely voters age 18 to 44—half think the candidates’ positions on the issues is more important.

figure - What’s More Important to Likely Voters in a Democratic Nominee?

There is a connection between a likely voter’s priorities and support for specific candidates. Among those who rank candidate positions on issues as more important, 43% support Bernie Sanders; fewer support Pete Buttigieg (13%), Elizabeth Warren (11%), Joe Biden (9%), or Michael Bloomberg (7%). For those who rank electability as more important, Sanders is also the top choice with 24% support, but he is followed closely by Biden (16%), Bloomberg (16%), Warren (15%), and Buttigieg (12%).

As Californians prepare to cast their votes at the polls—and continue to send in mail ballots—electability will be on the minds of many, and it could play a role in deciding who the Democratic Party nominates to run in the fall.