Reviving the Health Care Mandate: Who Pays?

Governor Newsom has proposed creating a state individual mandate to help fund increased health insurance subsidies for low- and middle-income Californians. One of the major reforms ushered in by the Affordable Care Act, the federal individual mandate—which was rolled back in the federal tax bill passed in 2017—required most individuals to have comprehensive health insurance or pay a tax penalty. The governor’s administration projects approximately $500 million in revenue from the mandate, based on the total amount paid by Californians in 2016.

As the governor and legislature consider a state mandate, it’s worth examining which Californians paid the federal mandate penalty.

Between 2014 and 2016, taxpayers with incomes below $50,000 accounted for a vast majority of returns that included the individual mandate penalty. In 2014, the first year the individual mandate went into effect, the penalty was 1% of income or a maximum of $285 per family ($95 per adult and $47.50 per child). More than 1 million tax returns in California paid the penalty. Taxpayers with incomes below $25,000 accounted for about 45% of returns subject to the penalty, while those with incomes between $25,000 and $50,000 accounted for another 37%. Even more low-income individuals would have been subject to the penalty if not for certain exemptions—such as having an income below the tax filing threshold ($12,500 for a single adult) or facing hardships like bankruptcy and eviction.

In 2016, the minimum payment rose to 2.5% of income or a maximum of $2,085 per family ($695 per adult and $347.50 per child). The total number of taxpayers subject to the penalty dropped to about 600,000. Those with incomes below $50,000 still accounted for nearly three-fourths of all payments, though this was down from 83% in 2014.
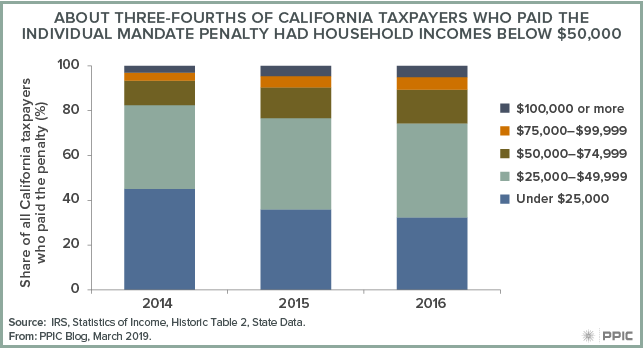
About Three-fourths of California Taxpayers Who Paid the Individual Mandate Penalty Had Household Incomes Below $50,000

The revenues generated also disproportionately came from taxpayers in lower income brackets. In 2014, taxpayers with incomes below $50,000 accounted for more than 55% of the $222 million in total payments from California taxpayers. Those with incomes under $25,000 paid more than $48 million and those with incomes between $25,000 and $50,000 paid more than $74 million.

Although the number of taxpayers subject to the penalty dropped from 2014 to 2016, tax revenue doubled—in part because the penalty amount increased—and reached $446 million in 2016. Over this time, the share of the total amount paid by households with incomes of $100,000 or more decreased, from 17% to 14%. Meanwhile, the share of revenue paid by those with incomes below $50,000 rose, from 55% in 2014 to 59% in 2016.
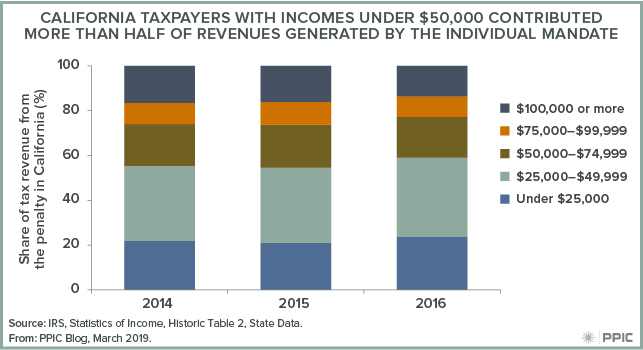
California Taxpayers with Incomes Under $50,000 Contribute More Than Half of Revenues Generated by the Individual Mandate

If the state does implement the governor’s proposal, the revenue would increase subsidies currently available for individuals with incomes between 250% and 400% of the federal poverty level ($31,225–$49,960 for a single adult) and expand subsidies to individuals with incomes between 400% and 600% of the federal poverty level ($49,960–$74,940). Most Californians with lower incomes are eligible either for no-cost Medi-Cal or heavily subsidized coverage through Covered California—though not everyone who is eligible enrolls in these programs.

The repeal of the federal individual mandate is expected to lead to an increase in the number of uninsured individuals and higher insurance premiums. A state individual mandate might help counteract those effects by encouraging healthy individuals to enroll in coverage—but at a cost.

In an otherwise progressive state tax structure, the implementation of the federal mandate disproportionately affected low-income Californians. There’s also evidence that some Californians paid the penalty even though they should have been exempt. If the state revives the mandate, the governor and legislature should consider how to improve awareness about eligibility and exemptions so this problem can be avoided. At the same time, reducing the number of people paying the penalty also means that the governor’s revenue estimate may need to be lowered. As policymakers engage in discussions over a state individual mandate, assessing who bears the burden of the tax and who benefits will be an important consideration.

Declining K–12 Enrollment Forces Major Budget Cuts in Many Districts

The teacher strikes in Los Angeles and Oakland reflect the fiscal stresses facing many school districts across the state. Rising pension and health care costs account for some of this pressure. For many districts, declining student enrollment is another factor.

Because state funding is based on average daily attendance, falling enrollment leads to lower state funding levels. Significant, sustained declines require districts to make difficult decisions to stay afloat financially. Since an average of 82% of K–12 spending goes to salaries and benefits, downsizing often means reducing teachers and administrators—or possibly closing a school.

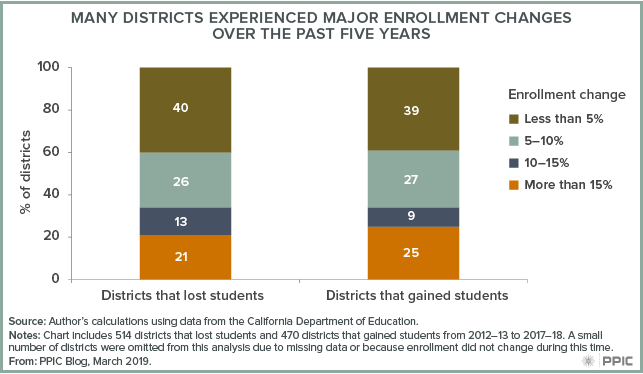
Over the past five years, overall K–12 enrollment in California increased by only 0.1%, or 6,600 students out of the more than 6.2 million attending public schools. This stable picture masks significant variation across districts. Roughly half of the state’s nearly 1,000 districts experienced enrollment losses, while the other half grew over this time. In many cases, the change was small: about 40% of districts experienced a net change—gain or loss—of less than 5% from 2012–13 to 2017–18.

However, the majority of districts saw an enrollment change of more than 5%. Indeed, 107 districts lost more than 15% of students. These districts were generally small: the average school had 700 enrolled students in 2012–13 and lost more than 170 students over the five-year period. In some cases, these large enrollment losses were associated with the closing of a charter school. Many of these districts, though, have only one school, and large percent reductions in enrollment require significant cuts in teachers, administrators, and other staff.

Many Districts Experienced Major Enrollment Changes Over the Past Five Years

Many large districts also lost significant numbers of students over the past five years. In Los Angeles County, for instance, 61 of 79 districts experienced enrollment declines—including Los Angeles Unified, which lost 34,000 students (a 5% decline) and Long Beach Unified, which lost almost 7,600 students (9%). In addition, seven districts with more than 10,000 students lost between 10% and 15% of enrollment. For a district of 10,000 students, losing 10% of enrollment translates into 1,000 fewer students—equal in size to two typical elementary schools. For example, Montebello Unified saw a dramatic 13% decline, losing more than 4,000 students during the five-year period.

Declining student enrollments can be due to a wide range of factors—changes in charter school enrollments, decreasing birth rates, or families moving away, among others. Laying off teachers and adminsitrators is painful—and closing schools is a particularly wrenching topic, as parents value their local schools.

Governor Newsom’s proposal to help districts with rising pension costs may relieve some—but not much—of the financial pressure for districts. K–12 financing in California is also affected by voter-approved initiatives that make significant school funding increases unlikely in the near term. There’s no easy solution, but unless these dynamics change, districts will need to learn to adjust to long-term enrollment and revenue reductions or face the risk of insolvency.

How Strong Is the Trump Effect in California?

Was the 2016 presidential election a sign of things to come—presaging an ever-bluer California? Or was it a one-off result driven by the personalities of the candidates?  These are important questions in California, which voted more Democratic for president in 2016 than it had in 2012, even as the rest of the country moved in the opposite direction.  Even more important, parts of the state that had been reliably Republican—most notably Orange County—suddenly shifted Democratic. Based in part on this result, California’s Democratic candidates fought hard in yesterday’s midterm for several US House seats held by Republicans.

Did the anti-Trump/pro-Clinton vote reliably predict the 2018 outcome? To answer this question, the figure below compares California’s 2016 presidential vote to the 2018 US House vote in all districts with both a Democrat and a Republican running. The solid black diagonal line marks the point where the 2016 presidential vote perfectly matches the 2018 US House vote. Points above the line mark seats where the Democrats outperformed the 2016 presidential vote, and points below show where they underperformed. The competitive seats mentioned above are identified in orange.

The first thing to note is that the 2016 presidential vote predicts the 2018 US House vote quite well.  Higher Democratic presidential votes reliably translate into higher Democratic House votes, so knowing the presidential vote tells us a lot about how a district is going to vote for other offices. This is true even for the competitive races in which the 2016 presidential vote was a surprise.

At the same time, virtually every seat falls below the solid diagonal line. That means the Democratic House candidates in these districts consistently failed to match the support shown for Hillary Clinton in 2016. Though the Democrats are poised to pick up at least three House seats in California, support for the Democratic Party is softer in these races than it was two years ago.

On balance, however, the 2016 outcome was not a one-off:  the areas that voted more Democratic than expected are continuing to vote more Democratic.  At the same time, Democrats would have picked up more seats in the midterm had the US House vote this cycle matched the 2016 presidential vote exactly. Despite what was generally a good Democratic night, the overall outcome fell short of the 2016 benchmark.

Commentary: California Should Plan as if Drought Has Returned

This commentary was published in the Sacramento Bee on December 20, 2017.

The unusually warm, dry start to this winter—along with intense wildfires in southern California—has many Californians experiencing “drought deja vu.” Despite this uneasy feeling, we are not in drought. But it might be prudent to act as if this is the beginning of the next one. Here are some short-term priority areas for drought planning that we think can help the state prepare.

Read the full commentary on sacbee.com.

Testimony: The Need for College Graduates in California’s Future Economy

Hans Johnson, director and senior fellow at the PPIC Higher Education Center, testified today, November 1, 2017, before the Assembly Select Committee on the Master Plan for Higher Education in California. The master plan defined a strategy to meet the state’s education needs in 1960—but today, California faces new challenges. The topic of today’s hearing: ensuring that the master plan meets workforce needs.

Here are his prepared remarks.

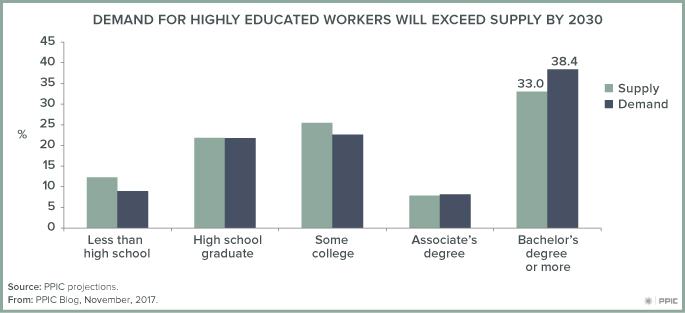
PPIC has produced a series of reports on California’s future population and economy.  Our report Will California Run Out of College Graduates?, provides projections of the demand for and supply of workers by educational attainment to 2030. Our primary finding is that California faces a shortage of highly educated workers. Specifically, economic projections to 2030 show that about two in five jobs will require at least a bachelor’s degree, while demographic projections suggest only about one in three Californians will have at least a bachelor’s degree. This shortfall equates to 1.1 million workers.

figure - Demand for Highly Educated Workers Will Exceed Supply by 2030

In this testimony, I first describe how California’s population and economy are changing, and then identify how the state and its higher education institutions can increase college enrollment and completion to produce more college graduates.

California’s economy is increasingly demanding highly educated workers

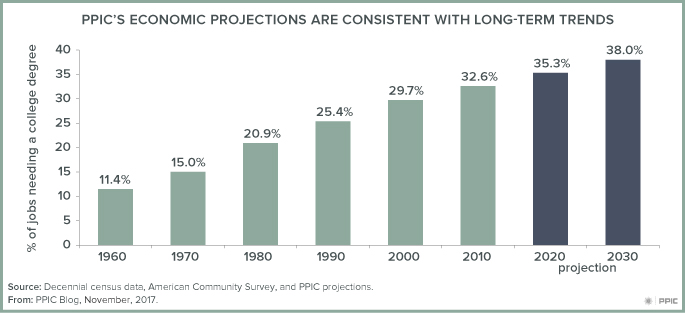
To develop our economic projections, we apply trends in educational attainment levels within occupations to occupational projections developed by the California Employment Development Department. We examine changes in labor market demand that are occurring due to shifts in the distribution of occupations and changes in educational attainment within occupations. Our primary finding is that the state’s economy will continue along a well-established trajectory, with a growing share of jobs requiring at least a bachelor’s degree.

figure - PPIC's Economic Projections Are Consistent with Long-term Trends

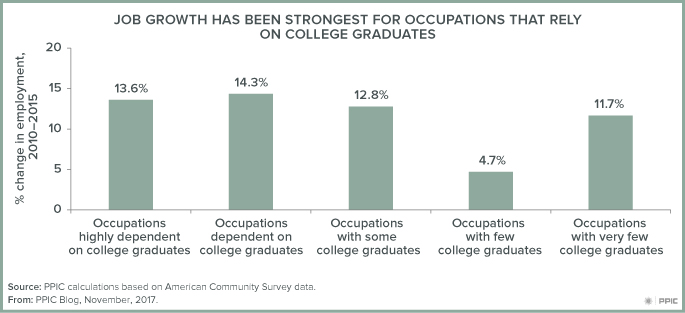
The two key drivers of increasing demand for college graduates are: 1) faster growth in occupations that commonly require a college degree (e.g., computer technology occupations), and 2) increases in demand for highly educated workers within occupations (e.g., nursing).  While both drivers are important, in recent years most of the increased demand (74%) for highly educated workers has occurred because of faster job growth in occupations that commonly require a college degree. Among large occupations (with at least 100,000 full-time year-round workers), those with especially rapid growth rates over the past five years include software developers (56% increase between 2010 and 2015), computer scientists and systems analysts (42% increase), and managers (35% increase). These and other highly skilled occupations have experienced faster growth than most less skilled occupations.

figure - Job Growth Has Been Strongest for Occupations that Rely on College Graduates

The second key driver of demand has been an increase in educational attainment within occupations.  For example, the share of registered nurses with a bachelor’s degree has grown from 57% in 2000 to 68% in 2015.  Altogether, over a five year period (from 2010 to 2015) about 26% of the increase in jobs for college graduates has occurred as demand for highly educated workers has grown within specific occupations.

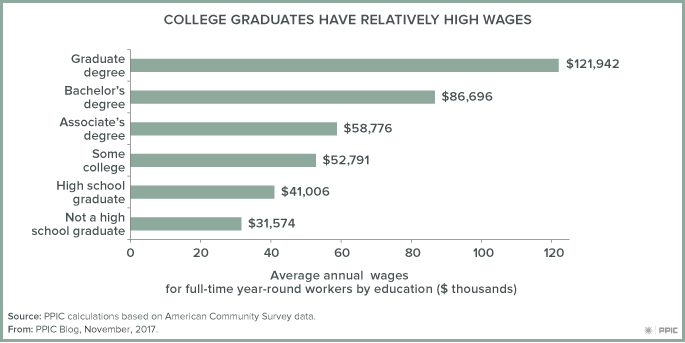
Are college degrees really necessary for these jobs? We examine a number of labor market outcomes to answer this question.  Within and across occupations, we find higher labor force participation rates, lower unemployment rates, and higher wages for workers with a bachelor’s degree than for those without. And in general, as educational attainment increases, wages also increase. Overall, the wage premium for college graduates relative to less educated workers has grown. By 2015, the average annual wage for full-time year-round workers was more than twice as high for workers with a bachelor’s degree than for those with a high school diploma.

figure - College Graduates Have Relatively High Wages

Within each of 51 occupational groupings we see higher wages for college graduates than for high school graduates. Among registered nurses, for example, those with a bachelor’s degree earned 12% more than those with an associate’s degree.

California’s educational institutions are not keeping up with demand

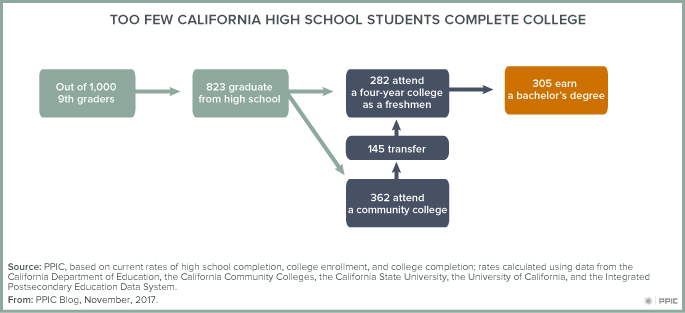
Too few Californians are graduating from college. At current college enrollment and completion rates, only 30.5% of 9th graders in California will eventually earn a bachelor’s degree either in California or elsewhere in the United States.  Compared to other states, California ranks 47th in the share of high school graduates that enroll in four-year colleges and 5th in the share that go to community colleges. Low rates of transfer from community colleges to four-year colleges exacerbates the problem.

figure - Too Few California High School Students Complete College

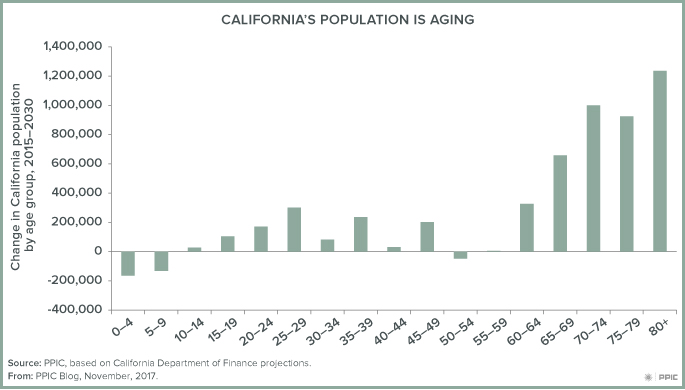
A critical challenge is the retirement of the large and relatively well-educated baby boom. Called the “silver tsunami” by some, this aging out of the labor force of millions of older adults is the first time in the history of California that such a large and well-educated group is exiting the labor force. In contrast, the number of young adults in California is projected to increase only modestly.

figure - California's Population Is Aging

Not all degrees are equal

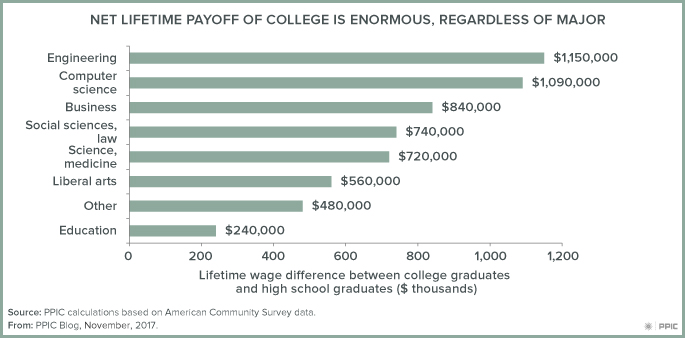
On average, college graduates have very strong labor market outcomes. While at any point in time, some college graduates are working in jobs that do not necessarily require a college degree, over the course of their careers the vast majority of college graduates will move into occupations that reward their educational training. Our estimates show that students who earn bachelor’s degree in engineering and computer science fare very well in the labor market, but even those in less remunerative majors such as education and the liberal arts will still earn far more in wages than less educated workers, even after taking into account all the costs of going to college.

figure - Net Lifetime Payoff of College Is Enormous Regardless of Major

How to close the degree gap

To close the gap, California and its higher education institutions will need to establish new policies and practices to enroll more students, especially in our four-year colleges and universities, and ensure greater success of students already in college. In previous testimony, PPIC has identified targets for each of the state’s public systems with respect to admission, transfer (from community colleges to four-year colleges), and improved graduation rates. Improving access and success among groups historically underrepresented in higher education, including low-income students, first-generation college students, Latinos, and African Americans is essential if we are to close the degree gap.

The good news is that new goals adopted by the California State University (CSU) system and the California Community College system are entirely consistent with PPIC’s identified targets. New initiatives, including remediation reform at the community colleges and at CSU, have the potential to substantially increase student success. CSU’s new graduation initiative aims to substantially increase graduation rates and eliminate gaps between groups of students. Strong increases in college preparation among the state’s high school graduates are also a positive sign, with the share of students completing the college preparatory requirements of UC and CSU reaching an all-time high.

Finding ways to accommodate all these students remains a central challenge, but one we must meet in order to ensure a better future for all Californians.

Learn moreVisit the PPIC Higher Education Center