LAUSD’s Measure EE and the Parcel Tax Vote Threshold

On June 4, voters in the Los Angeles Unified School District (LAUSD) will decide the fate of Measure EE, a historically large parcel tax that would generate about $500 million a year. Like all parcel taxes, Measure EE has a high bar to clear: two-thirds of voters must approve it. More than half of all proposed parcel taxes have cleared this bar since 2003.

The California Legislature is considering a constitutional amendment to lower the parcel tax vote threshold to 55%. If the legislature approves this proposal, California voters will weigh in. The amendment’s success at the ballot box is far from certain: the April 2019 PPIC Statewide Survey found that just 39% of likely voters would favor such a measure. But what might happen if the legislature and voters did ultimately approve the lower vote threshold? If the state’s recent experience with school bond measures is any indication, we would expect to see more parcel taxes placed on the ballot, with more of them passing.

The parcel tax is a California phenomenon. Proposition 13 (1978), which placed strict limits on commercial and residential property taxes, included a provision allowing cities, counties, and other districts to impose “special taxes” if two-thirds of voters approved. While the majority of parcel taxes levy a flat dollar amount per parcel—a lot or piece of property—Measure EE ties the dollar amount to the square footage of the building(s) on each parcel.

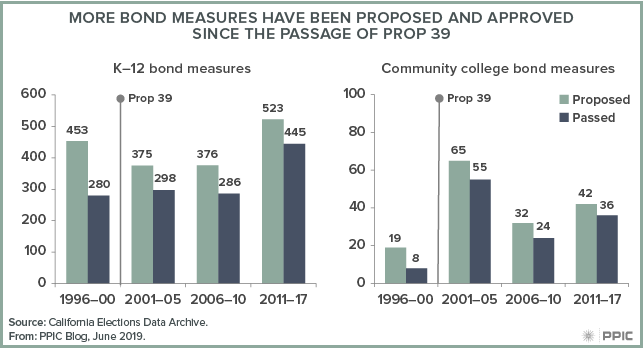
California voters lowered the approval threshold for school and community college bond measures to 55% when they approved Proposition 39 in 2000. The passage rate for K–12 bonds increased from 62% in the five-year period before Prop 39 to 79% in the five-year period after it was approved, and both the number of measures and rate of passage for K–12 bonds have been rising since 2011. This increase is especially striking given that the median bond amount has more than doubled (from $20 million to $45 million) since the threshold was lowered.

The trend has been similar for community college bond measures, though there are far fewer community college districts (73) than school districts (1,026) in the state. After Prop 39 passed, more colleges placed measures on the ballot—especially from 2001 to 2005—a higher share passed, and bond amounts increased. Passage rates increased from 42% before Prop 39 to 86% since 2011. The median amount has more than tripled since 1996 (increasing from $87 million to $350 million).

figure - More Bond Measures Have Been Proposed and Approved Since the Passage of Prop 39

The vote on Measure EE will be important for LAUSD—the resources that the parcel tax would generate are critical to the district’s future finances. The vote will also be worth watching with the pending constitutional amendment in mind. If the measure is approved, lawmakers may see less need for lowering the parcel tax threshold. If it is defeated, the amendment may gain momentum.

Testimony: Water Supply and Quality Challenges in the San Joaquin Valley

Ellen Hanak, director of the PPIC Water Policy Center, testified today (April 30, 2019) before the Assembly Subcommittee on Water, Parks and Wildlife, at a hearing on balancing water needs into the future in the San Joaquin Valley. Here are her prepared remarks. View her presentation.

The San Joaquin Valley produces more than half of California’s agricultural output. Irrigated farming is the region’s main economic driver and predomi­nant water user. The region is also ground zero for many of the state’s most difficult water management problems―including long-term depletion of groundwater reserves, lack of safe drinking water in many rural communities, and accumulation of a variety of groundwater contaminants.

Over the past three years, the PPIC Water Policy Center has worked with an interdisciplinary team of researchers from Fresno State, Point Blue Conservation Science, UC Davis, and UC Merced to examine these challenges and identify promising solutions. Today, I’ll provide you with some highlights from our latest report, Water and the Future of the San Joaquin Valley, including areas where the California Legislature can be most helpful in facilitating progress. Two of my coauthors on this study—Sarge Green from Fresno State and Thomas Harter from UC Davis—are also here to answer your questions.

I’ll touch on four priority areas for action: balancing water supplies and demands; ensuring safe and reliable drinking water supplies; managing groundwater quality for the long-term; and fostering beneficial water and land use transitions.

Balancing water supplies and demands

Chronic groundwater overdraft—pumping in excess of the amount that is replenished—averages nearly 2 million acre-feet per year in the San Joaquin Valley, or roughly 11 percent of the region’s net water use. The consequences include dry wells, sinking lands, damaged infrastructure, and reduced reserves to cope with future droughts.

In light of these problems, the valley is on a fast track to implement the Sustainable Groundwater Management Act (SGMA), which requires groundwater users to bring water supplies and demands into balance by the 2040s. The first local sustainability plans must be finalized and launched in early 2020.  Although attaining balance will benefit the valley’s economy over the long-term, it will entail some near-term costs.

To end overdraft, local groundwater sustainability agencies (GSAs) will have to augment supplies, reduce demands, or use some combination of these approaches. We estimate that about a quarter of the historical deficit can be filled with new supplies at prices farmers can afford.  The balance will likely need to be met by managing farm water demand—with the idling of at least 500,000 acres of irrigated cropland (about 10% of current acreage).

On the supply side, the most promising options are to capture and store more local runoff in groundwater basins, and to increase water imports by managing the system differently. On the demand side, increasing water trading—both within and across groundwater basins—can significantly mitigate the economic impacts of reducing water use, by allowing farmers to maintain the crops that generate the most revenue, GDP, and jobs. Reducing overdraft gradually between now and 2040—the “glide path” approach to implementing SGMA—can also lessen the costs of adjustment by giving farmers more time to adapt.

Priority actions to facilitate the adoption of an optimal supply and demand portfolio approach include:

  • Assessing which new infrastructure investments—including conveyance—are warranted to support more recharge and water trading.
  • Incentivizing recharge on farmland—one of the most cost-effective ways to store water.
  • Developing transparent and equitable local water trading rules, including for groundwater.
  • Clarifying how much additional high winter and spring runoff is available for recharge.
  • Facilitating state and federal approvals for water trading and groundwater banking projects.
  • Coordinating both within and across groundwater basins to maximize benefits.

Although local and regional water users and agencies will need to take the lead on many of these actions, both the state and federal governments can play vital roles. The state can be especially helpful in clarifying how much water is available for recharge, facilitating approvals for water trading and groundwater banking projects, and working with local partners to assess infrastructure needs.

Ensuring safe and reliable drinking water

The valley’s most urgent water issue is addressing chronic problems of unsafe and unreliable drinking water in rural communities, most of which rely on groundwater. The region is a hot spot for unsafe drinking water. With just 10 percent of the state’s population, it is home to more than half of all community water systems that have persistently contaminated tap water. Contamination is also a problem for very small water systems that are regulated by counties and for homes served by domestic wells. Some groundwater contaminants—such as arsenic and uranium—occur naturally. Others are caused by human activity. For instance, agriculture is the primary source of nitrate, a serious contaminant that is widely present in shallow wells.

The region is also a hot spot for unreliable drinking water supplies in communities that depend on shallow wells. During the latest drought, roughly half of the 150 small water systems that sought emergency assistance from the state were in the valley, as were nearly 80 percent of all residents who reported dry domestic wells. Without concerted action, this vulnerability will persist. Several thousand additional drinking water wells are vulnerable if groundwater levels fall another 30 feet—something that could easily happen during the next drought, or if local groundwater sustainability plans allow continued overdraft under a glide path approach and fail to mitigate the problem.

In recent years, various legal and administrative changes have helped address the drinking water crisis. But there is still an urgent need to build a robust, comprehensive framework for tackling it. Affected communities will require technical, financial, and managerial assistance. Here are some top priorities:

  • Consolidating or aggregating systems to provide economies of scale to small water systems.
  • Providing technical support.
  • Planning for shortages and developing rapid response procedures to mitigate dry wells.
  • Ensuring funding support for both capital investments and ongoing operations and maintenance.

A variety of local parties—including counties, urban water suppliers, irrigation districts, groundwater sustainability agencies, pollution dischargers, and NGOs—will need to play a major role in helping to address this problem. But the state must take leadership in developing funding solutions and ensuring there’s a comprehensive plan for addressing both quality and supply vulnerabilities in a timely manner.

Managing groundwater quality for the long-term

Valley farmers and other dischargers of contaminants must also meet new requirements for protecting groundwater and soils from the long-term buildup of nitrate and salts. California has been a national leader in seeking to address these problems, with a suite of new regulations adopted over the past decade. The Salt and Nitrate Control Program (SNCP)—adopted by the Central Valley Regional Water Quality Control Board in 2018 and pending approval by the State Water Board—provides an umbrella framework for addressing these challenges. SGMA also requires GSAs to protect water quality while balancing groundwater supplies and demands.

Nitrate in drinking water wells, which originates primarily from inorganic nitrogen fertilizer and manure used in farming, poses significant public health risks. Dairies face special challenges in managing manure efficiently, and solutions have remained elusive.

Salinity is a growing threat to local agricultural productivity. Roughly 250,000 acres of cropland have already been retired due to salinity in soils, and another 1.5 million acres are considered impaired.

But managing for these contaminants is costly. The SCNP seeks to find a balance between protecting water and land resources for the long run and maintaining the viability of agricultural production in the present, while also ensuring safe drinking water solutions.

Here are some top priorities for action:

  • Coordinating water quality and quantity management. This will be especially important for managing groundwater recharge, which under some circumstances can accelerate the migration of chemicals in the soil (especially nitrate) into the aquifer and impair drinking water quality, at least for a time.
  • Implementing new technologies to manage pollutants. This will be especially important for dairies, which need to remove excess manure and transform it for other uses.
  • Providing regulatory flexibility. This includes flexibility to allow some continued loading of nitrogen and salt as long as impacts on drinking water supplies are mitigated, as proposed under the SNCP.

While local water managers, farmers, and the agricultural industry will need to take the lead in addressing these issues on the ground, the state can play a major role in providing effective and responsible regulatory flexibility, and in supporting research and development (R&D).

Fostering beneficial water and land use transitions

Finally, the valley will need to plan for and manage the changing landscape as some cropland is idled—both to avoid negative consequences from dust, pests, and weeds, and to get the most value from these lands in other uses. Pursuing approaches that seek multiple benefits on this land can support the regional economy, public health, and the environment. There are numerous stewardship options: healthy soils, habitat, wildlife-friendly solar, recharge, flood protection, and recreation.

There are already some models of how this can work. For instance, the Kern Water Bank provides thousands of acres of upland habitat for San Joaquin desert species and abundant intermittent wetlands, while also serving as a major groundwater storage site. But to date, there is no serious planning effort to see how lands coming out of production might be used most productively, and how to provide the right incentives to realize this potential.

Here are some top priorities for action:

  • Initiating broad-based, inclusive planning. For many issues—ranging from determining the best areas for habitat investments to coordinating recharge and managing salinity—taking a valley-wide perspective will be key.
  • Implementing flexible regulatory approaches to make it easier to implement multi-benefit restoration projects.
  • Providing incentives and funding to support activities on the ground.
  • Boosting technical support and R&D.

Again, local and regional parties will need to take the lead on many aspects of this work. But state and federal agencies can facilitate good outcomes by providing regulatory flexibility, financial incentives, and support for technical assistance and R&D.

How can the Legislature be most helpful now?

The valley is at a pivotal moment, and there are many ways in which the state can assist the region’s residents implement efficient, equitable, and sustainable solutions to their water-related challenges. Here are some final thoughts on how the Legislature can be most helpful in the near-term:

First, ensure a robust, comprehensive framework for safe and reliable drinking water solutions. This is an urgent public health issue and needs urgent attention. The framework should include reliable funding, as well as a sound, timely approach to providing technical and managerial solutions on the ground.

Second, support the building blocks for the region’s transition to groundwater sustainability. Planning for sustainable groundwater management is well underway, but this transition won’t happen overnight. Early actions to promote forward momentum will be especially valuable in the next few years.

To create the preconditions for success, the state should accelerate its own efforts to provide regulatory clarity, consistency, and flexibility. Key areas include how much water is available for recharge, how to recharge in ways that are acceptable from a water quality perspective, and how to implement broad-based, multi-benefit restoration projects that put land coming out of production to best use.

Support for local and regional initiatives can also make a difference. Key areas include assistance with the assessment of smart infrastructure investments, pilot efforts to implement innovative approaches on the ground, technical support and R&D for water quality and land stewardship solutions, and broad-based planning to develop regional approaches for multi-benefit management of water and land.

California has long been a model for others in the management of natural resources. Many are now looking to see how we tackle the tough challenges of providing safe drinking water to all residents and managing our groundwater resources sustainably for the long term. The San Joaquin Valley is on the front line for addressing both of these challenges. The region’s farmers and residents have a history of creatively adapting to difficult and changing conditions, and constructive solutions are in reach. The state can provide vital support to help ensure success.

Video: Emergency Department Use in California

Hospital emergency departments (EDs) are an important part of California’s health care system. They are sometimes called the safety net of the safety net because they provide care to all comers. Policymakers, health plans, and health providers have long focused on ED use, partly because it serves as a proxy for lack of access to other, less costly forms of health care. So how has the expansion of insurance coverage under the Affordable Care Act (ACA) affected ED use in California? At an event last week in Sacramento, PPIC researcher Shannon McConville outlined a new PPIC report that addresses this question, and a panel of experts offered their perspectives on recent ED trends.

While many predicted that coverage expansion would reduce ED use by providing access to other kinds of medical care, such as primary care physicians, some worried that because insurance coverage typically reduces patients’ out-of-pocket costs, the ACA would increase ED use. The good news is that the PPIC report estimates that ED use rates would be higher in the absence of the ACA. But ED use statewide has been increasing for the past decade. To get a sense of how recent trends in ED use are being experienced and addressed around the state, PPIC convened a panel of experts.

All of the panelists highlighted the importance of finding out why people are using EDs. Some frequent ED users may not know about other ways to get medical care, while others may have behavioral or mental health issues that could be addressed more effectively by other kinds of care—from housing assistance to substance abuse programs. As Sara Kate Levin, medical director for Contra Costa Health Services, put it, “What are the unmet social needs that are driving a lot of this high utilization?”

But filling information gaps and addressing behavioral and mental health issues does not solve all ED use problems. In many areas, there is a scarcity of primary care doctors and urgent care clinics, and many patients cannot take time off to go to medical appointments during the workday. Moreover, primary care doctors sometimes refer their privately insured patients to EDs, in part so they won’t have to wait for tests.

This range of issues points to what Renee Hsia, an ED physician at Zuckerberg San Francisco General Hospital and a professor of emergency medicine and health policy, called “the elephant in the room”: because the United States has “a very market-based approach to health care,” there are two very different stories about ED use. On the one hand, EDs in affluent areas broadcast their availability and convenience. On the other hand, there are long waits for treatment at EDs serving low-income areas. “In some areas, your ER is a revenue center . . . and in some places, where you don’t have paying patients, your ER is a cost center.”

Jennifer Rasmussen, vice president of health care services at Molina Healthcare of California, highlighted the geographical differences across the state that make it difficult to find “one size fits all” solutions. She pointed out that Molina serves Imperial and San Bernardino Counties, “a vast geography” with fewer social services than a dense urban area has to offer. In other words, “a solution for Imperial County is not going to be the same as a solution for San Francisco.”

New Approaches for the PPIC Statewide Survey

As the polling world knows, times—and survey methods—are changing. The rise of cell phones and decline in landline use has had an enormous effect on telephone polling methods. So have internet surveys. The PPIC Statewide Survey has kept abreast of these changes, evaluating and incorporating best practices throughout our 20-plus years in the business. The most recent update involves using online polling techniques for our next survey.

Online polling was initially viewed with great skepticism by experts in the field. However, significant progress has been made in this area. Today, a rigorous online survey using a random probability sample is widely accepted as an alternative to a rigorous live telephone survey using a random probability sample. Our research into this methodology—including extensive conversations with colleagues at peer organizations who are also using online and live telephone surveys, such as the Kaiser Family Foundation, Langer Research Associates, and the Pew Research Center—has provided us with strong assurances of quality.

Last fall, we conducted a simultaneous online and telephone poll to compare our results. We found that the online method we chose yielded results with the same high quality as our telephone polling (which includes both landline and cellphone participants).

This spring, we are conducting our first fully online-only survey, on the topic of Californians and education. This method will allow us to delve into more issues and in greater depth than we do in a live telephone survey. We are excited about this approach and looking forward to the results.

At the same time, the PPIC Statewide Survey will continue to rely on landline and cellphone polling techniques for the bulk of our work for the forseeable future, given the current limits in random probability samples for large online surveys in California and the reliability and proven track record of live telephone surveys.

As we move toward new frontiers, our survey methods will always place quality first and be completely transparent, with clear methodological explanations and detailed results available on our website. Most important, we will continue to provide a voice for all Californians—voters and nonvoters alike—raising awareness, encouraging discussion, and informing policymakers on critical issues of the day.

Californians and Their Tax Burden

It’s April 15—the perfect day to explore how Californians feel about the state and local tax system and how much they pay in taxes. According to the most recent PPIC Statewide Survey, seven in ten Californians believe that California currently ranks near the top (48%) or above average (22%) in state and local tax burden per capita. The public’s perception is somewhat in line with fiscal facts: California’s state and local tax collections per capita in 2015 were 10th-highest in the nation (Tax Policy Center, September 2018).

Notably, Republicans (65%) are much more likely than Democrats (47%) and independents (48%) to say California’s state and local tax burden is near the top. The share of Californians expressing this view increases with rising income (39% under $40,000, 52% $40,000 to $80,000, 61% $80,000 or more) and this view is more common among whites (57%) than among other racial/ethnic groups (47% Asian Americans, 44% African Americans, 38% Latinos).

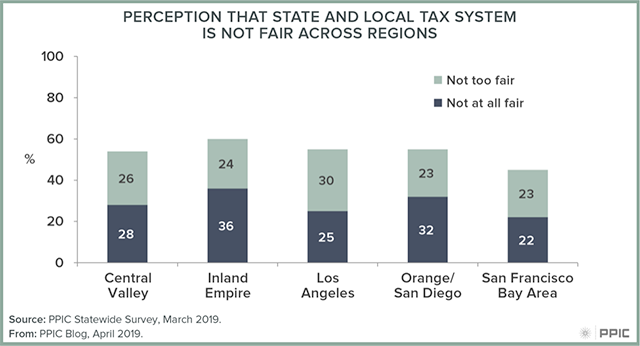
Half of Californians (52%)—a record-high share—say that the state and local tax system is either not too fair (25%) or not at all fair (27%). This marks a 10-point increase since March 2017 and a 21-point increase since the first time we asked this question in June 2003. There are notable differences along partisan lines. More than two in three Republicans (69%) see the state and local tax system as not too or not at all fair, as do nearly six in ten independents (58%), compared to about four in ten Democrats (43%).

The belief that the system is not fair is widely held across regions, ranging from a high of 60% in the Inland Empire to 45% in the San Francisco Bay Area. Lower-income adults (46%) are somewhat less likely than more-affluent adults (60% $40,000 to $80,000, 54% $80,000 or more) to say that the current state and local tax system is not fair.

Figure 1: Perception That State and Local Tax System is Not Fair Across Regions

A record-tying 60% of Californians say they pay much more (39%) or somewhat more (21%) than they should in state and local taxes. The share saying they pay much more than they should is a record high and has increased 13 points since we first asked this question in February 2003. This view is widely held across regions and demographic groups. Notably, Republicans (61%) are more than twice as likely as Democrats (25%) and much more likely than independents (42%) to say they pay much more than they should.

Figure 2 - Shares Saying They Pay Much More in State and Local Taxes Than They Should

That said, California voters have passed tax increases in recent years, including extending the Proposition 30 income tax increases in 2016 and rebuffing an effort to repeal the recently passed increase to the state gas tax in 2018. Further, voters across the state have been more than willing to pass local tax measures. With a new governor and a supermajority of Democrats in the state legislature, are new taxes on the horizon? Stay tuned as the PPIC Statewide Survey gauges public support for any new proposals.

Video: Californians and Their Government

Californians are increasingly concerned about the cost of housing—a record-high share see affordability as a big problem in their region, and a majority support Governor Newsom’s proposal to put $1.8 billion toward increasing housing production. Dean Bonner outlined these and other key findings of the latest PPIC Statewide Survey at a Sacramento briefing last week.

This month’s survey gauges views on statewide challenges and the governor’s proposals for addressing them. For example, in the wake of last year’s historically destructive wildfires, an overwhelming majority of Californians support the governor’s plan to spend $415 million on wildfire preparedness and forest management. About two-thirds say the gap between rich and poor is widening in their part of the state, and a solid majority favor the governor’s proposal to allocate a billion to expand eligibility for the earned income tax credit.

Other survey highlights:

  • Slim majorities support the governor’s plan to scale back two major infrastructure projects: high-speed rail and the Sacramento–San Joaquin tunnels.
  • When asked whether the penalty for first-degree murder should be death or imprisonment for life with no chance of parole, a record-high 62% of Californians choose life imprisonment.
  • An overwhelming majority oppose President Trump’s declaration of a national emergency over the border wall—but support for the declaration is much higher among Republicans.
  • A majority of residents have a favorable view of the Affordable Care Act and most say that Covered California, the state’s health insurance exchange, has been working well.

A Closer Look at Women’s Arrest Rates

Historically, men have been arrested at much higher rates than women in California. However, a recent PPIC report found that while arrest rates declined for both men and women, they dropped significantly more for men than for women (57% and 13%, respectively) between 1980 and 2016. A closer look at gender breakdowns underscores some differences in arrest offenses of men and women—and suggests that they may be differently affected by criminal justice reforms.

Women are still arrested at significantly lower rates than men (1,603 arrests per 100,000 female residents in 2016, compared to 5,270 arrests per 100,000 male residents), but they now represent a larger share of total arrests statewide than they did in 1980, up from about 13% to almost 24%. A closer look reveals they also tend to be arrested for different types of offenses. Relative to their overall share of arrests, women represented a disproportionate share of arrests for property offenses (32%), compared to 23% of arrests for violent offenses and 22% for drug offenses. In stark contrast, women only make up about 7% of felony weapons arrests.

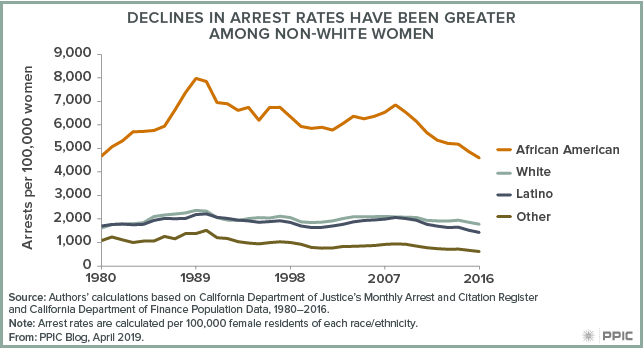
A look at trends in female arrest rates by race/ethnicity shows a decline for women of all races, with greater declines among non-white women. Between 1989—when overall arrest rates peaked—and 2016, arrest rates fell more dramatically for men than for women across all races/ethnicities, but the size of the gender gap varied:

  • Arrest rates for white women fell 25%, while arrest rates for white men fell 55%.
  • Arrest rates among Latino women declined by 35%, while rates for Latino men fell 68%.
  • Rates for African American women fell 42%, while rates for African American men fell 58%.

figure - Declines in Arrest Rates Have Been Greater Among Non-white Women

These differing trends are mostly driven by misdemeanor arrest rates, which have declined much more dramatically among men than among women. In 1980, women represented 14% of misdemeanor arrests, but in 2016 this share jumped to 25%, in part due to an increase in female arrest rates for misdemeanor assault and battery offenses. The female share of felony arrests also increased, up from roughly 12% in 1980 to almost 20% in 2016.

While many factors likely contribute to these trends, California’s criminal justice reforms—which have largely focused on property and drug offenses—are likely to have played a role, with different effects on arrests of men and women. Not surprisingly, given gender differences in arrest offenses, the data supports this. For instance, after Proposition 47 reclassified several drug and property offenses from felonies to misdemeanors in November 2014, the female arrest rate for drug offenses declined by 14% and the rate for property offenses fell by 22%, compared to 7% and 10% declines among men. Policymakers would do well to monitor arrest rates for men and women and keep them in mind when considering the impact of criminal justice reforms.

Video: Preparing California for Census 2020

Is California ready for the 2020 Census? PPIC convened a group of experts last week for a progress report on preparations for the decennial population count, which begins next April 1. PPIC president Mark Baldassare started off by asking California secretary of state Alex Padilla to outline what is at stake.

Padilla offered a “quick civics lesson,” explaining that the census helps determine the amount of federal funding that goes to each state, as well as each state’s overall number of congressional seats and its configuration of legislative districts. If there’s an undercount in California, the state could lose billions of dollars over the next decade.

Are we ready? “Not yet,” Padilla answered. But he added that California is “a little ahead of the curve,” with the highest level of state investment in outreach and preparation in the nation. In addition to longstanding challenges—for example, California has 30% of the recognized “hard to count” communities nationwide—the state faces some new issues, such as inadequate federal funding, cybersecurity issues, a rule that bars legal permanent residents from working as canvassers, and the possible inclusion of a question about citizenship.

How is the state preparing? Marc Berman, a state assemblymember and chair of the Assembly Select Committee on the Census, outlined three major areas of focus: adequate funding, coordination of efforts, and collaboration by state and local government as well as community-based, philanthropic, and business organizations. “We are better prepared than we ever have been before,” he added.

Ditas Katague, director of California Complete Count, offered a wealth of detail on the progress her office has made—opening five field offices, dividing the state into ten regions based on hard-to-count populations, and working with community groups and media in these regions.

Non-governmental groups are playing a key role. Melina Sanchez, the program officer for civic participation initiatives at the James Irvine Foundation, outlined the two overarching goals of a recently convened statewide philanthropic roundtable: to help California reach its hardest-to-count populations and to use the census as a movement-building opportunity for historically underrepresented groups. For Sanchez, it is important to “flip the narrative” so that it’s not about people’s fear of participating in the census but is instead a story about “folks feeling the empowerment of standing up despite all the barriers.”

Sarah Bohn, PPIC’s director of research, highlighted the need to counteract widespread mistrust of government, concerns about privacy and misuse of data, and mistaken ideas about the purpose of the census. A key way to motivate most people, she added, is to make sure they know that their community benefits from an accurate count: “Understanding the funding that goes to your community . . . really seems to encourage participation.”

What would a successful census look like? Katague summed it up: “No undercount, no loss of a congressional seat, no disinformation snafus”—and, on the positive side, increased civic engagement.

Testimony: Special Education Finance in California

Paul Warren, research associate at PPIC, testified today (March 28, 2019) before the Senate Education Budget Subcommittee, as part of a hearing on district financial conditions. Here are his prepared remarks.

The committee asked PPIC to help them understand why district special education costs are rising so quickly.

First, some background. The AB 602 formula provides about $500–600 in state special education funds per student in each district, based on average daily attendance (ADA). The number of students with disabilities in a district does not affect state funding amounts. Each year, that amount is increased by the change in ADA and by a cost-of-living adjustment.

In the PPIC report, Special Education Finance in California, my colleagues and I identified several reasons why AB 602 funding has not kept pace with district costs:

  • Changes in the rate and type of disabilities. We estimated that these changes increased annual district costs by around $1.1 billion. The state formula is currently based on average district costs from the late 1990s.
    • The share of students identified with disabilities increased by 5.7 percent from 2010–11 to 2015–16.
    • Disabilities that are, on average, expensive to address have increased. Autism, in particular, continues to increase as a share of students with disabilities.
  • Growth in preschool for children with disabilities under the age of 5. This population grew about 10 percent from 2005 to 2015. The AB 602 formula does not adjust district funding for changes in this group, as pre-school children with disabilities do not count toward ADA.
  • Higher district salaries since the Great Recession. The large LCFF increases during the economic recovery shaped salary negotiations. But AB 602 did not adjust to the higher costs for special education teachers and administrators.

In a report from last year, Revisiting Finance and Governance Issues in Special Education, we provide two options for modifying the AB 602 formula:

  • Increase AB 602 by the same percentage amount as LCFF funding. This makes sure that state funding for special education increases at the same rate as LCFF.
  • Increase AB 602 by the actual increase in special education costs. This would hold the state share of special education costs constant over time.

We also recommend caution when considering proposals to base state special education funding on counts of students with disabilities. Differences in district identification practices affect the share of students identified for special education services. We found that the county with the lowest rate of students with disabilities reported that about 8.8 percent of students were in special education. In contrast, the county with the highest rate reported that about 17.6 percent of students were in the program. This disparity strongly suggests that district practices affect district caseloads, and basing state funding on the number of students with disabilities could create financial incentives to identify more students.

Our two options would avoid this identification problem while better aligning state funding for special education with LCFF and district costs.

Thank you for the opportunity to discuss these important issues.

Video: A Conversation with San Francisco Mayor London Breed

As part of our Speaker Series on California’s Future, PPIC invites elected leaders from across the political spectrum to participate in public conversations. The purpose is to give Californians a better understanding of how our leaders are addressing the challenges facing our state.

As a mayoral candidate, London Breed promised to focus on homelessness and affordable housing—two major challenges for San Francisco and for California as a whole. Not surprisingly, these issues took center stage in her conversation with PPIC president Mark Baldassare earlier this week.

“It is no secret that homelessness is one of the biggest challenges that’s facing our city, and that also comes with the need to build more housing,” said Breed. “I’ve been on a mission! I hired a housing delivery director—someone whose sole purpose is to cut back on bureaucratic red tape that gets in the way of building housing.”

Breed stressed the need for new approaches to behavioral health issues that complicate homelessness: “We have to think about this challenge differently and we have to make hard decisions.” For example, she favors strengthening conservatorship laws. She acknowledged that conservatorship for mentally ill adults is “very controversial.” But, she added, “our jails are being used as mental health facilities, and that’s not a solution.” She is also pushing for safe injection sites, which can provide substance abuse treatment when people are ready to seek it. “Treatment on demand is something we have to start looking at.”

The mayor is also committed to trying new strategies in other policy areas, such as police-community relations and education. “I do think we need to take some risks and propose some things that may make people uncomfortable but ultimately may help us to get the kind of results that will . . . make a difference.”

But Breed also emphasized accountability. Explaining why she wants to hire a mental health director, she said, “We’re a little bit all over the place right now and I want us to address those issues, organize things a lot better for the purposes of helping people.” In this and other areas, she said, “I want to see us make the right investments.”