Federal Immigration Proposal Could Have Widespread Impact

The Department of Homeland Security (DHS) has recently proposed changing how it decides whether a person is or will likely become dependent on government assistance. If implemented, this change would make it harder for immigrants to meet the government’s standard of self-sufficiency—and may deter them and others from using government services for which they are eligible. Through December 10, DHS is requesting public comments on the proposal, which could potentially have wide-ranging impacts on California and its large immigrant population.

The federal government can typically deny applications for green cards or entry into the United States to people who are or will likely become “public charges,” i.e., dependent on government assistance. Under current guidance, DHS considers an immigrant a public charge if they receive more than half of their income from cash assistance—which includes TANF (known as CalWORKs in California), General Assistance (GA), and Supplemental Security Income (SSI)—or are in government-funded, long-term institutional care (like a nursing home).

The proposed rule is much broader: it defines dependence as receiving more than about $1,800 (for 2018) in assistance from not only the current programs but also the food assistance program SNAP (CalFresh) and/or Section 8 housing vouchers and rental assistance. DHS also proposes that an income of less than 125% of the federal poverty level ($25,100 in 2018 for a family of four) would be a strong predictor of becoming a public charge and recommends length of enrollment in certain health programs as another factor to consider.

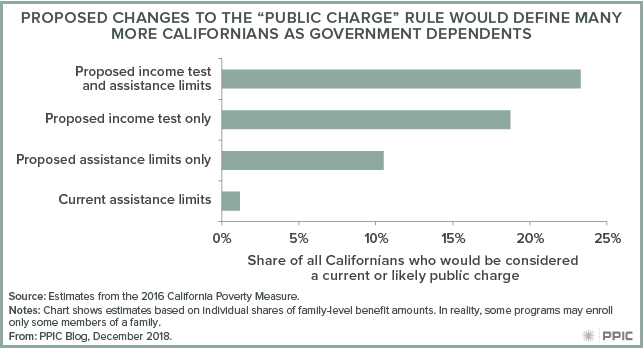
How big of a change is this? While data aren’t available to examine safety net participation among the noncitizens whose immigration cases would be affected by the rule, we estimate that even before including health programs, as many as 23% of all Californians would be considered public charges, or likely to become so—which gives a sense of how broad the proposed rule is. Some 18.7% of Californians would be considered likely to become public charges based on their income level alone. By contrast, at most 1.2% of all Californians receive more than half their income from CalWORKs, GA, and SSI, and would be considered public charges under the current rule. These calculations are based on the California Poverty Measure (CPM), a joint effort of PPIC and the Stanford Center on Poverty and Inequality.
California has more immigrants than any other state—and hence much at stake. For those on visas, the proposed rule would make it harder to qualify for a green card or extend their stay. But in practice, the largest impact would likely be on immigrants and their families who, purely out of caution, forego safety net benefits for which they are eligible. DHS cites this sort of disenrollment as a source of long-term savings—but notes that these savings are liable to be offset by worse public health outcomes and increased poverty rates. Based on studies of welfare reform in the 1990s, the UCLA Center for Health Policy Research estimates that if the rule change takes place, 15% to 35% of families with noncitizens might disenroll from safety net programs. At the high end, as many as 765,000 people could disenroll from CalFresh and Medi-Cal, leading to around $1 billion less in federal aid to California each year.

California’s attorney general and some local governments have already voiced their opposition to the proposed changes, which come at a time when the state has been expanding access to health and social safety net programs. Reduced participation in these programs, whether from reasonable or unnecessary caution, would directly counteract the state’s efforts to reduce poverty. Public comment for the proposal closes on December 10.

2020 Census: Counting the Sacramento Area

The decennial census plays an essential role in American democracy. Our series of blog posts examines what’s at stake for California and the challenges facing the 2020 Census, including communities that are at risk of being undercounted.  

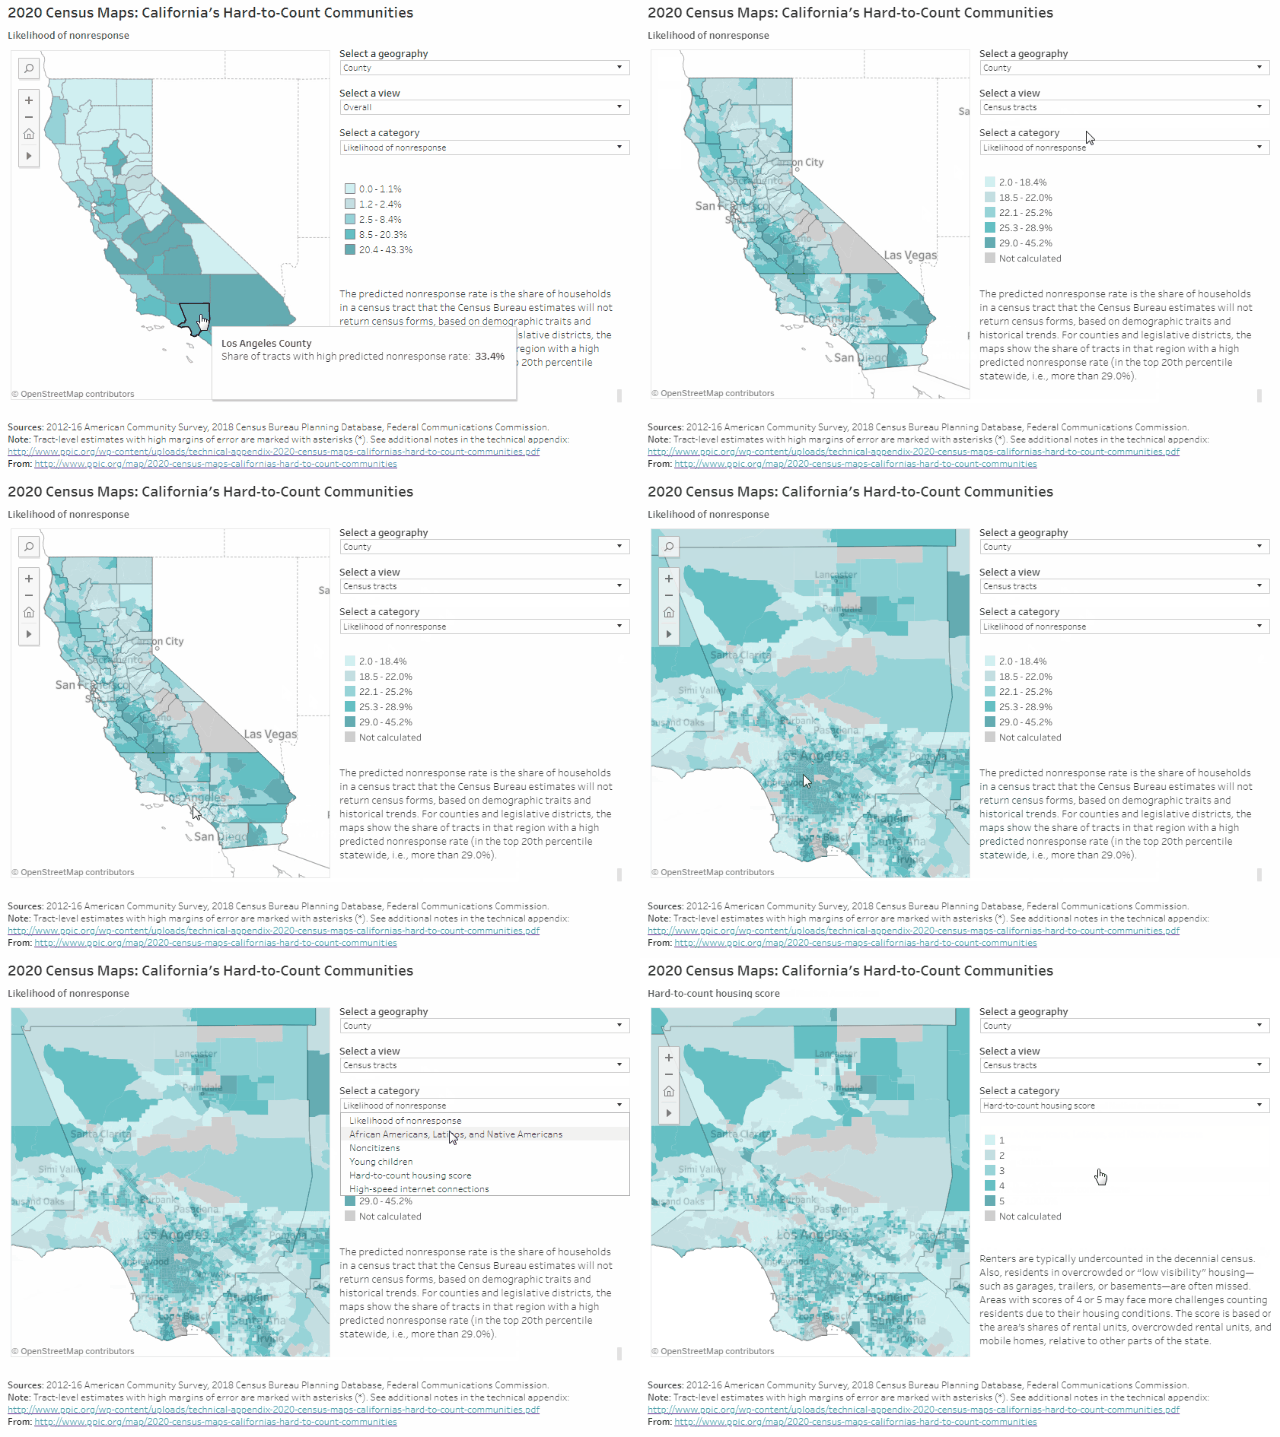
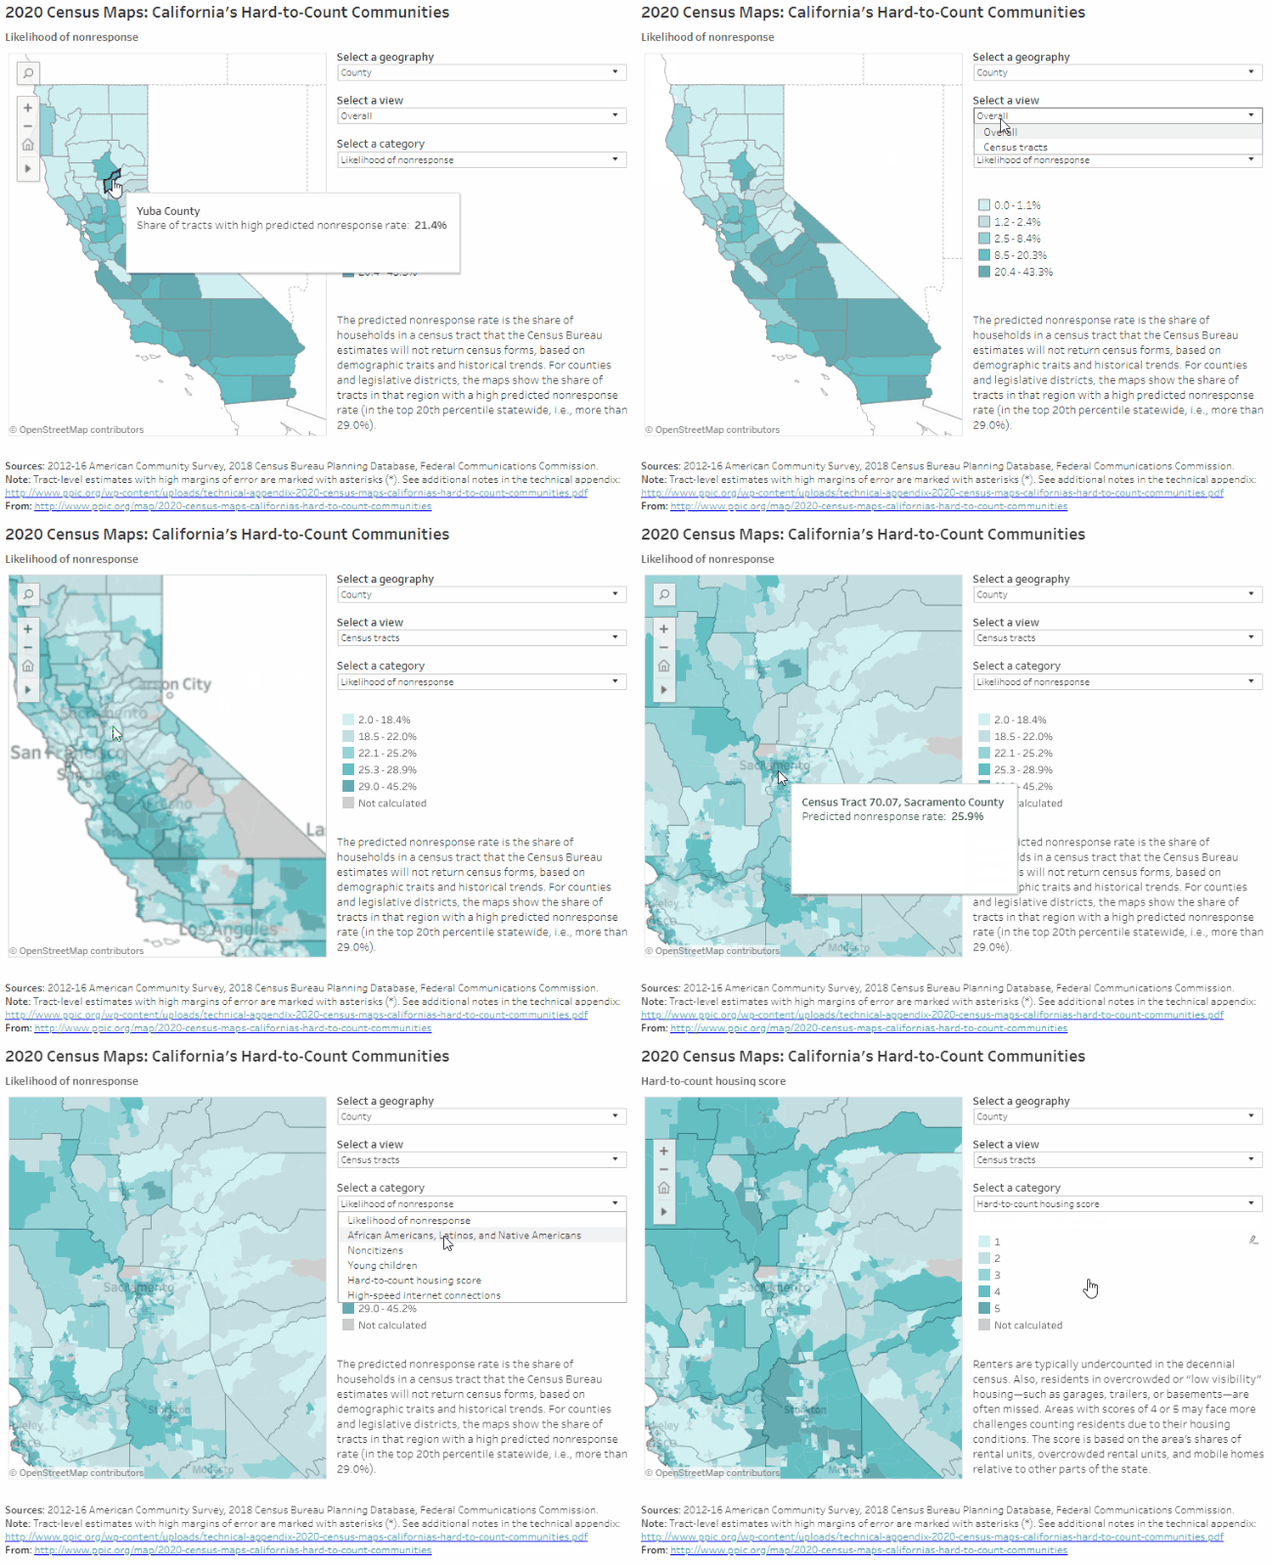
PPIC’s interactive census maps are an important tool for Californians working to ensure an accurate census count. Using estimates from the Census Bureau and the Federal Communications Commission, they highlight hard-to-count communities across the state and pinpoint reasons why certain areas may be hard to reach.

Home to about 2.5 million people, the Sacramento area includes the counties of El Dorado, Placer, Sutter, Yolo, and Yuba, in addition to Sacramento. Within this region, Yuba has the highest share of very hard-to-count areas (21%)—in the top fifth of hardest-to-count counties across the state—and Sacramento has the second highest (10%). Households in these very hard-to-count areas are less likely to respond initially to census forms and are therefore at risk of being undercounted, according to Census Bureau estimates that draw on local demographic characteristics (e.g., race/ethnicity, age, citizenship, and housing conditions) and historical trends.

Some highlights:

  • Legislative districts that include the fast-growing city of Sacramento will likely be the hardest to count. In Congressional District 6 (Matsui), Senate District 6 (Pan), and Assembly District 7 (McCarty), between 14% and 19% of neighborhoods are considered very hard to count. Other legislative districts in the region tend to cover more suburban or rural areas and have much smaller shares of very hard-to-count communities.
  • There are small pockets of hard-to-reach areas across the region. Within Sacramento County, hard-to-reach areas are concentrated in the city of Sacramento, as well as around Rancho Cordova and Folsom. In some neighborhoods, 30% or more of households are predicted to not respond initially to the census. Other relatively hard-to-reach areas include Yuba City and Marysville at the border of Sutter and Yuba Counties, Davis and Woodland in Yolo County, and the eastern border of Placer and El Dorado Counties, directly north and south of Lake Tahoe.
  • Local population trends can help guide effective outreach. African Americans, Latinos, and Native Americans have historically been undercounted in the census. Overall, these groups make up a lower share of the population in the Sacramento area compared to the rest of the state. However, in much of the city of Sacramento, around Woodland and northwest Yolo County, and in South Yuba City and northeastern Sutter County, more than half of residents are from historically undercounted communities—primarily African American and Latino. Some of these areas have relatively high shares of noncitizens as well. Noncitizens may be less likely to respond to the 2020 Census because of the planned addition of a citizenship question and concerns about deportation and privacy.
  • Parts of the Sacramento area have high shares of young children. Young children are historically underrepresented in the census. In census tracts in the eastern parts of Sutter County and southern Yuba County, in the city of Sacramento and surrounding suburbs, and the southwestern tip of Placer County, 9% or more of residents are children under five years old, compared to 6.5% statewide.
  • Housing conditions may make an accurate count challenging. High shares of rentals, overcrowded rental units, and mobile homes can make it more difficult to count residents accurately. Around Yuba City and Marysville, all of these factors are prevalent: in some neighborhoods, more than 65% of housing units are rented, about a quarter of those are overcrowded, and 15% of households live in mobile homes. In the city of Sacramento, housing conditions vary, with some neighborhoods seeing high rates of overcrowding but low rates of mobile homes, while others see the reverse. Reaching residents in nontraditional housing will be critical to an accurate count—and will depend on local knowledge of how families make ends meet.
  • Limited internet access may be an issue in rural areas throughout the region. The Census Bureau plans to collect the majority of responses online in 2020—a change from previous practice. Each county in the region has some census tracts with minimal residential high-speed connectivity, with the lowest access outside of the city of Sacramento, Lake Tahoe, Yuba City, and Marysville. Outside of these areas, it may be harder to collect responses online, and participation will rely more heavily on in-person census takers or internet provided by local institutions.

We hope these maps serve as a starting point to help local, regional, and state leaders think about which activities, resources, and partnerships—including language assistance, awareness raising, and community outreach—might be most effective for accurately counting different parts of California. Stay tuned for future posts that examine hard-to-count communities in other regions of the state.


Californians’ Priorities for the Next Governor

Mark Baldassare, PPIC president and CEO and director of the PPIC Statewide Survey, spoke to the Sacramento Press Club on November 19, 2018 in a post-election discussion with Mark DiCamillo, director of the Berkeley IGS Poll. Here are his prepared remarks.

While we are still counting votes in California, the 2018 election can be called a sweeping success for Democratic candidates in the statewide races. Democrats also won the coveted two-thirds majorities in the state senate and state assembly, and increased their dominance of the California congressional delegation. The Republican Party’s efforts to stem their losses by getting behind what they hoped would be a popular gasoline tax repeal stalled as Proposition 6 fell short (57% no).

In the governor’s race, Democrat Gavin Newsom defeated Republican John Cox by a double-digit margin that was similar to the re-election win of Governor Jerry Brown over Neil Kashkari in 2014 (60% to 40%). Newsom was the leader in eight PPIC Statewide Surveys on the governor’s race conducted since last December. Cox surged to second place after President Trump endorsed him in the June primary, but he was unable to expand his base much beyond the president’s approval rating (39%, October PPIC survey).

What are Californians’ priorities for Governor-elect Newsom? California voters mentioned health care, immigration, the economy, the environment, and gun policy when asked to choose the most important issues facing the country in the exit polls (CNN poll, Fox poll). This list covers most, though not all, of the most important state issues mentioned in 2018 PPIC surveys. It also offers a good starting point for identifying issues that will shape the Newsom era. Here is what the 2018 PPIC surveys have to say about each one:

Health Care. A record-high 59 percent of Californians have a favorable view of the Affordable Care Act (ACA) in the October PPIC survey. While 65 percent think it is the responsibility of the federal government to make sure that all Americans have health coverage, just 34 percent say it should be provided via a single government program instead of the current mix of private and public programs. While 64 percent of adults favor a single-payer state government health plan, support drops to 41 percent if it means raising taxes, according to the May PPIC survey. In the wake of ACA repeal and replace efforts, California’s health insurance exchange and MediCal expansion seem to be generating more public support, while the desire for wholesale change are tempered by concerns about choices and costs.

Immigration. Seventy-four percent of Californians believe that immigrants are a benefit to the state, while 85 percent say that there should be a way for undocumented immigrants to stay in the country legally, according to the May PPIC survey. About three in four (74%) oppose building a wall along the border with Mexico in the October PPIC survey. Nearly six in 10 (58%) favor state and local governments taking action, separate from the federal government, to protect the legal rights of undocumented immigrants in California in the October PPIC survey. Given the large immigrant population and strongly held public views, the next governor will be expected to lead the resistance against federal policies.

The Economy. About half of Californians say they expect good times financially for the state (48%) and the nation (48%) over the next 12 months, according to the October PPIC survey. Still, jobs and the economy tops their list when asked to name the most important issue facing the state in the September PPIC survey. Related to this concern, 60 percent say that the state government should be doing more to reduce the gap between the rich and the poor in California. At least half across demographic groups and regions say the state should do more. The next governor’s challenge in meeting this expectation will be the ambivalence about footing the bill. Fifty percent say they prefer to pay higher taxes and have a state government that provides more services, and 77 percent of them say the state should do more. But of the 44 percent of Californians who would rather pay lower taxes and have fewer services, just 42 percent hold this view.

Environment. A record-high 56 percent of likely voters say that the gubernatorial candidates’ positions on the environment are very important in determining their vote, according to the July PPIC survey. Many Californians say they are concerned about the personal impact of global warming in the wake of a prolonged drought and in the face of growing evidence that extreme weather from climate change is resulting in more severe wildfires. As the federal government has dramatically changed course on environmental issues, most Californians say they want the state government to make its own policies to address global warming, and many say that it is important for California to act as a world leader in fighting climate change. Californians will be looking to the next governor to build on the work in progress, while dealing with environmental crises like the wildfires this fall and with legal challenges from the Trump Administration.

Gun Policy. Most Californians (64%) say the laws covering the sale of guns should be made stricter, according to the October PPIC survey. The belief that gun laws should be stricter was at a record-high 73 percent in the March PPIC survey, shortly after the devastating high school shooting in Parkland, Florida. In the wake of the recent tragic shooting in a bar in Thousand Oaks, California, the public’s belief that gun laws should be made stricter may climb higher. And with the absence of new federal legislation to address gun violence, the governor-elect will be asked to find ways to improve the current laws restricting guns in California.

Californians’ priorities also include big-ticket items such as universal preschool and tuition-free community college that would add up to “cradle to career” education, initiatives to tackle housing affordability and homelessness, and adequate water and transportation infrastructure. The next governor will also be tested by a Democratic-controlled legislature with pent-up demand for spending after eight years of fiscal caution under Governor Brown. The October PPIC survey offers this guidance if voter approval is needed: a majority of California adults prefer a bigger government with more services to a smaller government with fewer services (54% to 39%); however, a majority of likely voters prefer a smaller government with fewer services to a bigger government with more services (53% to 41%).

As the priorities, plans, and programs of the new governor take shape in the next year, the mission of the PPIC Statewide Survey—­­ to provide a voice for all adults and likely voters— is one that we take very seriously during this critical moment of policy development. And as we look to 2020, it’s important to remember that California will be playing an early and outsized role in the presidential election, with an early March 3 primary. PPIC will host a series of one-on-one public forums next year with state and national leaders, to discuss their leadership style and to explore their vision for the state’s and nation’s future.

2020 Census: Counting the Central Coast

The decennial census plays an essential role in American democracy. Our series of blog posts examines what’s at stake for California and the challenges facing the 2020 Census, including communities that are at risk of being undercounted.  

PPIC’s interactive census maps are an important tool for Californians working to ensure an accurate census count. Using estimates from the Census Bureau and the Federal Communications Commission, they highlight hard-to-count communities across the state and pinpoint reasons why certain areas may be hard to reach.

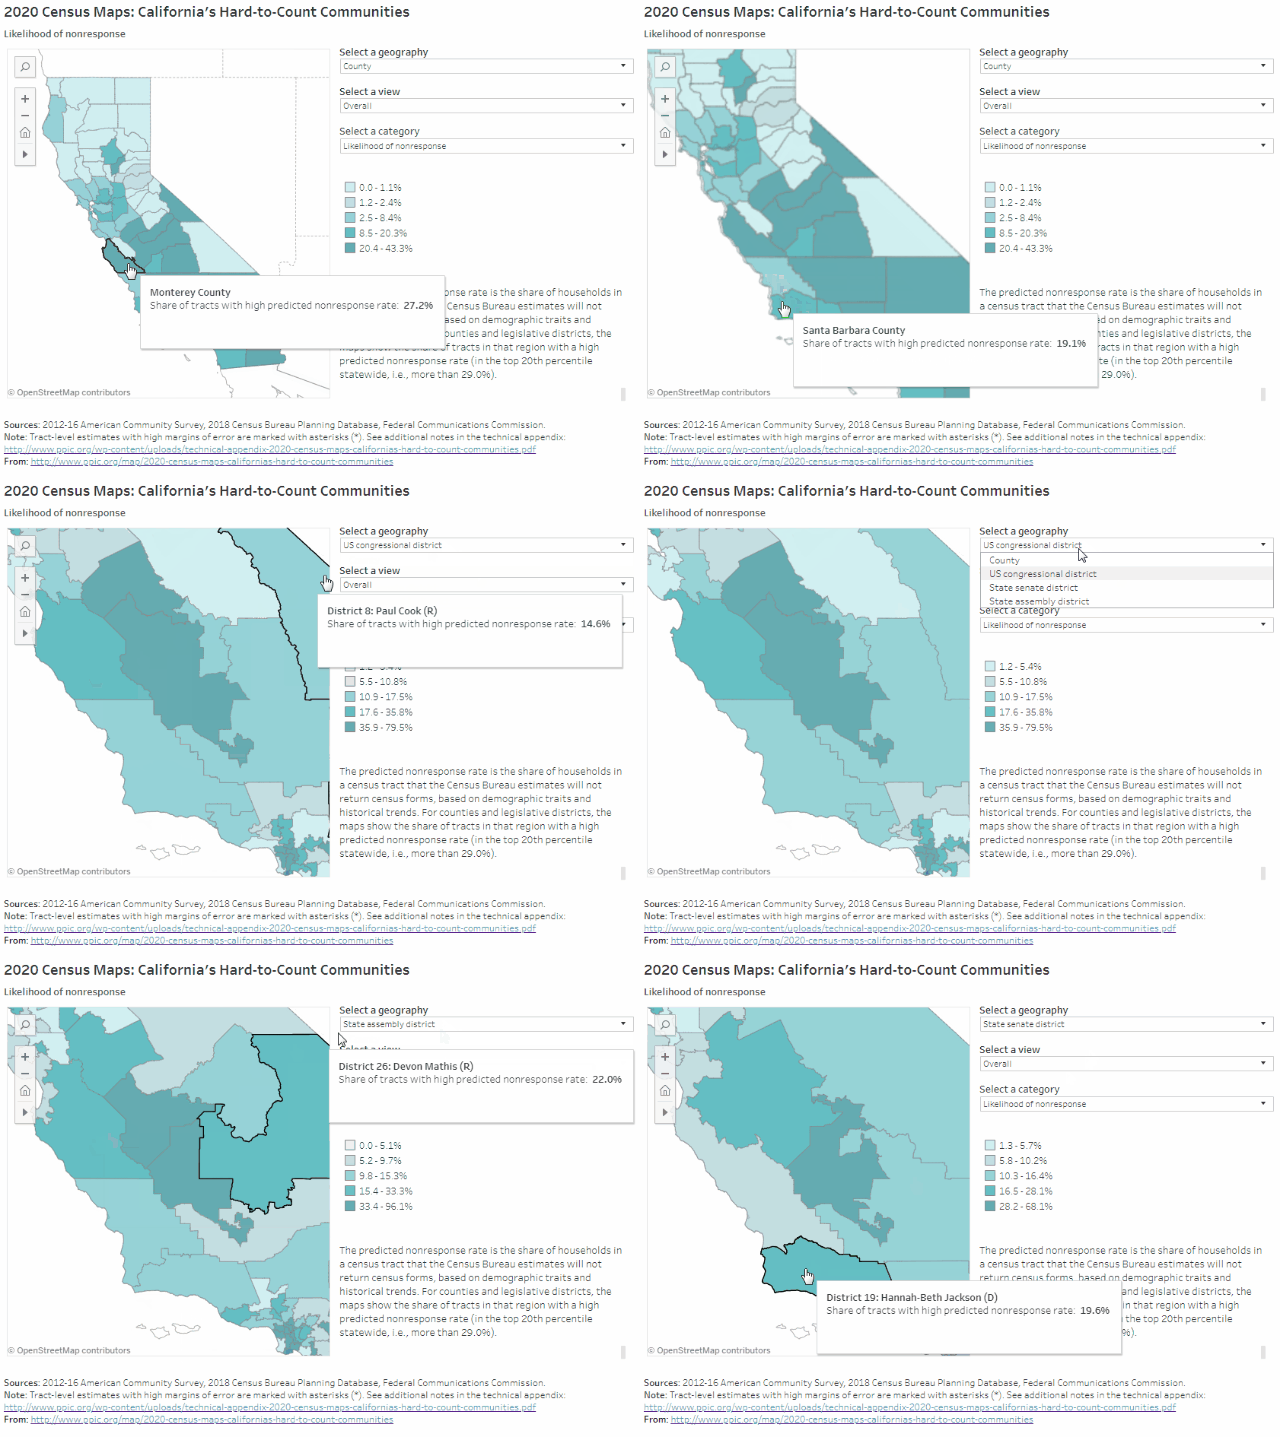
More than 2 million Californians live in the Central Coast counties of Monterey, San Benito, San Luis Obispo, Santa Barbara, and Ventura. Monterey County has by far the region’s highest share of very hard-to-count census tracts (27%), followed by Santa Barbara (19%) and Ventura (12%). Households in these very hard-to-count areas are at risk of being undercounted because they are less likely to respond initially to census forms, according to Census Bureau estimates that draw on historical trends and local demographic characteristics (e.g., race/ethnicity, age, citizenship, and housing conditions).

Census Central Coast

Some highlights:

  • The implications of undercounting very hard-to-reach places differ widely for Central Coast legislators. In two districts representing much of Monterey County—Assembly District 30 (Caballero) and Congressional District 20 (Panetta)—about a fifth or more of census tracts are likely to be very hard to count. The same is true for Senate District 19 (Jackson), covering Santa Barbara and most of Ventura County. Other Central Coast districts have relatively low shares of hard-to-count areas. Given this wide variation, understanding the overlapping factors that can make populations hard to reach will be key to ensuring an accurate count of the Central Coast.
  • There are hard-to-reach areas scattered throughout the region. In Monterey County, areas around Salinas and the Salinas Valley are likely to be the most difficult to count, with 30% or more of households predicted not to respond initially to the census. Other hard-to-reach areas can be found in the city of San Luis Obispo; Santa Maria, Santa Barbara, and Isla Vista in Santa Barbara County; and around Oxnard and Port Hueneme in Ventura County.
  • Monterey and San Benito Counties have relatively high shares of historically undercounted racial/ethnic groups. The census has typically undercounted African Americans, Latinos, and Native Americans. These groups make up about 60% of residents in Monterey and San Benito Counties—but just 24% of San Luis Obispo residents. In Santa Barbara and Ventura Counties, these racial/ethnic groups comprise about 45% of the population, similar to the state overall.
  • Undercounting young children and noncitizens would dramatically misrepresent Monterey County. Young children have been historically undercounted in the census. In addition, noncitizens may be less likely to respond in 2020 due to the planned addition of a citizenship question and fears about privacy and deportation. Almost 22% of Monterey County residents are noncitizens, and about 8% are under five years old—some of the highest concentrations in the state.
  • Outreach to residents in hard-to-count housing will be key to accurately representing the Central Coast. Monterey and Santa Barbara Counties have especially high shares of rental units, overcrowded rentals, and mobile homes. These conditions make it difficult for the Census Bureau to find and count residents. In both counties, nearly 1 in 10 housing units is an overcrowded rental. Northern San Benito County, coastal San Luis Obispo County, Santa Maria, Oxnard, and the Santa Clara River Valley also have hard-to-count housing and will require targeted outreach to fully count residents.
  • Limited internet access may be an issue in rural areas throughout the region. The Census Bureau plans to collect the majority of responses online in 2020—a change from previous practice. Each county along the Central Coast has some census tracts with minimal residential high-speed connectivity, with the lowest access outside cities. In Monterey County, for example, fewer than 400 out of every 1,000 households around Prunedale have high-speed internet connections, compared with 600–800 in neighboring Salinas. While people in these areas may have internet through smartphones or public libraries, in general they may have more trouble responding to the census online.

We hope these maps serve as a starting point to help local, regional, and state leaders think about which activities, resources, and partnerships—including language assistance, awareness raising, and community outreach—might be most effective for accurately counting different parts of California. Stay tuned for future posts that examine hard-to-count communities in other regions of the state.


Video: 2020 Census: ¿Por qué es tan importante el censo?

El censo decenal juega un papel muy clave en la democracia estadounidense. Es bastante lo que está en juego para Californiay el año 2020 se acerca rápidamente.

En este video grabado en español, Joe Hayes, investigador de PPIC, explica la importancia del censo del año 2020, y comenta sobre la propuesta de incluir una pregunta sobre la ciudadanía.

Vea más videos en esta serie.


The decennial census plays an essential role in American democracy. The stakes are huge for California—and 2020 is fast approaching.

In this Spanish-language video, PPIC researcher Joe Hayes explains the importance of the 2020 Census and discusses the proposed citizenship question.

View more videos in this series.


An English transcript of the video is available here.

1 in 4 Child Care Workers in California Lives in Poverty

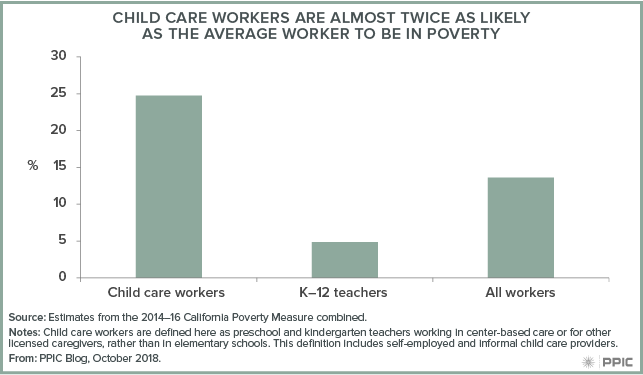
While preschools and child care providers in many parts of California are straining to fill a unmet need, the state’s child care workers are poorly paid and almost twice as likely to live in poverty than workers overall.

California’s child care workers earn significantly less than their school-based counterparts. Given that about 95% of child care workers not based in schools are women, and 53% are African American or Latina (compared with 43% of the overall workforce), women—particularly women of color—are most affected by low pay in the child care workforce.

UC Berkeley found that in 2017, the median hourly wage for child care workers in California was $12.29—just one-third the median wage for kindergarten teachers. Earnings among child care workers track more with low-wage workers across California (defined as those earning less than two-thirds of the median wage). These low wages translate to about a quarter of child care workers living in poverty as compared to 14% of all working adults (ages 18-64)—according to the California Poverty Measure, developed by PPIC and the Stanford Center on Poverty and Inequality.

Low wages are just one piece of the poverty puzzle. Relative to all working adults, child care workers are more likely to have only part-time work (more than a third, compared with less than a quarter of the overall workforce), which is associated with dramatically higher poverty rates than full-time employment. Many have completed some college credit or have an associate’s degree (44%), but just a fifth have a four-year degree, in a workforce where more than a third of working adults have four-year degrees. And while people working in child care are as likely to have children as the average working adult, those who do are more likely to be parenting alone (11%) than the average worker (6%).

The social safety net is an important part of helping child care workers make ends meet. Half of all child care workers benefit from at least one safety net program or tax credit, with the two largest being CalFresh (25%) and the federal Earned Income Tax Credit (37%). Without this assistance, poverty among child care workers would be even higher—2.5 points higher without the Earned Income Tax Credit, and 2.1 points without CalFresh. Minus all major safety net programs, one in three child care workers would live in poverty.

Recent policy changes could start to boost incomes for child care workers. Expanded eligibility for 18–24-year-olds for the state’s new Earned Income Tax Credit, starting in 2019, will specifically help the 20% of the workforce who are under 25. Steady increases in California’s minimum wage could improve earnings of child care workers employed by providers subject to minimum wage laws. Yet many workers are self-employed, providers often operate with limited incomes, and the cost of care itself is already high for low-income families. Minimum wage increases will likely result in a better-paid child care workforce only if they are accompanied by sector-wide changes aimed at making child care both affordable and accessible.

The needs of child care workers will affect efforts to improve and expand California’s complex child care system. While the state and federal governments have begun to increase access to child care with expanded programs and additional funding, improving living standards for child care workers will be a major challenge for California’s next governor.

2020 Census: Counting Los Angeles County

The decennial census plays an essential role in American democracy. Our series of blog posts examines what’s at stake for California and the challenges facing the 2020 Census, including communities that are at risk of being undercounted.

PPIC’s interactive census maps are an important tool for Californians working to ensure an accurate census count. Using estimates from the Census Bureau and the Federal Communications Commission, they highlight hard-to-count communities across the state and pinpoint reasons why certain areas may be hard to reach.

Home to about a fourth of the state’s population (10.3 million people), Los Angeles County may be one of California’s hardest-to-count regions in 2020. A third of the county’s census tracts are likely to be very hard to count, according to Census Bureau estimates that draw on local demographic characteristics (e.g., race/ethnicity, age, citizenship, and housing conditions) and historical trends. These areas tend to be concentrated in central and east LA south through Compton, as well as parts of Long Beach, the San Fernando and San Gabriel Valleys, Pomona, and Palmdale. Households in these very hard-to-count areas are less likely to respond initially to census forms and are therefore at risk of being undercounted.

Some highlights:

  • An undercount could reshape political representation in the region. Disproportionately undercounting parts of LA County could affect how district lines are redrawn after the census. Legislative districts in central and south LA have some of the highest concentrations of very hard-to-count communities in the state: In State Assembly District 59 (Jones-Sawyer), 96% of census tracts are considered very hard to count. In ten more legislative districts representing parts of central and south LA, over half of neighborhoods are considered very hard to count.
  • Undercounting people of color would dramatically misrepresent LA County’s urban core. About 57% of LA County residents are African American, Latino, or Native American—populations that have historically been undercounted in the census. In most central, south, and east LA neighborhoods, for example, African Americans and Latinos make up 80% to 100% of residents, compared with less than 15% in parts of nearby Beverly Hills and San Marino. If the 2020 Census again undercounts these groups, political representation could shift away from LA’s urban centers.
  • LA County’s hard-to-count housing is concentrated in communities of color. It can be difficult for the Census Bureau to accurately count people in rentals, overcrowded units, and mobile homes. Housing in LA County is among the hardest to count in the state. Moreover, in many neighborhoods with the hardest-to-count housing, nearly all residents are African American and/or Latino. Recognizing ways that hard-to-count communities intersect with each other will be important to conducting effective outreach to LA residents. In addition, reaching homeless Angelenos during the three-day window for counting people at shelters, tent camps, and other places will be critical to a complete and accurate count in the region.
  • Neighborhoods throughout the county have high shares of young children. In particular, east and south LA, as well as Lancaster and Palmdale, have larger concentrations of young children—who are typically undercounted in the census. In many of these neighborhoods, children under five years old make up more than 10% of residents, compared to less than 7% statewide.
  • Low responses from noncitizens would lead to a notable undercount in the region. Noncitizens may be less likely to respond to the 2020 Census due to the planned addition of a citizenship question and concerns about deportation and privacy. About 17% of LA County residents are noncitizens, compared to 14% statewide. In several neighborhoods in central and south LA, east LA, the San Fernando and San Gabriel Valleys, and Pomona, more than a quarter of residents are noncitizens.
  • The county has pockets of low internet access, including in the city of LA. The Census Bureau plans to collect the majority of responses online in 2020—a change from previous practice. Though urban areas generally have better internet access than rural areas do, a number of neighborhoods in central and south LA actually have fewer high-speed residential internet connections than the surrounding suburbs. The northeastern corner of the county also has lower levels of internet access. In these places, it may be harder to collect responses online, and participation will rely more heavily on in-person census takers or internet provided by local institutions.

We hope these maps serve as a starting point to help local, regional, and state leaders think about which activities, resources, and partnerships—including language assistance, awareness raising, and community outreach—might be most effective for accurately counting different parts of California. Stay tuned for more posts that examine hard-to-count communities in other regions of the state.

2020 Census: Counting the Bay Area

The decennial census plays an essential role in American democracy. Our series of blog posts examines what’s at stake for California and the challenges facing the 2020 Census, including communities that are at risk of being undercounted.  

PPIC’s interactive census maps are an important tool for Californians working to ensure an accurate census count. Using estimates from the Census Bureau and the Federal Communications Commission, they highlight hard-to-count communities across the state and pinpoint reasons why certain areas may be hard to reach.

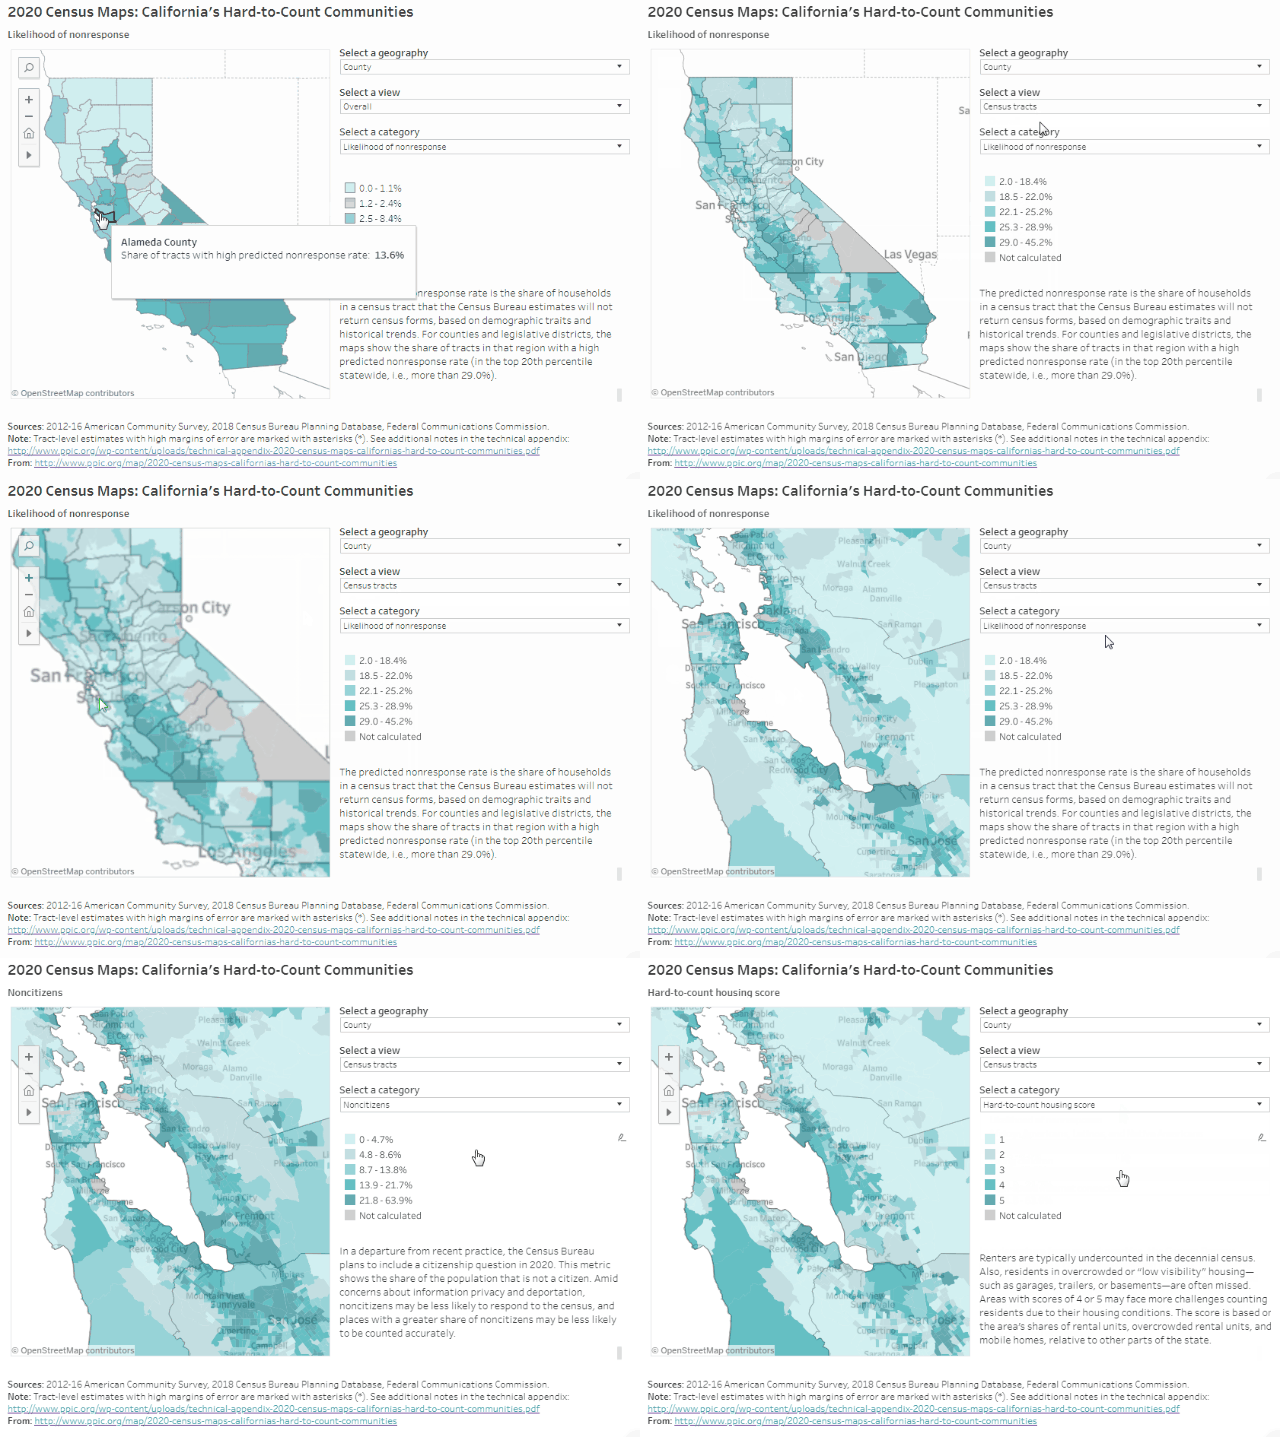
Home to about 20% of the state’s population—some 8 million people—the Bay Area has clusters of hard-to-reach places throughout the region. Of the 10 counties bordering the San Francisco, San Pablo, and Suisun Bays, including neighboring Santa Cruz County, Alameda has the highest share of very hard-to-count areas (14% of census tracts) and Napa the lowest (3%). Households in these very hard-to-count areas are less likely to respond initially to census forms and are therefore at risk of being undercounted, according to Census Bureau estimates that draw on historical trends and local demographic characteristics (e.g., race/ethnicity, age, citizenship, and housing conditions). Compared to some of California’s central and southern counties, the Bay Area has lower shares of very hard-to-count places, but there are still several areas of concern.

Some highlights:

  • East Bay legislative districts have the highest concentrations of very hard-to-count neighborhoods in the region. In three East Bay legislative districts, 20% or more of census tracts are considered very hard to count: Congressional District 13 (Lee), State Senate District 9 (Skinner), and State Assembly District 18 (Bonta). Each of these districts represents Oakland and other parts of the East Bay.
  • But there are hard-to-reach neighborhoods throughout the Bay Area. In addition to Oakland, residents in the East Bay cities of Richmond, Berkeley, and Hayward are likely to be hard to reach, with around 30% of households in many neighborhoods predicted not to respond initially to the census. In San Francisco, particularly hard-to-reach neighborhoods include SoMa, the Mission District, and Bayview/Hunters Point. Other cities with many hard-to-count census tracts include Santa Cruz, San Jose, East Palo Alto, and Redwood City on the Peninsula, and Antioch, Santa Rosa, and Vallejo in the North Bay. It is important to keep in mind that communities may be hard to count for multiple reasons.
  • Understanding local population trends can help guide effective outreach. Compared to the rest of the state, Bay Area counties tend to have lower-than-average shares of young children, African Americans, Latinos, and Native Americans—populations that are typically undercounted in the census. Nevertheless, many neighborhoods have relatively high concentrations of young children and people of color—and are still at risk of being undercounted. For example, undercounting people of color in 2020 could significantly misrepresent communities in Richmond, Oakland, East Palo Alto, and Bayview/Hunters Point.
  • Low responses from noncitizens could lead to an undercount, especially in the South Bay.
    Noncitizens may be less likely to respond to the 2020 Census due to the planned addition of a citizenship question and concerns about deportation and privacy. Nearly 18% of people in Santa Clara County are noncitizens, compared to just under 14% statewide. Noncitizens make up about 15% of residents in Alameda and San Mateo Counties as well. In many neighborhoods—including parts of Fremont, Sunnyvale, Cupertino, and Redwood City—more than 30% of residents are noncitizens.
  • Housing conditions may make some Bay Area residents particularly hard to reach. Several neighborhoods in the East Bay, San Jose, Redwood City, and Santa Cruz have relatively large shares of housing units that are rentals, overcrowded rentals, and/or mobile homes—a reflection of how residents are coping with some of the most expensive housing markets in the country. These conditions can make it harder for the Census Bureau to find and count residents. In some parts of San Jose, for example, one in four rentals is overcrowded. Reaching homeless residents during the three-day window for counting people at shelters, tent camps, and other places will also be critical to an accurate count in the region.

We hope these maps serve as a starting point to help local, regional, and state leaders think about which activities, resources, and partnerships—including language assistance, awareness raising, and community outreach—might be most effective for accurately counting different parts of California. Stay tuned for more posts that examine hard-to-count communities in other regions of the state.


Poverty in California Is High by Any Measure

The Census Bureau recently released updated income and poverty statistics for the years 2015–2017 combined, including information on the Supplemental Poverty Measure (SPM) for states. The SPM updates official poverty statistics, which are released annually, by accounting for the varying cost of housing across states and the impact of key social safety net programs like federal and state Earned Income Tax Credits (EITCs). According to the SPM, California continues to have one of the nation’s highest poverty rates, neck-and-neck with Florida (18.1%) and Louisiana (17.6%). While California’s poverty rate for 2015–2017 was 19%, the national poverty rate was much lower, at 14.1%.

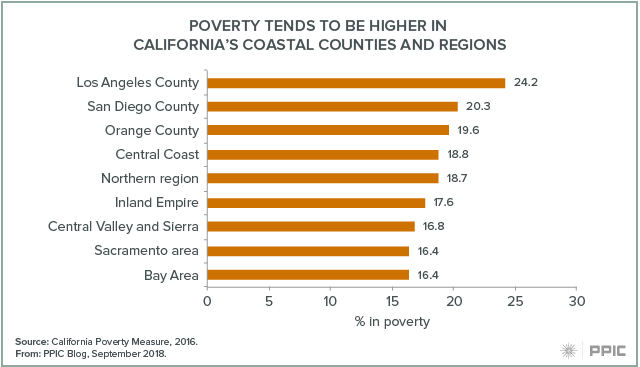
The California Poverty Measure (CPM), a collaborative effort by PPIC and the Stanford Center on Poverty and Inequality, provides additional detail needed to understand our large, complex state. It takes into account both the varying cost of living and the poverty-mitigating role of social safety net programs like the EITC and CalFresh within different regions of California. PPIC published CPM estimates in July indicating that 19.4% of Californians lived in poverty in 2016. Poverty rates are highest in certain coastal areas, including Los Angeles County, where the mix of the high cost of housing, employment opportunities for low-skilled workers, and access to large-scale social safety net programs create particularly challenging circumstances.

Blog figure: Poverty tends to be higher in coastal counties and regions

Despite the important role of social safety net programs, employment is a key factor in determining poverty status. Adults working full time and for the whole year have a poverty rate of just 8.3%, while nearly a quarter (23.5%) of those working less are in poverty. At the same time, employment does not eliminate poverty: 44.6% of working adults in poverty are actually working full time, year round.

Blog figure: Close to half of working poor adults in California are working full time, year round

What can policymakers do to improve the situation in California? The good news is that there are diverse opportunities to address poverty. Moderating housing costs, supporting proven employment and training programs, and vigorously supporting social safety net programs all offer opportunities to improve the well-being of disadvantaged Californians.

2020 Census: Counting the Inland Empire

The decennial census plays an essential role in American democracy. The stakes are huge for California, and 2020 is fast approaching. This series of blog posts takes a detailed look at California communities that may be at risk of being undercounted.

PPIC’s interactive census maps are an important tool for Californians working to ensure an accurate census count. Using estimates from the Census Bureau and the Federal Communications Commission, they highlight hard-to-count communities across the state and pinpoint reasons why certain areas may be hard to reach.

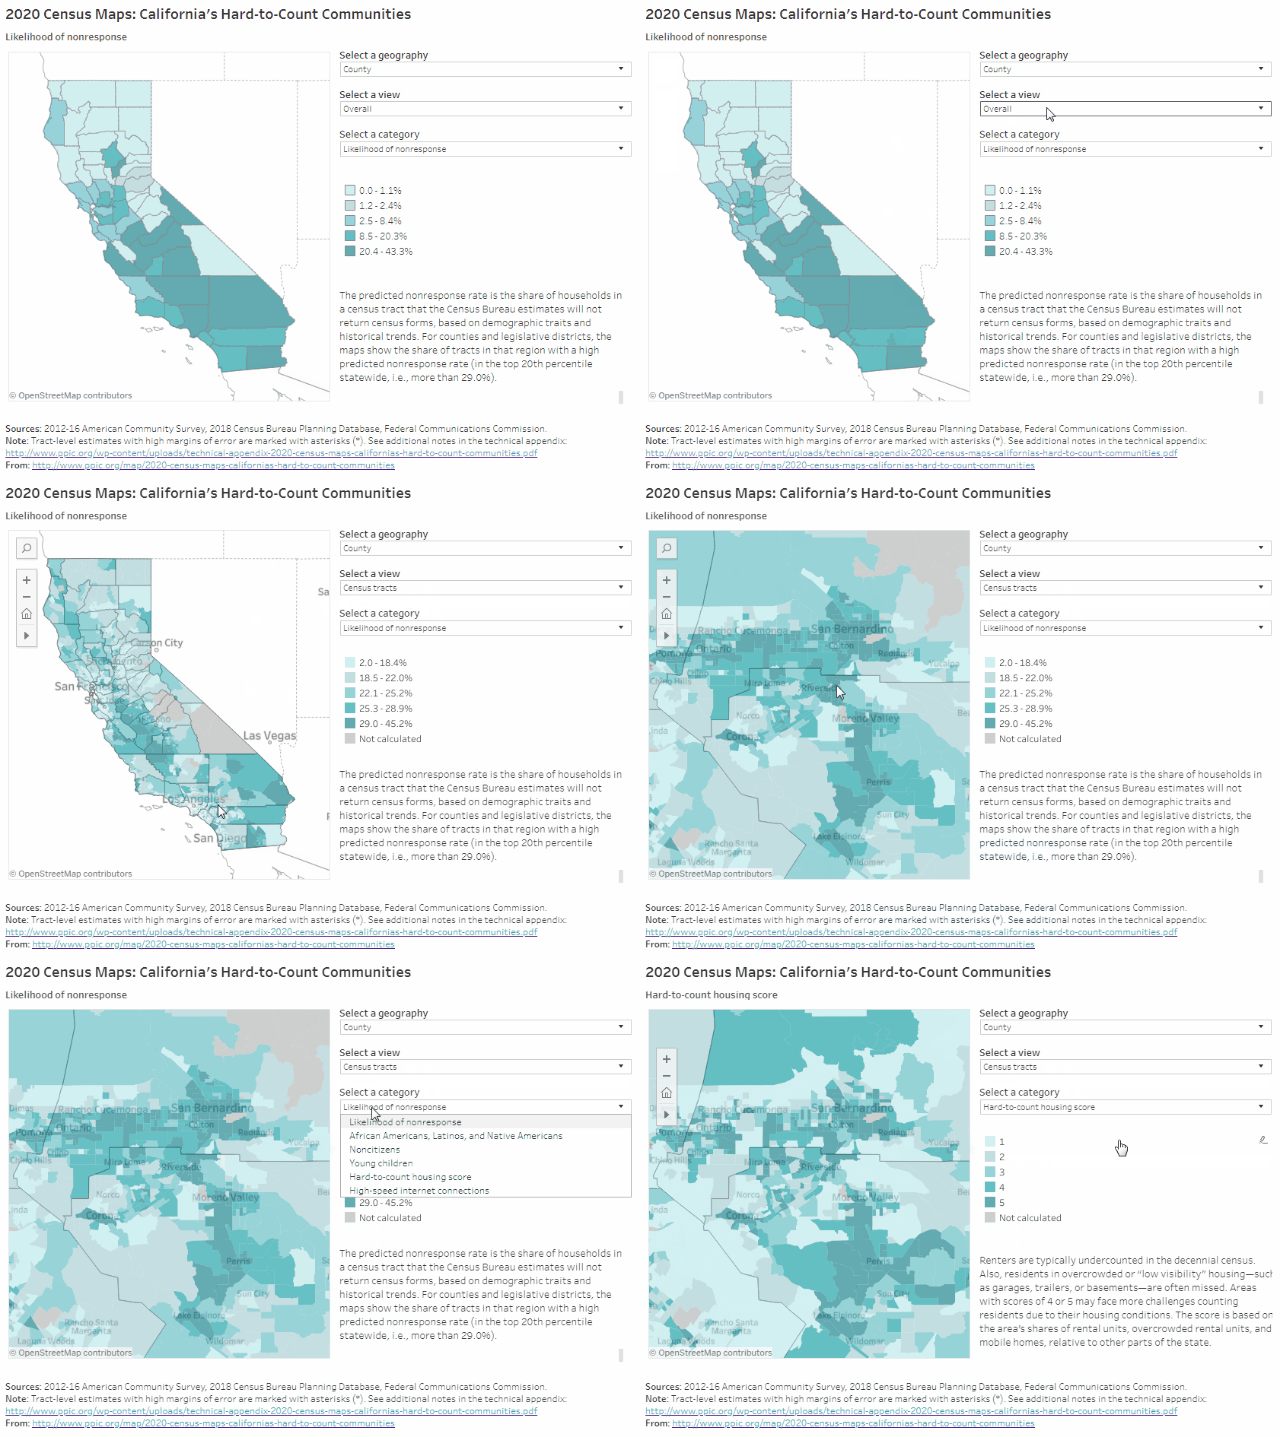
The Inland Empire is home to more than 4.5 million Californians (over 11% of the state’s population). About 29% of census tracts in San Bernardino County are likely to be very hard to count, compared to 17% in Riverside County, according to Census Bureau estimates that draw on demographic characteristics and historical trends. Households in these very hard-to-count areas are less likely to respond initially to census forms and are therefore at risk of being undercounted. Many hard-to-reach census tracts are clustered in and around the San Bernardino–Riverside metro area, including the neighboring cities of Moreno Valley and Ontario.

Some highlights:

  • Very hard-to-count communities in the Inland Empire tend to be concentrated in urban legislative districts. Since legislative district lines will be redrawn based on the census, disproportionately undercounting parts of the Inland Empire could affect the region’s political representation. For example, in Congressional Districts 31 (Aguilar) and 35 (Torres), more than 30% of census tracts are likely to be very hard to count. The same is true for State Senate District 20 (Leyva) and State Assembly Districts 40 (Steinorth), 47 (Reyes), and 52 (Rodriguez).
  • Undercounting people of color could disproportionately affect the Inland Empire. African Americans, Latinos, and Native Americans tend to be undercounted in the census. These groups make up more than half of the population in the Inland Empire—54% in Riverside County and 60% in San Bernardino County—compared to 45% statewide. In metro areas, over 80% of residents in many neighborhoods are people of color. The Inland Empire also includes several tribal reservations, such as those southeast of Coachella and northwest of Palm Springs.
  • Parts of the Inland Empire have particularly high shares of young children. Young children are historically underrepresented in the census. Riverside and San Bernardino Counties have relatively high percentages of young children (6.8% and 7.3%, respectively) compared to the state as a whole (6.5%). Certain areas have even higher concentrations of families with young children: children under five years old make up between 9% and 11% of the population around Victorville, in western San Bernardino County, and the same is true for numerous census tracts around the city of San Bernardino.
  • Communities can be hard to count for multiple reasons. Housing conditions (high shares of rentals, overcrowded rental units, and mobile homes) may make it more difficult to count residents accurately. There is hard-to-count housing throughout the Inland Empire, with pockets in metro areas, south of Moreno Valley, and in the rural eastern parts of the region. Residents may also be hard to count for other reasons. For example, in some areas with hard-to-count housing, many residents are noncitizens—who may be less likely to respond in 2020 due to the planned addition of a citizenship question. Recognizing ways that hard-to-count communities intersect with each other will be critical to conducting effective outreach to Inland Empire residents.
  • Rural areas tend to have lower internet access, as do some urban neighborhoods. The US Census Bureau plans to collect the majority of responses online in 2020—a change from previous practice. The eastern, rural parts of the Inland Empire have low levels of residential high-speed internet access and therefore may face more challenges responding to the census online. We also see lower levels of access in the city of San Bernardino and Moreno Valley relative to surrounding areas. It’s important to note that people may still have internet access through smartphones, public libraries, or other services.

We hope these maps serve as a starting point to help local, regional, and state leaders think about which activities, resources, and partnerships—including language assistance, awareness raising, and community outreach—might be most effective for accurately counting different parts of California. Stay tuned for future posts that examine hard-to-count communities in other regions of the state.