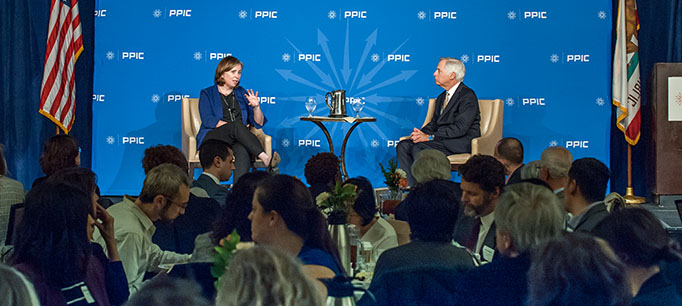
Video: A Conversation with Chief of Staff Ann O’Leary

As the Newsom administration lays out its initial plans, PPIC invited chief of staff Ann O’Leary to discuss some of the governor’s top priorities. In a wide-ranging discussion with PPIC president Mark Baldassare last week, O’Leary identified the “cost crisis” in California as one of the main challenges that Governor Newsom plans to address.

“By ‘cost crisis,’ I mean how do we make sure that people in California can have affordability and the opportunity to really take advantage of the California dream?” O’Leary said. “I think too many people in California are really seeing that slip away. They’re not able to afford homes, they’re not able to afford child care, and they’re not able to pay for college for their children as they grow older.”

O’Leary pointed out that confronting this cost crisis would take many forms, such as taking on health care affordability, investing in “cradle to career” education, and addressing housing production and rising rents.

She underscored that the governor’s first proposed budget reflects his vision for promoting affordability and opportunity while ensuring the state’s long-term financial stability. Newsom’s plan includes a mix of one-time and ongoing funding as well as a robust rainy day fund, but “we also go further than that. We have a reserve fund for the safety net, and we also look at how we could use some of the surplus to pay down pension liabilities.”

The governor has also focused on other key challenges—for example, responding to wildfires and tackling the unmet need for safe drinking water in many parts of the state.

On wildfires, O’Leary noted that the governor wants to “make sure that we’re continuing with those recovery efforts to help communities that have been harmed, but also to prepare for future wildfires.” On drinking water, O’Leary said that the governor has already worked with the legislature to provide $20 million in emergency funding to address this issue.

Navigating the PG&E bankruptcy filing is another immediate priority. O’Leary said that over the next 60 days the governor’s team would be creating a roadmap for the state to “protect wildfire victims, protect employees who are out there every day trying to make sure we’re safe, and make sure fundamentally that we have safe and affordable power and that we’re meeting our clean-energy goals.”

O’Leary also discussed the federal-state relationship and how the governor plans to manage it. While pointing out that the state and federal governments need to work together as much as possible, O’Leary also underscored that California must stand up for its values when fundamental disagreements exist, especially on issues such as immigration and family planning. “These are differences of opinion. And it’s a needle we have to thread, but we’re going to do our best.”

Reviving the Health Care Mandate: Who Pays?

Governor Newsom has proposed creating a state individual mandate to help fund increased health insurance subsidies for low- and middle-income Californians. One of the major reforms ushered in by the Affordable Care Act, the federal individual mandate—which was rolled back in the federal tax bill passed in 2017—required most individuals to have comprehensive health insurance or pay a tax penalty. The governor’s administration projects approximately $500 million in revenue from the mandate, based on the total amount paid by Californians in 2016.

As the governor and legislature consider a state mandate, it’s worth examining which Californians paid the federal mandate penalty.

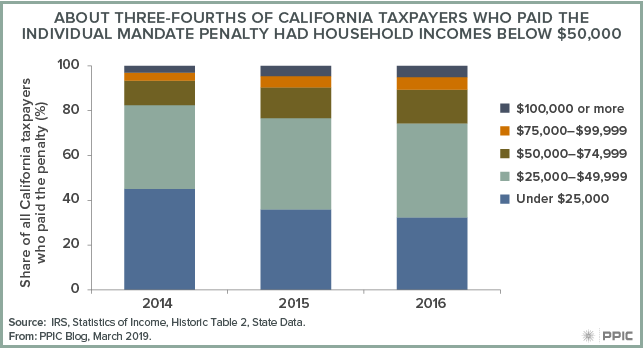
Between 2014 and 2016, taxpayers with incomes below $50,000 accounted for a vast majority of returns that included the individual mandate penalty. In 2014, the first year the individual mandate went into effect, the penalty was 1% of income or a maximum of $285 per family ($95 per adult and $47.50 per child). More than 1 million tax returns in California paid the penalty. Taxpayers with incomes below $25,000 accounted for about 45% of returns subject to the penalty, while those with incomes between $25,000 and $50,000 accounted for another 37%. Even more low-income individuals would have been subject to the penalty if not for certain exemptions—such as having an income below the tax filing threshold ($12,500 for a single adult) or facing hardships like bankruptcy and eviction.

In 2016, the minimum payment rose to 2.5% of income or a maximum of $2,085 per family ($695 per adult and $347.50 per child). The total number of taxpayers subject to the penalty dropped to about 600,000. Those with incomes below $50,000 still accounted for nearly three-fourths of all payments, though this was down from 83% in 2014.

About Three-fourths of California Taxpayers Who Paid the Individual Mandate Penalty Had Household Incomes Below $50,000

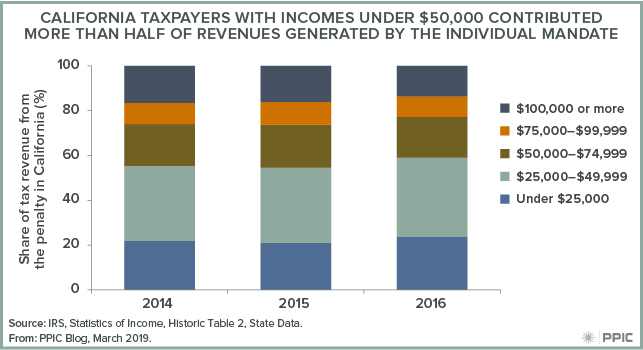
The revenues generated also disproportionately came from taxpayers in lower income brackets. In 2014, taxpayers with incomes below $50,000 accounted for more than 55% of the $222 million in total payments from California taxpayers. Those with incomes under $25,000 paid more than $48 million and those with incomes between $25,000 and $50,000 paid more than $74 million.

Although the number of taxpayers subject to the penalty dropped from 2014 to 2016, tax revenue doubled—in part because the penalty amount increased—and reached $446 million in 2016. Over this time, the share of the total amount paid by households with incomes of $100,000 or more decreased, from 17% to 14%. Meanwhile, the share of revenue paid by those with incomes below $50,000 rose, from 55% in 2014 to 59% in 2016.

California Taxpayers with Incomes Under $50,000 Contribute More Than Half of Revenues Generated by the Individual Mandate

If the state does implement the governor’s proposal, the revenue would increase subsidies currently available for individuals with incomes between 250% and 400% of the federal poverty level ($31,225–$49,960 for a single adult) and expand subsidies to individuals with incomes between 400% and 600% of the federal poverty level ($49,960–$74,940). Most Californians with lower incomes are eligible either for no-cost Medi-Cal or heavily subsidized coverage through Covered California—though not everyone who is eligible enrolls in these programs.

The repeal of the federal individual mandate is expected to lead to an increase in the number of uninsured individuals and higher insurance premiums. A state individual mandate might help counteract those effects by encouraging healthy individuals to enroll in coverage—but at a cost.

In an otherwise progressive state tax structure, the implementation of the federal mandate disproportionately affected low-income Californians. There’s also evidence that some Californians paid the penalty even though they should have been exempt. If the state revives the mandate, the governor and legislature should consider how to improve awareness about eligibility and exemptions so this problem can be avoided. At the same time, reducing the number of people paying the penalty also means that the governor’s revenue estimate may need to be lowered. As policymakers engage in discussions over a state individual mandate, assessing who bears the burden of the tax and who benefits will be an important consideration.

A Snapshot of Homelessness in California

In late January communities around the country conducted a point-in-time count of their homeless populations. Federally mandated by the US Department of Housing and Urban Development, these estimates help local, state, and federal governments allocate resources and track progress toward the goal of ending homelessness.

Last year’s count revealed that about 130,000 Californians were homeless—nearly a quarter of the national total. California’s rate of homelessness, 33 per 10,000 residents, was among the highest in the country.

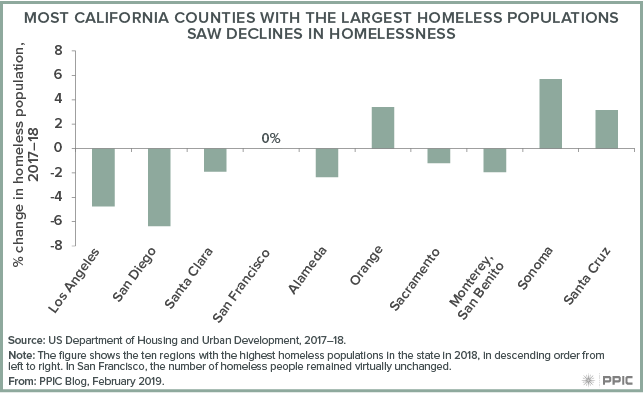
After rising 14% from 2016 to 2017, the total number of homeless Californians declined slightly (by 1%) from 2017 to 2018. Homelessness decreased in many of California’s major urban areas, including in four of the five counties with the largest homeless populations: Los Angeles, San Diego, Santa Clara, and Alameda.

However, even with these decreases homelessness remains a huge problem. Los Angeles County alone recorded nearly 50,000 homeless people. The other nine counties with the largest homeless populations reported between 2,300 and 8,600 people experiencing homelessness. And many areas across the state saw increases in the number of homeless people.

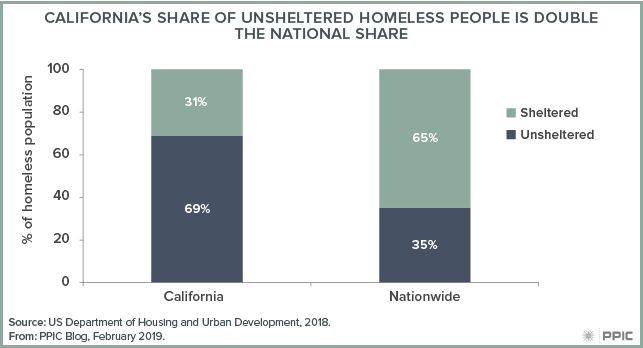
The vast majority of homeless Californians (69%) were unsheltered, meaning they were living in streets, parks, or other locations not meant for human habitation—the highest rate in the nation. Among homeless veterans, California has the nation’s highest share that are unsheltered (67%); and among homeless youth, the share that are unsheltered (80%) ranks second highest.

Homelessness is already on many policymakers’ radar. Governor Newsom’s proposed budget would allocate $500 million in one-time grant funding for emergency homeless shelters and navigation centers, and $25 million ongoing to assist eligible homeless individuals in applying for disability benefits. Localities are also trying a range of approaches to expand affordable housing and increase services for the homeless. For example, voters in Los Angeles, Berkeley, Santa Rosa, and Emeryville recently passed local bonds to fund housing projects and assistance for low- and middle-income households and people experiencing homelessness. Coordinating investments, policies, and programs across federal, state, and local levels will be key to reducing homelessness throughout the state.

Video: A Conversation with California’s Legislative Leadership

When Toni Atkins, President Pro Tem of the California State Senate, sat down to talk with PPIC president Mark Baldassare last week, she brought along a list of pressing issues. Asked to name the top two issues facing the state, she led off with housing: “The growing crisis around the lack of housing supply for all levels of Californians is one of our most critical issues.” Next came climate change and its effects across California. And then she added a third issue: water sustainability. In reality, she said, “there is always a list of issues and challenges that we are working on in California.”

Despite this long list, Atkins was optimistic about the legislature’s chances of working productively with Governor Newsom. “It’s early, but I would say that what I appreciate and enjoy about Governor Newsom is he really is a policy wonk at heart.” She added that while Jerry Brown and Gavin Newsom share many priorities, the two have very different styles. “Jerry Brown proposed a budget and he only wanted a few things,” while Governor Newsom “has thrown everything out there.”

After noting that it will be interesting to see how the legislature approaches this year’s budget process, Atkins highlighted the governor’s focus on homelessness and mental health issues and his commitment to early childhood education—which, she added, has been “a huge driving issue for the legislative women’s caucus.” She expressed particular interest in the governor’s proposal to “take juvenile justice offenders out of CDCR—the California Department of Corrections and Rehabilitation—and into more of a health/social services arena.”

Shifting from the state budget process to the ongoing drama over the budget—and border wall—at the federal level, Baldassare asked Atkins about the state government’s response to what is happening in Washington, DC. “You know, I’m so glad to be in California,” she replied. Citing the state’s diversity and the policies that foster it, she said that “to have that attacked in many ways at the federal level means all of a sudden you’ve got California really promoting state’s rights, to protect our policies, our values, and things that we hold dear.”

Atkins tended to be optimistic about even the thorniest issues—such as forestry management, building more housing, and water sustainability. Speaking about the cluster of issues related to climate change, she said, “Maybe the result of these catastrophic fires, and floods, and mudslides—maybe that is the way we’re now able to have a conversation we couldn’t have five years ago, before it was a crisis.” But she added that in order to move an agenda forward, “you’ve got to still have all the stakeholders at the table.”

More generally, Atkins stressed the importance of representing all Californians, regardless of party: “I think we have work to do together.”

Interactive: A Look at Child Poverty across California

[vc_row][vc_column][vc_column_text]Governor Newsom’s first budget proposal included notable efforts to address poverty—especially child poverty—by increasing CalWORKs cash assistance grants, expanding assistance to low-income parents pursuing higher education, and further expanding the state’s Earned Income Tax Credit (CalEITC, which he proposed renaming the Working Families Tax Credit).

California has a troublingly high child poverty rate of 21.3%, or about 1.9 million children, according to our latest estimates from the California Poverty Measure (CPM). The CPM is a joint research effort between PPIC and the Stanford Center on Poverty and Inequality that, unlike official poverty metrics, takes into account the cost of living and benefits from social safety net programs.

While poverty rates in the state are also high, child poverty rates tend to be even higher, particularly in the most populous counties. For example, in Los Angeles County, 24.3% of all residents—but 27.8% of children—live in poverty. Altogether, 17 counties, 29 congressional districts, 21 senate districts, and 42 assembly districts have child poverty rates of more than about 20%.

State and federal policies play an important role in lowering child poverty. Our estimates indicate that over a third (35.3%) of children would be in poverty, were it not for programs like CalFresh food assistance, the federal and state Earned Income Tax Credits, and CalWORKs cash assistance. PPIC research also shows that new policies could reduce child poverty even further, although effects vary across the state. We will continue to track and analyze poverty and child poverty to provide this critical information to policymakers and stakeholders.[/vc_column_text][/vc_column][/vc_row][vc_row][vc_column][vc_raw_html]JTNDZGl2JTIwY2xhc3MlM0QlMjd0YWJsZWF1UGxhY2Vob2xkZXIlMjclMjBpZCUzRCUyN3ZpejE1NDc4MjcxODU1NTglMjclMjBzdHlsZSUzRCUyN3Bvc2l0aW9uJTNBJTIwcmVsYXRpdmUlMjclM0UlM0Nub3NjcmlwdCUzRSUzQ2ElMjBocmVmJTNEJTI3JTIzJTI3JTNFJTNDaW1nJTIwYWx0JTNEJTI3JTIwJTI3JTIwc3JjJTNEJTI3aHR0cHMlM0ElMjYlMjM0NyUzQiUyNiUyMzQ3JTNCcHVibGljLnRhYmxlYXUuY29tJTI2JTIzNDclM0JzdGF0aWMlMjYlMjM0NyUzQmltYWdlcyUyNiUyMzQ3JTNCQ2glMjYlMjM0NyUzQkNoaWxkUG92ZXJ0eWJ5Q2FsaWZvcm5pYUNvdW50eWFuZExlZ2lzbGF0aXZlRGlzdHJpY3RfMCUyNiUyMzQ3JTNCQ291bnRpZXMlMjYlMjM0NyUzQjFfcnNzLnBuZyUyNyUyMHN0eWxlJTNEJTI3Ym9yZGVyJTNBJTIwbm9uZSUyNyUyMCUyRiUzRSUzQyUyRmElM0UlM0MlMkZub3NjcmlwdCUzRSUzQ29iamVjdCUyMGNsYXNzJTNEJTI3dGFibGVhdVZpeiUyNyUyMCUyMHN0eWxlJTNEJTI3ZGlzcGxheSUzQW5vbmUlM0IlMjclM0UlM0NwYXJhbSUyMG5hbWUlM0QlMjdob3N0X3VybCUyNyUyMHZhbHVlJTNEJTI3aHR0cHMlMjUzQSUyNTJGJTI1MkZwdWJsaWMudGFibGVhdS5jb20lMjUyRiUyNyUyMCUyRiUzRSUyMCUzQ3BhcmFtJTIwbmFtZSUzRCUyN2VtYmVkX2NvZGVfdmVyc2lvbiUyNyUyMHZhbHVlJTNEJTI3MyUyNyUyMCUyRiUzRSUyMCUzQ3BhcmFtJTIwbmFtZSUzRCUyN3NpdGVfcm9vdCUyNyUyMHZhbHVlJTNEJTI3JTI3JTIwJTJGJTNFJTNDcGFyYW0lMjBuYW1lJTNEJTI3bmFtZSUyNyUyMHZhbHVlJTNEJTI3Q2hpbGRQb3ZlcnR5YnlDYWxpZm9ybmlhQ291bnR5YW5kTGVnaXNsYXRpdmVEaXN0cmljdF8wJTI2JTIzNDclM0JDb3VudGllcyUyNyUyMCUyRiUzRSUzQ3BhcmFtJTIwbmFtZSUzRCUyN3RhYnMlMjclMjB2YWx1ZSUzRCUyN3llcyUyNyUyMCUyRiUzRSUzQ3BhcmFtJTIwbmFtZSUzRCUyN3Rvb2xiYXIlMjclMjB2YWx1ZSUzRCUyN25vJTI3JTIwJTJGJTNFJTNDcGFyYW0lMjBuYW1lJTNEJTI3c3RhdGljX2ltYWdlJTI3JTIwdmFsdWUlM0QlMjdodHRwcyUzQSUyNiUyMzQ3JTNCJTI2JTIzNDclM0JwdWJsaWMudGFibGVhdS5jb20lMjYlMjM0NyUzQnN0YXRpYyUyNiUyMzQ3JTNCaW1hZ2VzJTI2JTIzNDclM0JDaCUyNiUyMzQ3JTNCQ2hpbGRQb3ZlcnR5YnlDYWxpZm9ybmlhQ291bnR5YW5kTGVnaXNsYXRpdmVEaXN0cmljdF8wJTI2JTIzNDclM0JDb3VudGllcyUyNiUyMzQ3JTNCMS5wbmclMjclMjAlMkYlM0UlMjAlM0NwYXJhbSUyMG5hbWUlM0QlMjdhbmltYXRlX3RyYW5zaXRpb24lMjclMjB2YWx1ZSUzRCUyN3llcyUyNyUyMCUyRiUzRSUzQ3BhcmFtJTIwbmFtZSUzRCUyN2Rpc3BsYXlfc3RhdGljX2ltYWdlJTI3JTIwdmFsdWUlM0QlMjd5ZXMlMjclMjAlMkYlM0UlM0NwYXJhbSUyMG5hbWUlM0QlMjdkaXNwbGF5X3NwaW5uZXIlMjclMjB2YWx1ZSUzRCUyN3llcyUyNyUyMCUyRiUzRSUzQ3BhcmFtJTIwbmFtZSUzRCUyN2Rpc3BsYXlfb3ZlcmxheSUyNyUyMHZhbHVlJTNEJTI3eWVzJTI3JTIwJTJGJTNFJTNDcGFyYW0lMjBuYW1lJTNEJTI3ZGlzcGxheV9jb3VudCUyNyUyMHZhbHVlJTNEJTI3eWVzJTI3JTIwJTJGJTNFJTNDJTJGb2JqZWN0JTNFJTNDJTJGZGl2JTNFJTIwJTIwJTIwJTIwJTIwJTIwJTIwJTIwJTIwJTIwJTIwJTIwJTIwJTIwJTIwJTIwJTNDc2NyaXB0JTIwdHlwZSUzRCUyN3RleHQlMkZqYXZhc2NyaXB0JTI3JTNFJTIwJTIwJTIwJTIwJTIwJTIwJTIwJTIwJTIwJTIwJTIwJTIwJTIwJTIwJTIwJTIwJTIwJTIwJTIwJTIwdmFyJTIwZGl2RWxlbWVudCUyMCUzRCUyMGRvY3VtZW50LmdldEVsZW1lbnRCeUlkJTI4JTI3dml6MTU0NzgyNzE4NTU1OCUyNyUyOSUzQiUyMCUyMCUyMCUyMCUyMCUyMCUyMCUyMCUyMCUyMCUyMCUyMCUyMCUyMCUyMCUyMCUyMCUyMCUyMCUyMHZhciUyMHZpekVsZW1lbnQlMjAlM0QlMjBkaXZFbGVtZW50LmdldEVsZW1lbnRzQnlUYWdOYW1lJTI4JTI3b2JqZWN0JTI3JTI5JTVCMCU1RCUzQiUyMCUyMCUyMCUyMCUyMCUyMCUyMCUyMCUyMCUyMCUyMCUyMCUyMCUyMCUyMCUyMCUyMCUyMCUyMCUyMGlmJTIwJTI4JTIwZGl2RWxlbWVudC5vZmZzZXRXaWR0aCUyMCUzRSUyMDgwMCUyMCUyOSUyMCU3QiUyMHZpekVsZW1lbnQuc3R5bGUud2lkdGglM0QlMjcxMDAlMjUlMjclM0J2aXpFbGVtZW50LnN0eWxlLmhlaWdodCUzRCUyOGRpdkVsZW1lbnQub2Zmc2V0V2lkdGglMkEwLjc1JTI5JTJCJTI3cHglMjclM0IlN0QlMjBlbHNlJTIwaWYlMjAlMjglMjBkaXZFbGVtZW50Lm9mZnNldFdpZHRoJTIwJTNFJTIwNTAwJTIwJTI5JTIwJTdCJTIwdml6RWxlbWVudC5zdHlsZS53aWR0aCUzRCUyNzEwMCUyNSUyNyUzQnZpekVsZW1lbnQuc3R5bGUuaGVpZ2h0JTNEJTI4ZGl2RWxlbWVudC5vZmZzZXRXaWR0aCUyQTEuNzclMjklMkIlMjdweCUyNyUzQiU3RCUyMGVsc2UlMjAlN0IlMjB2aXpFbGVtZW50LnN0eWxlLndpZHRoJTNEJTI3MTAwJTI1JTI3JTNCdml6RWxlbWVudC5zdHlsZS5taW5IZWlnaHQlM0QlMjc3NTBweCUyNyUzQnZpekVsZW1lbnQuc3R5bGUubWF4SGVpZ2h0JTNEJTI4ZGl2RWxlbWVudC5vZmZzZXRXaWR0aCUyQTEuNzclMjklMkIlMjdweCUyNyUzQiU3RCUyMCUyMCUyMCUyMCUyMCUyMCUyMCUyMCUyMCUyMCUyMCUyMCUyMCUyMCUyMCUyMCUyMCUyMCUyMCUyMCUyMHZhciUyMHNjcmlwdEVsZW1lbnQlMjAlM0QlMjBkb2N1bWVudC5jcmVhdGVFbGVtZW50JTI4JTI3c2NyaXB0JTI3JTI5JTNCJTIwJTIwJTIwJTIwJTIwJTIwJTIwJTIwJTIwJTIwJTIwJTIwJTIwJTIwJTIwJTIwJTIwJTIwJTIwJTIwc2NyaXB0RWxlbWVudC5zcmMlMjAlM0QlMjAlMjdodHRwcyUzQSUyRiUyRnB1YmxpYy50YWJsZWF1LmNvbSUyRmphdmFzY3JpcHRzJTJGYXBpJTJGdml6X3YxLmpzJTI3JTNCJTIwJTIwJTIwJTIwJTIwJTIwJTIwJTIwJTIwJTIwJTIwJTIwJTIwJTIwJTIwJTIwJTIwJTIwJTIwJTIwdml6RWxlbWVudC5wYXJlbnROb2RlLmluc2VydEJlZm9yZSUyOHNjcmlwdEVsZW1lbnQlMkMlMjB2aXpFbGVtZW50JTI5JTNCJTIwJTIwJTIwJTIwJTIwJTIwJTIwJTIwJTIwJTIwJTIwJTIwJTIwJTIwJTIwJTIwJTNDJTJGc2NyaXB0JTNF[/vc_raw_html][/vc_column][/vc_row]

Californians’ Priorities for Their New Leaders

California enters 2019 with Democratic super-majorities in both chambers of the state legislature and a Democratic governor replacing another for the first time in more than a century. What do Californians want state leaders to prioritize? Although the state is projected to have a budget surplus of $21 billion, many are pessimistic about the state’s short- and long-term economic prospects. These economic concerns are possibly linked to Californians’ policy and spending preferences, and they are likely to inform their attitudes toward the governor’s recently released budget proposal for the next fiscal year.

According to the December 2018 PPIC Statewide Survey, fewer than half of Californians (46%) say the state will have good times financially in the next 12 months. The share of adults holding this view hasn’t been this low since October 2014 (45%).

About one in three (32%) also say California will be a worse place to live in 2025, and 50 percent think children growing up in the state today will be worse off financially than their parents.

When asked what the state government’s most important priority should be in planning for California’s future, 39% of residents say it should be improving jobs and the economy. In the shorter term, what issues should state leaders prioritize in the coming year? Findings from the December survey offer some possible answers.

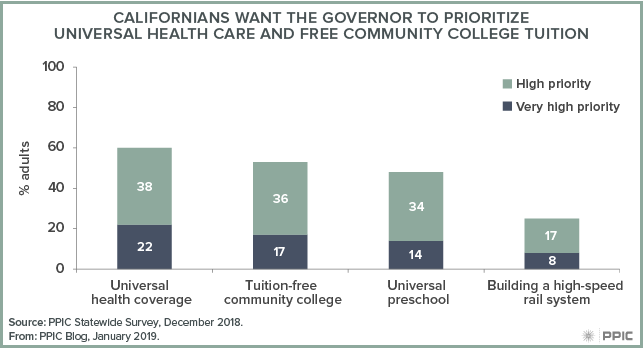
When asked what they would prefer to do with a projected budget surplus, a majority of Californians (57%) say they’d like to increase state funding for education and health and human services. When asked about several potential policies—most of which Governor Newsom highlighted during his campaign—majorities of adults say universal health coverage (60%) and tuition-free community college (53%) should be top priorities for new state funding. Fewer than half (48%) say the same about universal preschool, and one in four (25%) want to prioritize high-speed rail.

These findings underscore Californians’ preferences for programs that can help reduce economic uncertainty. They also indicate that Californians’ priorities are aligned with Governor Newsom’s budget proposal for the next fiscal year. The governor’s budget includes funding for an expansion of Medi-Cal coverage to young adults regardless of immigration status, a second tuition-free year at community college, and steps toward universal preschool for income-eligible four-year old children.

Over the next five months, as the governor and state lawmakers work toward a final budget, Californians will have the opportunity to voice their opinions. Stay tuned to the PPIC Statewide Survey as we track Californians’ attitudes toward new leaders and key policy issues.

2020 Census: Counting Imperial County

The decennial census plays an essential role in American democracy. Our series of blog posts examines what’s at stake for California and the challenges facing the 2020 Census, including communities that are at risk of being undercounted.  

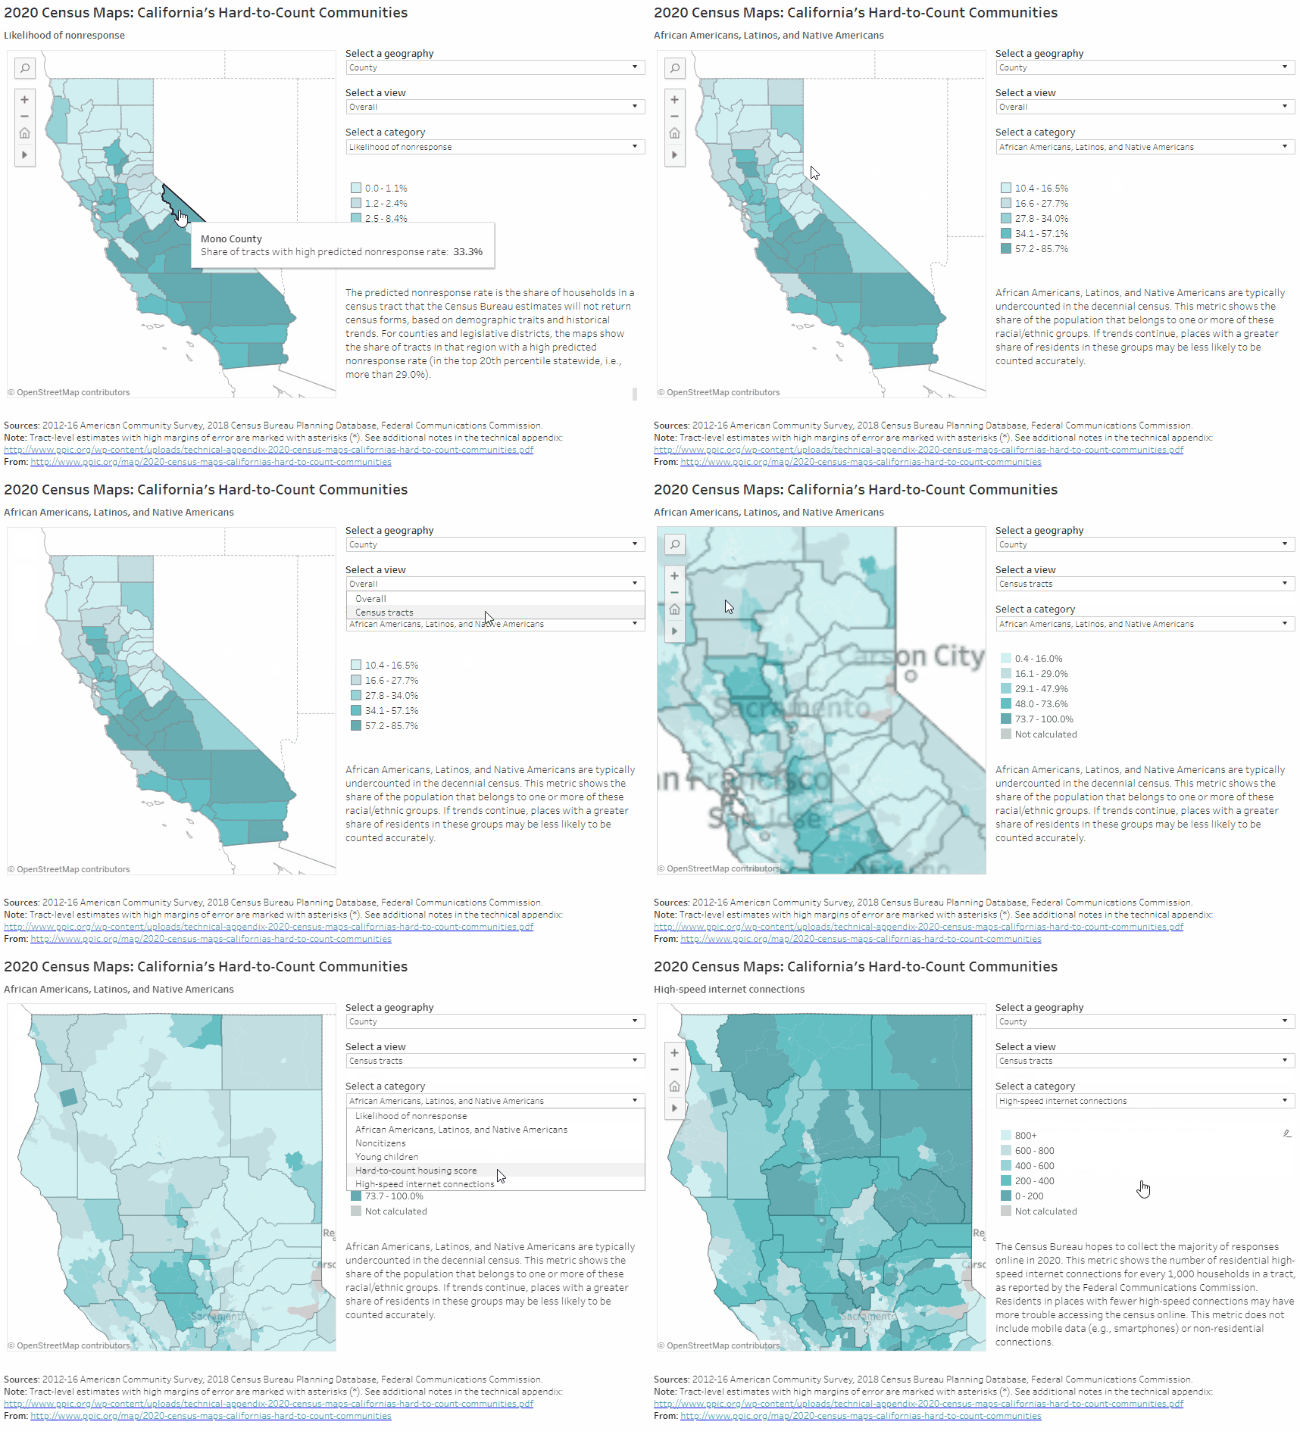
PPIC’s interactive census maps are an important tool for Californians working to ensure an accurate census count. Using estimates from the Census Bureau and the Federal Communications Commission, they highlight hard-to-count communities across the state and pinpoint reasons why certain areas may be hard to reach.

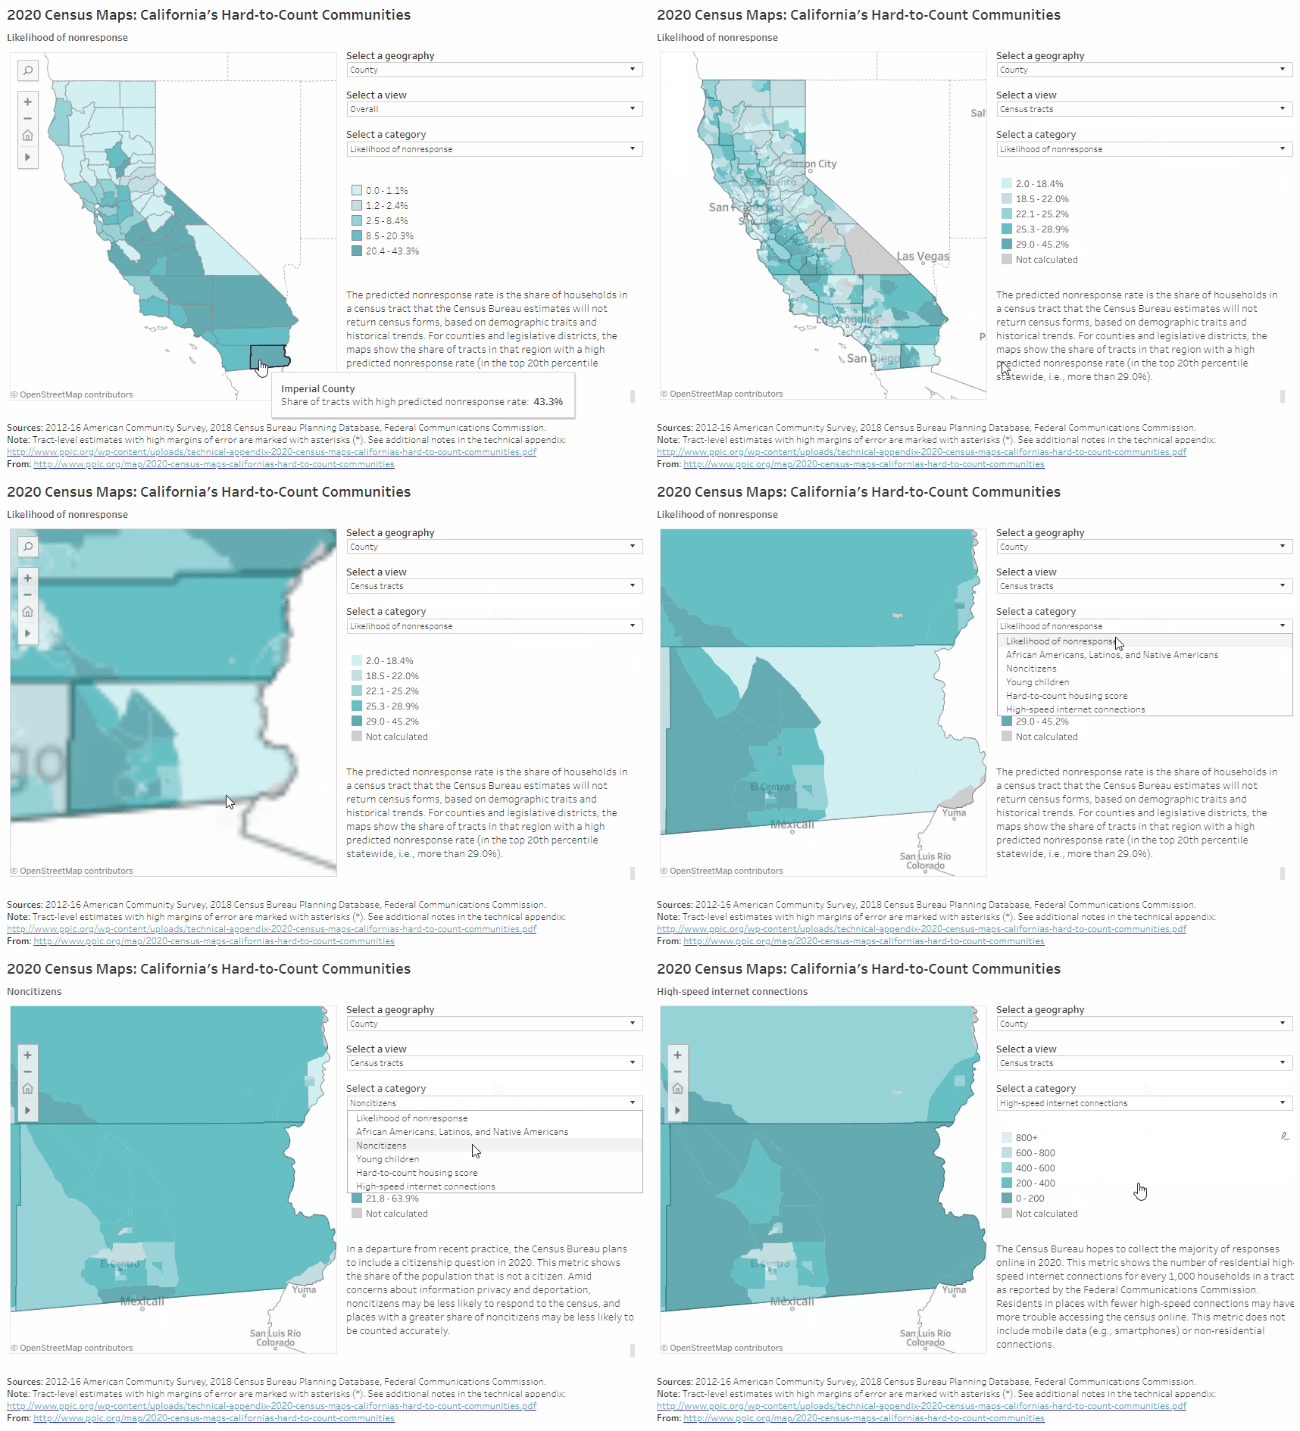
Home to nearly 200,000 people, Imperial County will likely be one of the hardest-to-count counties in California. According to Census Bureau estimates that draw on demographic characteristics (e.g., race/ethnicity, age, citizenship, and housing conditions) and historical trends, 43% of census tracts in the county will be very hard to count—the highest percentage of any county in the state. Households in these very hard-to-count areas—which are concentrated in the western half of the county, around the Salton Sea and El Centro—are the least likely to respond initially to census forms and are therefore at risk of being undercounted.

Some highlights:

  • Legislative districts representing Imperial County are among the hardest to count in California. Between 33% and 52% of census tracts are considered very hard to count in Congressional District 51 (Vargas), State Senate District 40 (Hueso), and State Assembly District 56 (Garcia). Undercounting residents of these districts could result in political representation shifting away from Imperial County and toward areas with higher population counts, since district lines will be redrawn based on the results of the 2020 Census.
  • Almost all residents belong to demographic groups that have been historically undercounted. In the past, the census has disproportionately undercounted African Americans, Latinos, and Native Americans, as well as young children. The large majority of Imperial County’s population is Latino—with higher shares of Latinos in the western half of the county—and the Fort Yuma Indian Reservation is located in the southeast. Altogether, 86% of county residents are African American, Latino, or Native American (compared to 45% statewide). Noncitizens—who may be less likely to respond in 2020 due to the planned addition of a citizenship question and concerns about deportation and privacy—make up 17% of residents in this border county (compared to 14% statewide).
  • Imperial County has a high share of young children, particularly in its cities and towns. Children under five years old make up 8% of Imperial County residents, compared with 6.5% statewide. Most young children live in the Imperial Valley, along the corridor from the Salton Sea to Calexico, or outside Yuma, Arizona. In the more rural areas to the east and west, less than 3% of county residents are children under five.
  • Housing conditions could make it difficult to accurately count residents. Compared to the rest of the state, Imperial County has relatively high shares of renters (44%), overcrowded rental units (15%), and mobile homes (8%), all of which can make residents harder to count. Reaching residents at home will require strategies that vary by geography and reflect local understanding of how families make ends meet. In the eastern part of the county, for example, almost 60% of housing units are mobile homes, and about 20% are rentals, while in and around El Centro and Calexico less than 20% of units are mobile homes but more than 60% are rentals.
  • Much of the county lacks high-speed residential internet access. The Census Bureau plans to collect the majority of responses online in 2020—a change from previous practice. Imperial County has one of the lowest rates of internet access in the state: with the exception of only one neighborhood in El Centro, fewer than 800 households per thousand in the county have high-speed internet connections. In places with limited residential internet access, census participation may rely more heavily on paper forms, in-person census takers, or internet provided by local institutions.

We hope these maps serve as a starting point to help local, regional, and state leaders think about which activities, resources, and partnerships—including language assistance, awareness raising, and community outreach—might be most effective for accurately counting different parts of California. While this concludes our regional series on hard-to-count communities throughout the state, stay tuned for future posts on the decennial census as we near 2020.

2020 Census: Counting Orange and San Diego Counties

The decennial census plays an essential role in American democracy. Our series of blog posts examines what’s at stake for California and the challenges facing the 2020 Census, including communities that are at risk of being undercounted.  

PPIC’s interactive census maps are an important tool for Californians working to ensure an accurate census count. Using estimates from the Census Bureau and the Federal Communications Commission, they highlight hard-to-count communities across the state and pinpoint reasons why certain areas may be hard to reach.

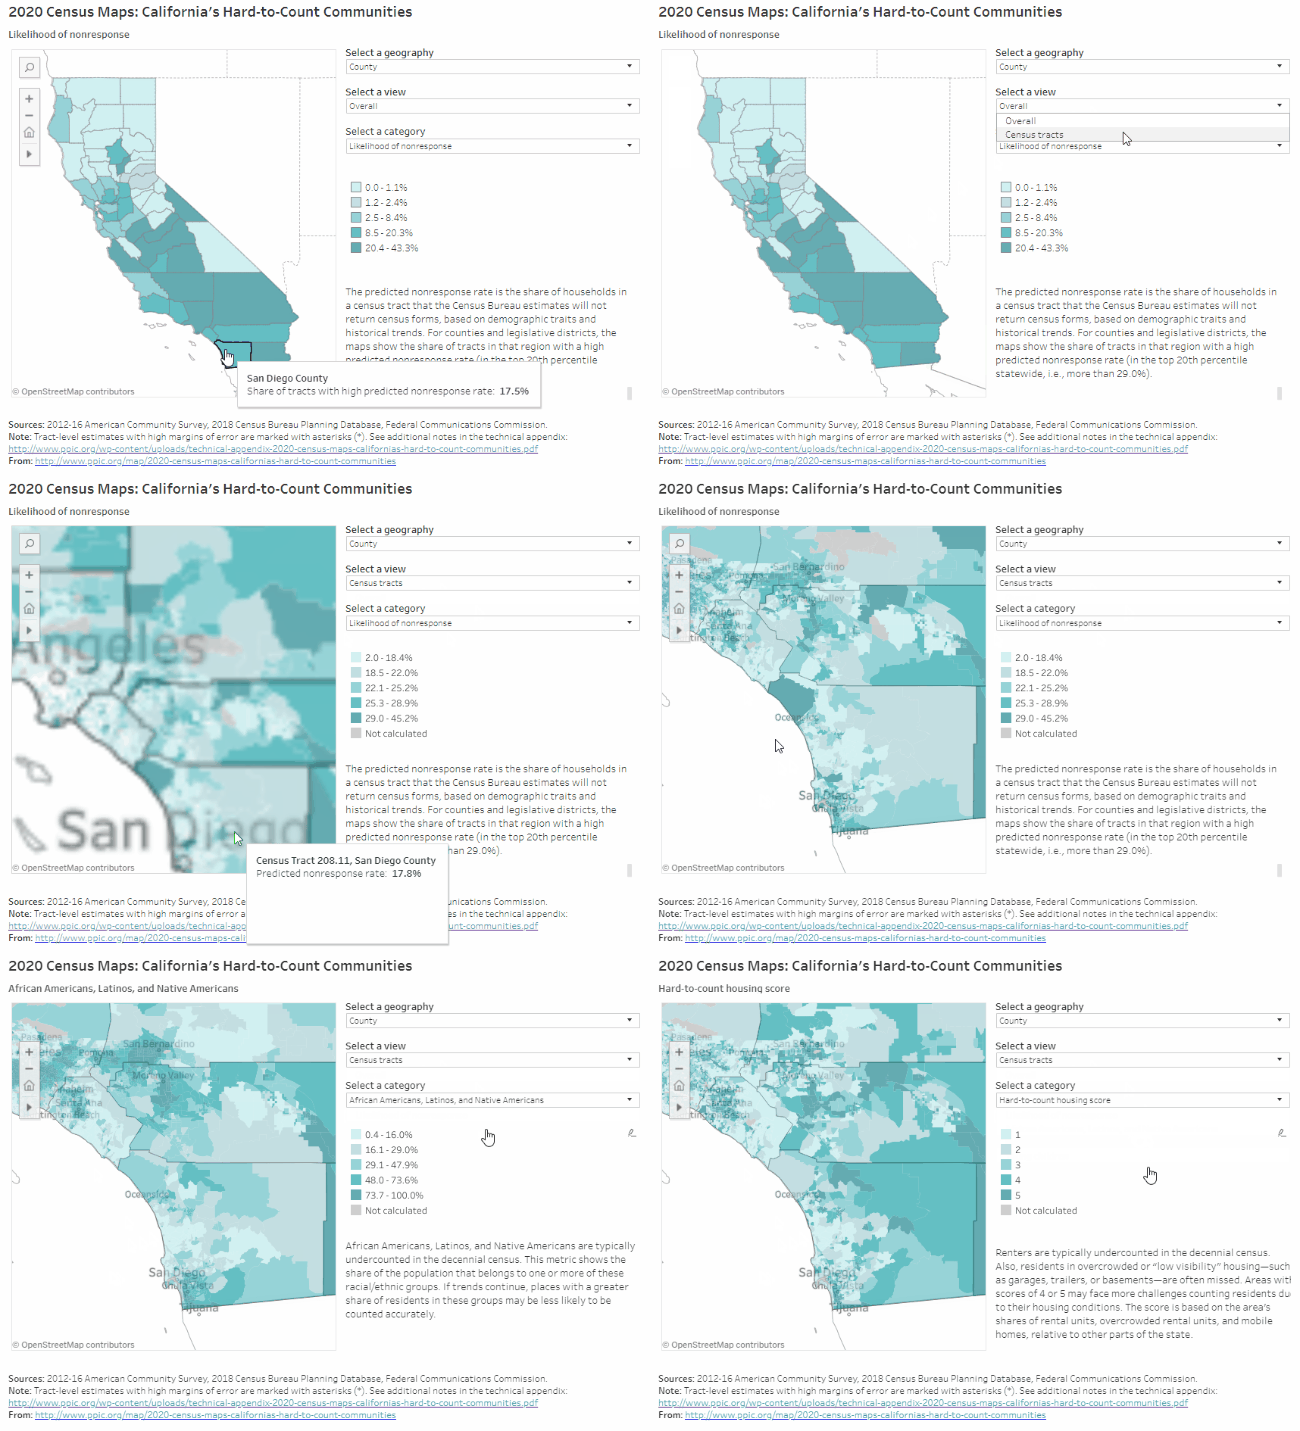
More than 6.5 million Californians live in Orange and San Diego Counties. In Orange County, the hardest-to-reach neighborhoods are found in Anaheim, Buena Park, Santa Ana, and Tustin. In San Diego County, the hardest-to-count areas include parts of Oceanside and Escondido in the northwest and, in the southwest, pockets of the cities of San Diego and Chula Vista. Altogether, San Diego County has a higher share of these very hard-to-count areas (18% of census tracts) than Orange County (11%), according to Census Bureau estimates that draw on demographic characteristics (e.g., race/ethnicity, age, citizenship, and housing conditions) and historical trends. Both counties have higher shares of these areas than 60% of counties, statewide. Households in these very hard-to-count areas are the least likely to respond initially to census forms and are therefore at risk of being undercounted.

Some highlights:

  • Undercounting hard-to-reach areas could affect political representation in the region. Since the 2020 Census will be used to redraw legislative district lines, political representation could shift away from certain neighborhoods if they are undercounted relative to other areas. For example, in Assembly District 80 (Gonzalez Fletcher), which covers southern parts of the cities of San Diego and Chula Vista, as well as a stretch of the southern border with Mexico, 52% of households are predicted to not respond initially to the census—compared to 19% in the surrounding districts.
  • Knowledge of local population trends can help guide effective outreach. Some neighborhoods in the region have higher concentrations of African Americans, Latinos, or Native Americans—populations that have historically been undercounted in the census. Latinos make up the large majority of residents around Anaheim and Santa Ana in Orange County, as well as in parts of the cities of San Diego and Chula Vista in San Diego County. In some of these same neighborhoods, more than a quarter of residents are noncitizens, who may be less likely to respond in 2020 due to the planned addition of a citizenship question. Moreover, in central and eastern parts of San Diego County, working with tribal governments to reach Native Americans will be necessary to count all residents.
  • Housing conditions may present challenges to an accurate count, particularly in urban areas. Renters and people living in overcrowded conditions or mobile homes can be harder to count accurately. Hard-to-count housing in the region is concentrated in urban parts of Orange County and in urban and eastern San Diego County. For example, in several neighborhoods in Anaheim, Stanton, and Santa Ana in Orange County, more a quarter of rentals are overcrowded. The same is true for many neighborhoods in the southwest corner of San Diego County, which also often have high shares of mobile homes. San Diego County has hard-to-count housing in inland areas as well, including in Bostonia, El Cajon, and several tribal lands.
  • The region has small pockets of relatively low internet access. The Census Bureau plans to collect most responses online in 2020—a change from previous practice. Though urban areas generally have better internet access than rural areas do, a number of neighborhoods in the cities of San Diego and Chula Vista actually have fewer high-speed residential internet connections than the surrounding suburbs. Central and eastern San Diego County also have relatively low internet connectivity. In these places, it may be harder to collect responses online, and participation will rely more heavily on paper forms, in-person census takers, or internet provided by local institutions.

We hope these maps serve as a starting point to help local, regional, and state leaders think about which activities, resources, and partnerships—including language assistance, awareness raising, and community outreach—might be most effective for accurately counting different parts of California. Stay tuned for future posts that examine hard-to-count communities in other regions of the state.

Video: Californians and Their Government

As Governor-Elect Gavin Newsom prepares for his first term, half of Californians think he should take a different policy direction than Governor Brown. Four in ten approve of Newsom’s plans and priorities—while three in ten don’t yet know enough to have an opinion. These and other key findings of the latest PPIC Statewide Survey were outlined by Dean Bonner at a Sacramento briefing last week.

The survey asked Californians about four major policy areas that were highlighted in the governor’s campaign. Most see universal health coverage and free community college as top priorities, while fewer see universal preschool as a high or very high priority and only one in four prioritize high-speed rail.

The survey also asked how the state should use the projected surplus in the next budget year. A majority of Californians say they would prefer to use the surplus to increase funding for education and health and human services. Far fewer prefer to use it to pay down debt and build up a reserve or to spend on one-time funding for transportation, water, and infrastructure.

When asked to identify the state government’s highest priority in planning for the future, 39% name improving jobs and the economy, 20% say protecting the environment, and 15% say updating water and transportation infrastructure. Improving jobs and the economy is the highest priority across all parties and demographic groups.

Other survey highlights:

  • Two-thirds of Californians say the state is divided into two economic groups: the “haves” and the “have nots.” Four in ten characterize themselves as haves and 45% say they are have nots.
  • While more than half of Californians think the state is generally headed in the right direction, only about a third are satisfied with the way things are going in the nation. Half have no confidence that President Trump will make the right decisions for the country’s future.
  • Only two in ten likely voters approve of Congress; more than half see the shift in control of the US House from the Republicans to the Democrats as a good thing.
  • Two-thirds of state residents continue to see immigrants as a benefit, and there is still bipartisan support for allowing undocumented immigrants to stay in the US legally if certain requirements are met.

2020 Census: Counting California’s Northern and Sierra Regions

The decennial census plays an essential role in American democracy. Our series of blog posts examines what’s at stake for California and the challenges facing the 2020 Census, including communities that are at risk of being undercounted.  

PPIC’s interactive census maps are an important tool for Californians working to ensure an accurate census count. Using estimates from the Census Bureau and the Federal Communications Commission, they highlight hard-to-count communities across the state and pinpoint reasons why certain areas may be hard to reach.

Home to 1.4 million people, California’s northern and Sierra regions cover around 40% of the state, spanning 23 counties: Alpine, Amador, Butte, Calaveras, Colusa, Del Norte, Glenn, Humboldt, Inyo, Kings, Lake, Lassen, Mariposa, Mendocino, Modoc, Mono, Plumas, Shasta, Sierra, Siskiyou, Tehama, Trinity, and Tuolumne. The hardest-to-count areas in these regions are found in Arcata, Chico, and Mammoth Lakes in Humboldt, Butte, and Mono Counties, respectively. Households in these very hard-to-count areas are the least likely to respond initially to census forms, according to Census Bureau estimates that draw on local demographic characteristics (e.g., race/ethnicity, age, citizenship, and housing conditions) and historical trends.

Some highlights:

  • Follow-up from census workers will likely be needed across the north and Sierras. In most census tracts in California’s northernmost and rural Sierra counties, estimates suggest 19% to 29% of households would need in-person follow-up from census workers to be counted. Further, these estimates from the Census Bureau predate the Camp, Carr, and Mendocino Complex fires, which have likely made it more difficult to count residents.
  • Housing conditions could be an obstacle to counting residents in coastal areas as well as around the northern Sacramento Valley. In these areas, large shares of housing units are rentals, overcrowded rentals, and/or mobile homes—all of which can make residents harder to count accurately. For example, more than 20% of households live in mobile homes in much of Trinity and Tehama Counties, and one out of five rentals in northeastern Siskiyou County is overcrowd Recent wildfires have likely increased the share of households in hard-to-count housing, as displaced families seek shelter elsewhere.
  • Low internet access may pose a challenge throughout the regions. The Census Bureau plans to collect the majority of responses online in 2020—a change from previous practice. Northeastern and central Sierra counties have some of the lowest rates of internet access in the state: in Plumas County, for instance, fewer than 200 out of every 1,000 households have high-speed internet access, on average. In places with limited residential internet access, participation may rely more heavily on paper forms, in-person census takers, or internet provided by local institutions.
  • Undercounting Native Americans would disproportionately affect northern and Sierra counties. African Americans, Latinos, and Native Americans have historically been undercounted in the census. There are tribal lands throughout these regions, which have a higher share of Native American residents than other parts of the state. Working with tribal governments to reach Native Americans will be an important part of accurately counting residents in the northern and Sierra regions.
  • Local knowledge is necessary for effective outreach. Colusa County has the regions’ highest share of residents from historically undercounted racial/ethnic groups (60%) and the highest share of noncitizens (15%). Noncitizens may be less likely to respond to the 2020 Census due to the planned addition of a citizenship question and concerns about deportation and privacy. Ensuring that these communities are counted in 2020 will require an understanding of the local landscape. For example, one area east of Susanville in Lassen County that includes two correctional facilities has a high share of people of color. However, incarcerated people, who are counted where they are held, are unlikely to be undercounted in the census.
  • Some northern counties have high shares of young children. Young children are historically underrepresented in the census. Along the I-5 corridor in the Sacramento Valley, and in parts of Lake, Mendocino, Humboldt, Del Norte, Siskiyou, and Lassen Counties, more than 8.5% of residents are children under five years old, compared to 6.5% statewide.

We hope these maps serve as a starting point to help local, regional, and state leaders think about which activities, resources, and partnerships—including language assistance, awareness raising, and community outreach—might be most effective for accurately counting different parts of California. Stay tuned for future posts that examine hard-to-count communities in other regions of the state.