2020 Census: Counting the San Joaquin Valley

The decennial census plays an essential role in American democracy. The stakes are huge for California, and 2020 is fast approaching. This series of blog posts takes a detailed look at California communities that may be at risk of being undercounted.

PPIC’s new interactive census maps are an important tool for Californians working to ensure an accurate census count. Using estimates from the Census Bureau and the Federal Communications Commission, they highlight hard-to-count communities across the state and pinpoint reasons why certain areas may be hard to reach.

Home to 4.3 million people, the San Joaquin Valley may be one of California’s hardest-to-count regions in 2020. Encompassing about 11% of the state’s population, the valley runs south from San Joaquin County through Stanislaus, Merced, Madera, Fresno, Tulare, Kings, and Kern Counties. Most of the communities at risk of being undercounted in the region live south of Stanislaus County through Kern County. For example, 33% of census tracts in Fresno County are likely to be very hard to count, according to Census Bureau estimates that draw on demographic characteristics and historical trends. But only 7% of tracts in Stanislaus are very hard to count. Households in these very hard-to-count areas are less likely to respond initially to census forms and are therefore at risk of being undercounted.

Some highlights:

  • An undercount could reshape the legislative landscape of the San Joaquin Valley. Since legislative district lines will be redrawn based on the census, disproportionately undercounting parts of the San Joaquin Valley could reshape the region’s political representation. And while hard-to-count communities are distributed across several counties in the region, they are concentrated in fewer legislative districts. In Congressional Districts 16 (Costa) and 21 (Valadao), for example, about 42% of census tracts are likely to be very hard to count. Undercounting could also affect the northern San Joaquin Valley, which has hard-to-reach areas despite having fewer historically undercounted populations.
  • Undercounting people of color and noncitizens could disproportionately affect legislative districts in the central and southern San Joaquin Valley. This area has particularly high shares of groups that tend to be undercounted in the census—African Americans, Latinos, and Native Americans, as well as noncitizens, who may be even less likely to respond in 2020 due to the planned addition of a citizenship question. A total of six legislative districts have populations that are at least 65% African American, Latino, or Native American and at least 15% noncitizen: Congressional Districts 16 and 21; State Senate Districts 12 (Cannella) and 14 (Vidak); and State Assembly Districts 31 (Arambula) and 32 (Salas).
  • Another factor driving the San Joaquin Valley’s overall risk of being undercounted is the high share of young children. Young children are historically underrepresented in the census. There are particularly high concentrations of families with young children in the central and southern San Joaquin Valley: children under 5 years old make up 8% or more of the population in Fresno, Kern, Kings, Merced, and Tulare Counties—among the highest concentration in the state.
  • Housing conditions may make an accurate count especially challenging in the western San Joaquin Valley. In this area, relatively large shares of housing units are rentals, overcrowded rentals, and/or mobile homes—all of which can make residents harder to find and count accurately. For example, more than 20% of households live in mobile homes in some northwestern parts of San Joaquin County and some southwestern parts of Tulare County.
  • Limited internet access may be an issue in certain areas throughout the region. The Census Bureau plans to collect the majority of responses online in 2020—a change from previous practice. Each county in the San Joaquin Valley has some census tracts with minimal residential high-speed connectivity, with the lowest access outside cities. While people in these areas may have internet access through smartphones or public libraries, in general they may have more trouble accessing the census online.

We hope these maps serve as a starting point to help local, regional, and state leaders think about which activities, resources, and partnerships—including language assistance, awareness raising, and community outreach—might be most effective for accurately counting different parts of California. Stay tuned for future posts that examine hard-to-count communities in other regions of the state.
Video: A Conversation with Congresswoman Nancy Pelosi

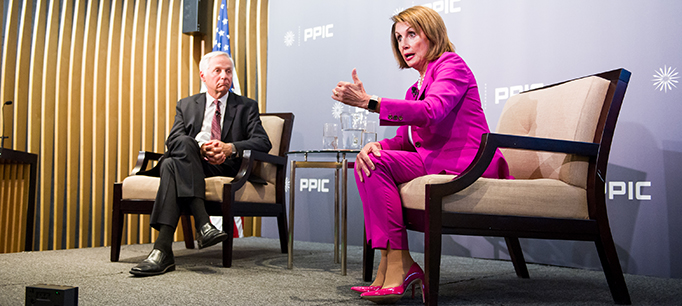
As part of our Speaker Series on California’s Future, PPIC is inviting elected leaders across the political spectrum to participate in public conversations. The purpose is to give Californians a better understanding of how our leaders are addressing the challenges facing our state.

House Democratic Leader Nancy Pelosi and PPIC president Mark Baldassare had a wide-ranging conversation in San Francisco on Wednesday. They focused on the relationship between California and the federal government in a number of areas, including economic and tax policy, immigration, health care, and environmental issues.

Not surprisingly, Pelosi’s take on the state-federal relationship differs from that of her Republican counterpart, Kevin McCarthy, who fielded virtually the same questions from Baldassare in mid-August. In her view, this is an unusual time: “We haven’t had a time where the president has so targeted a state, in tax policy, environmental policy, trade policy.” Californians need to know about the statewide impact of these policies, and their elected leaders need to “try to work as much as possible in a bipartisan way to withstand that.”

She criticized the new federal tax law for significantly increasing the national debt without promoting growth. In fact, she continued, one of the best ways to promote economic growth is to enact comprehensive immigration reform. Asked what this would look like, she cited the bipartisan immigration bill that the Senate passed several years ago as one possible model. She deplored the current “uncivilized, inhumane” policy of separating families at the border. But she argued that while Trump-era ICE policies need to be changed, abolishing ICE is “not the answer.”

Pelosi, who played a major role in the passage of the Affordable Care Act, described health care reform as a “pillar of health and economic security for America’s working families.” She also characterized health care as a major issue in the November midterm elections. “The cost of health care is a very major issue in people’s lives, so we want to work in a bipartisan way, wherever possible, to reduce those costs.”

While she is concerned that Congress is not doing enough to ensure the integrity of the midterm elections, Pelosi is excited about the number of women who are running. “When I went to Congress, there were 12 Democratic and 11 Republican women.” Now, she added, “the majority of the people in our caucus are women, people of color, LGBTQ [. . .] and we want more!”

Why does she want to be Speaker? The short answer: “None of us is indispensable, but I think I’m probably the best person for the job.”


Geographic Variation in Poverty across California

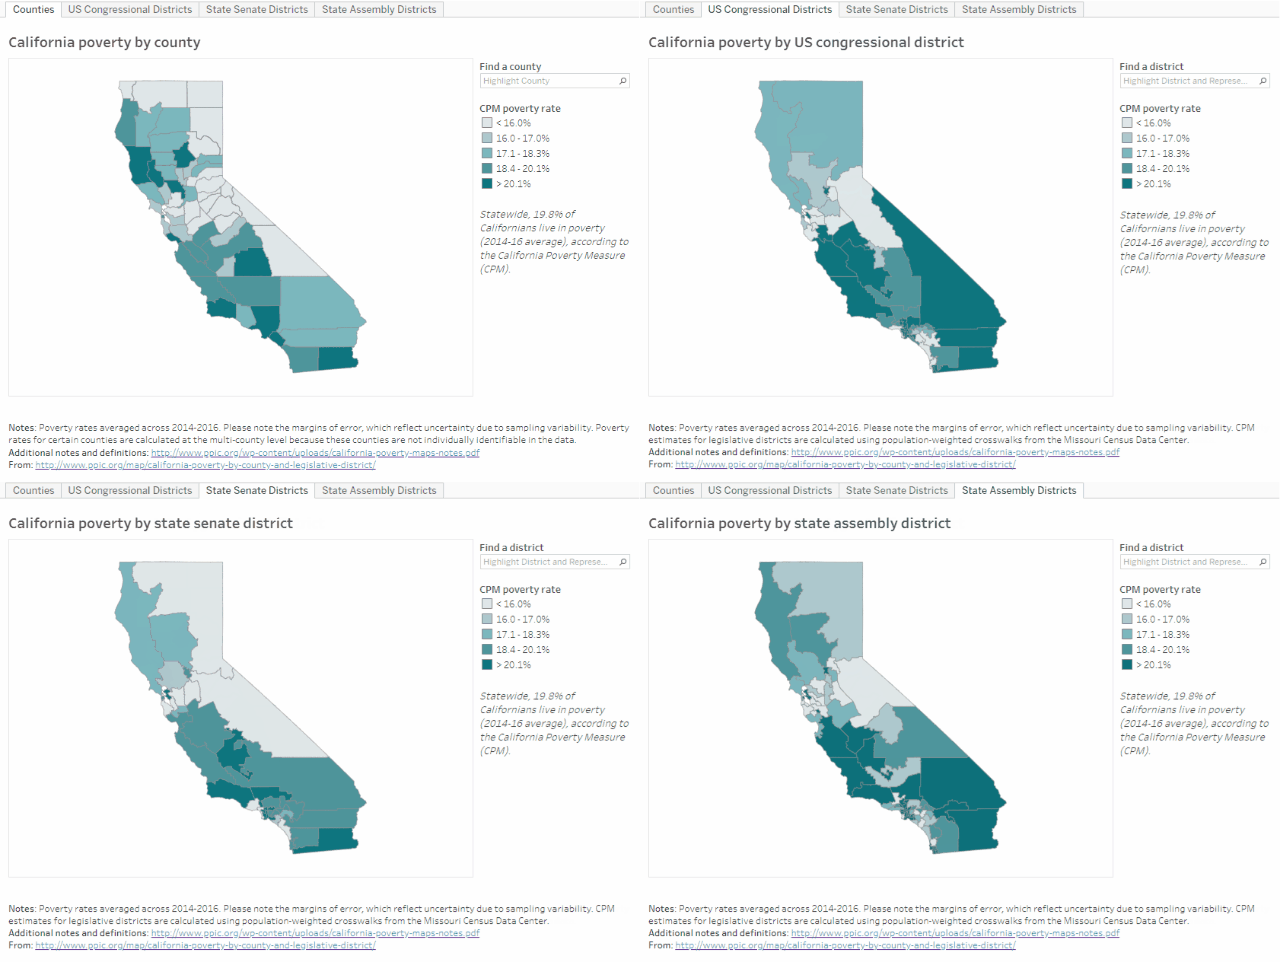
Each year, when we update the data on poverty in California, we remark on how widely poverty rates vary across counties. In Los Angeles County, 24.3% of residents are poor, compared with just 11.8% of those in El Dorado County, according to the California Poverty Measure (CPM). The CPM is a collaboration between PPIC and the Stanford Center on Poverty and Inequality that adjusts for regional housing costs and incorporates resources from major social safety net programs.

Our new interactive maps highlight the dramatic variation in poverty across counties and US congressional, state senate, and state assembly districts. Overall, the maps show high rates of poverty in coastal and southern California, and lower rates in the northern and Sierra regions. This pattern is driven by a variety of factors: poor families in coastal, urban regions can earn relatively higher incomes, but this is often outweighed by high costs of living and reduced eligibility for safety net programs. In contrast, high poverty rates inland and along the north coast are driven by low incomes and limited employment—despite substantial poverty reduction by the social safety net.

These maps allow leaders from counties—where social safety net programs are often implemented—and legislative bodies—where program funding is allocated—to learn more about poverty and the impact of the safety net in their region.

Legislative districts see even greater disparities in poverty than counties do. Across assembly districts, for example, poverty rates differ by more than 30 percentage points, ranging from 7.8% in Assembly District 16 (Baker, R) in eastern Contra Costa County to 40.7% in Assembly District 59 (Jones-Sawyer, D) in central Los Angeles. This range reflects differences in the number of counties and assembly districts, as well as the size of their populations. California has 80 assembly districts with roughly equal populations, so they represent more slices of the state—especially in urban, densely populated counties.

Comparing counties and legislative districts draws attention to the ways that boundaries can bring forth or obscure populations. In the Inland Empire (San Bernardino and Riverside) in southeastern California, county and state senate district lines show poverty rates below the state average of 19.8% from 2014–16, ranging from 18.2% to 18.9%. But state assembly and US congressional districts in that area have high poverty rates, ranging from 20.5% to 22.7%—and are adjacent to districts with much less poverty.

The maps provide a rich resource for learning about the geographic variation of poverty in California. Since the factors driving poverty vary across the state, effective approaches for reducing poverty may vary too, as our previous research on child poverty has shown. For additional detail, the maps allow users to download estimates on the impact of major social safety net programs on poverty in different regions.

Video: 2020 Census: Why Is the Citizenship Question Such a Big Deal?

The decennial census plays an essential role in American democracy. The stakes are huge for California—and 2020 is fast approaching.

In this video, PPIC research fellow Eric McGhee discusses the controversial addition of a citizenship question to the 2020 Census. View more videos in this series.


2020 Census: Where Are California’s Hard-to-Count Communities?

The decennial census plays an essential role in American democracy. The stakes are huge for California, and 2020 is fast approaching. This series of blog posts takes a detailed look at California communities that may be at risk of being undercounted.

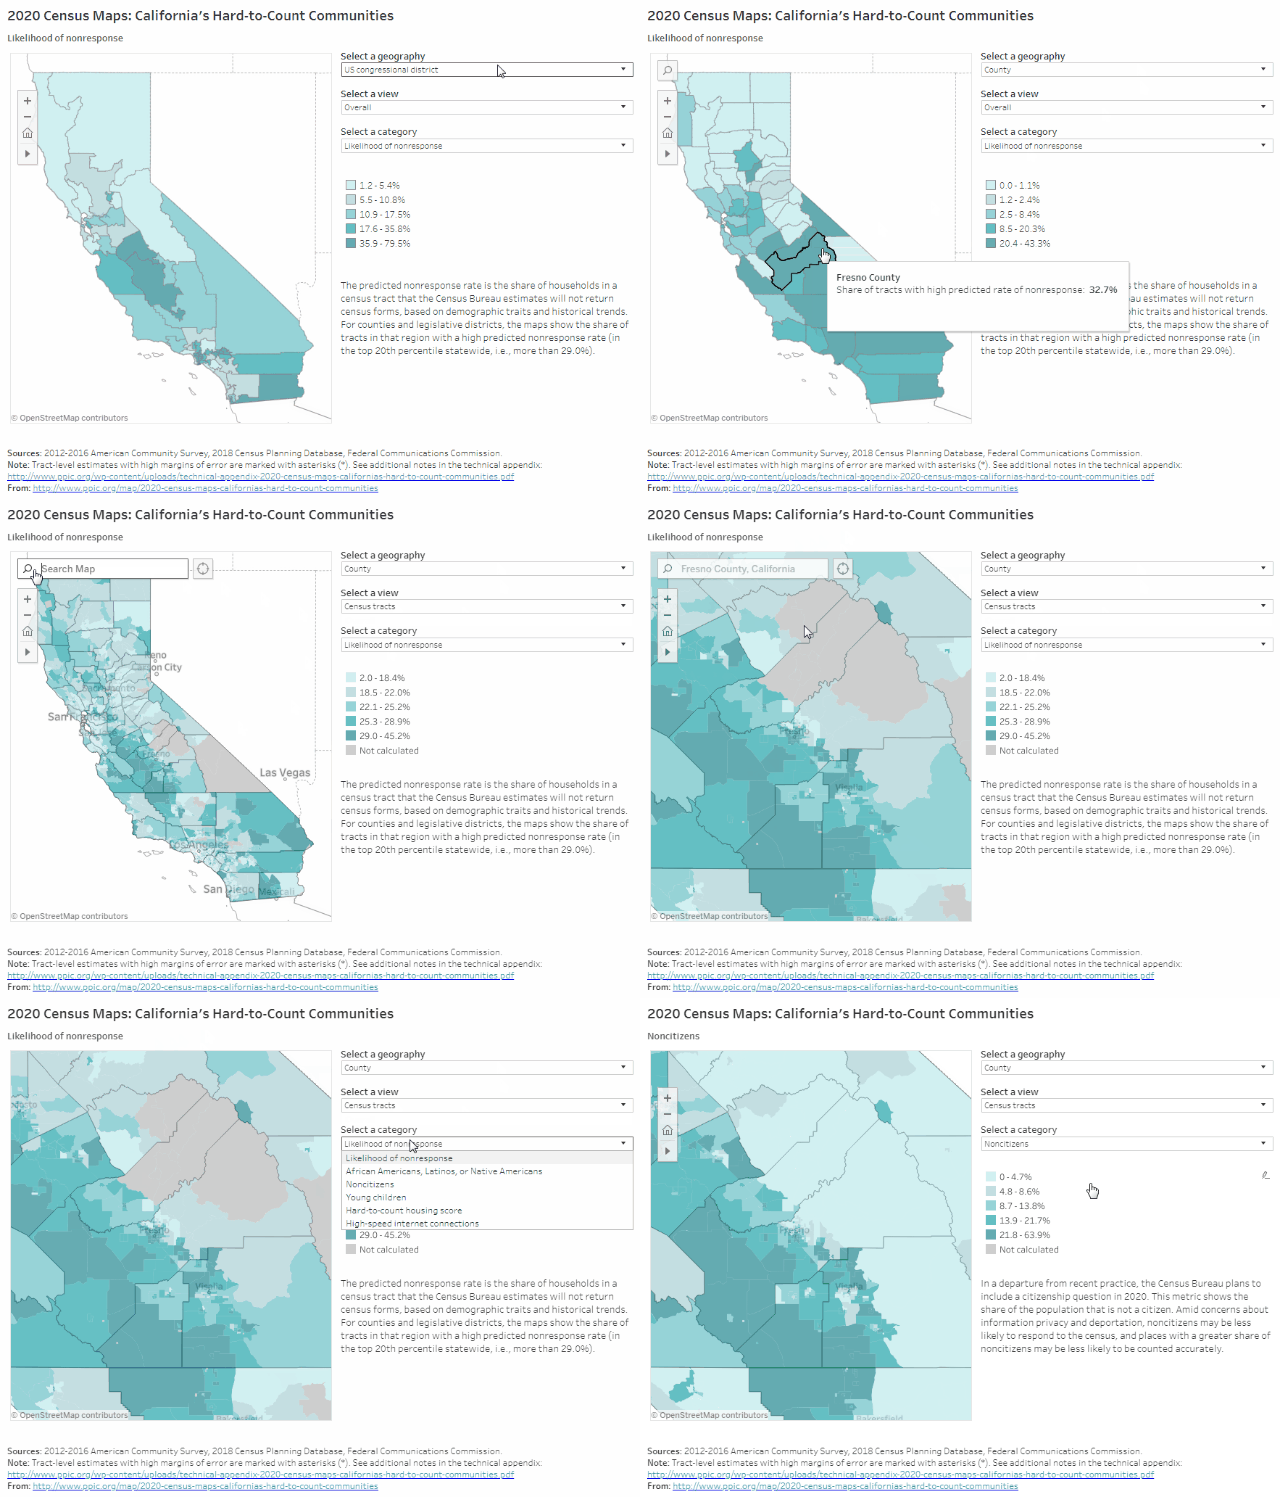
PPIC’s new interactive maps are an important tool for Californians working to ensure an accurate census count. They highlight hard-to-count communities across the state, providing an overall assessment of how hard an area will be to count and pinpointing reasons why certain areas may be hard to reach.

The overall assessment is based on an area’s “low response score,” a measure developed by the Census Bureau using historical trends. This score (what we call the “predicted nonresponse rate”) helps visualize a community’s vulnerability to being omitted from the census. However, it doesn’t capture all areas that will be hard to count in 2020, and it doesn’t indicate the underlying reasons why a community might be hard to count. PPIC’s new maps expand our understanding of hard-to-count communities in several ways.

As shown in the graphic below, the maps provide information for multiple geographies. First, you can select whether you want to see data by county, congressional district, state assembly district, or state senate district. Then, you can examine data for those broad regions or for individual census tracts. Zooming in allows you to identify which census tracts have the highest predicted nonresponse rates in a particular region.

In addition, by selecting different categories, you can get a sense of why these areas might be hard to count:

  • Does the area have high shares of people that are typically undercounted? Certain racial/ethnic groups—African Americans, Latinos, and Native Americans—and young children are historically undercounted in the census. Counties in the San Joaquin Valley and southern parts of California tend to have higher shares of these vulnerable populations.
  • Does the area have many noncitizens? The census is supposed to count all residents, but noncitizens may be less likely to respond in 2020 due to the planned addition of a citizenship question and concerns about privacy and deportation. Monterey County on the central coast has the highest share of noncitizens (22%), followed by Santa Clara County (18%) and Los Angeles County (17%).
  • Does the area have a lot of renters, overcrowded housing, and other factors that can make it hard for the Census Bureau to locate residents? To examine this issue, we created a housing score using data on renters and mobile homes. Seventeen counties in various regions of the state have scores indicating they may face particular challenges counting residents due to their housing conditions.
  • Does the area seem to have adequate internet access? The Census Bureau plans to collect the majority of responses online in 2020—a departure from its usual practice. We provide data on residential high-speed internet connections—a measure created by the Federal Communications Commission that does not include mobile data plans—as a proxy for service coverage. Rural areas are less likely to have residential high-speed internet access.

Overall, the maps show there are hard-to-count communities across the entire state—and regions have different risk factors for being undercounted. In addition, communities may be hard to count for multiple reasons: for example, low-income populations are more likely to live in hard-to-find housing like garages and trailers, and they are also less likely to have reliable internet access.

We hope these maps help local leaders determine the likelihood that their communities might not be accurately counted and provide guidance on targeting outreach efforts. Stay tuned for future posts that examine hard-to-count communities in specific regions of the state.

Nearly Half of the Working Poor Are Working Full Time and Year Round

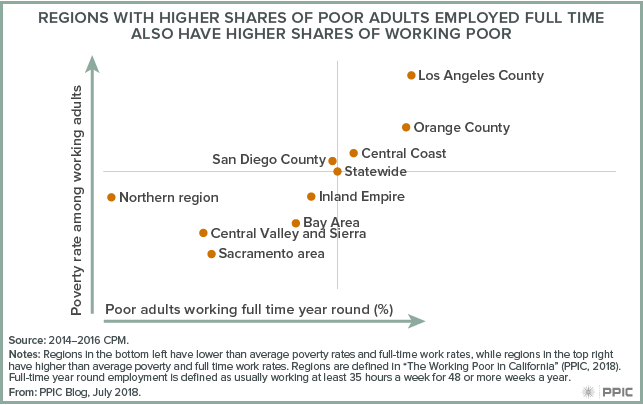
Roughly 2 million out of 16 million working Californians (ages 25‒64) live in poverty, according to California Poverty Measure (CPM) estimates—and nearly half (45%) of these workers are employed full time and year round.

We see a positive association between poverty rates and rates of full-time, year-round employment across regions. In other words, in areas of the state with higher shares of poor adults working full time—including Los Angeles and Orange Counties—the rates of poverty among working adults are also higher.

In those regions, working poverty is clearly not mainly attributable to working insufficient hours. It is driven by wage rates and other factors—measured in the CPM—like the cost of living, necessary expenses, and access to safety net resources (or lack thereof). For many of the working poor, the most promising strategies for improving wages require access to high-quality education and training.

Video: 2020 Census: What’s at Stake for California?

The decennial census plays an essential role in American democracy. The stakes are huge for California—the state stands to lose political representation and federal funding if there is a significant undercount—and 2020 is fast approaching. At a time when straightforward facts are in short supply, PPIC is providing essential, objective information about the importance of an accurate census count in California.

In this video, PPIC research director Sarah Bohn explains why the census is of particular importance to the Golden State this time around.

The Federal Farm Bill Could Affect CalFresh

The federal Farm Bill is due for reauthorization in Congress, but its fate is still uncertain—Senate and House versions differ substantially. The largest share of spending in—and the most contentious aspect of—the bill is the Supplemental Nutrition Assistance Program (SNAP), known as CalFresh in California. CalFresh is the state’s main food assistance program, helping nearly 4 million Californians afford groceries each month. The Senate bill leaves net SNAP funding largely unchanged. The House bill would trim costs significantly, in part by revamping work requirements and limiting state flexibility in setting eligibility guidelines. These changes, which would reduce the number of program recipients, are being proposed at a time when the SNAP caseload is declining nationwide, after growing substantially during and after the Great Recession.

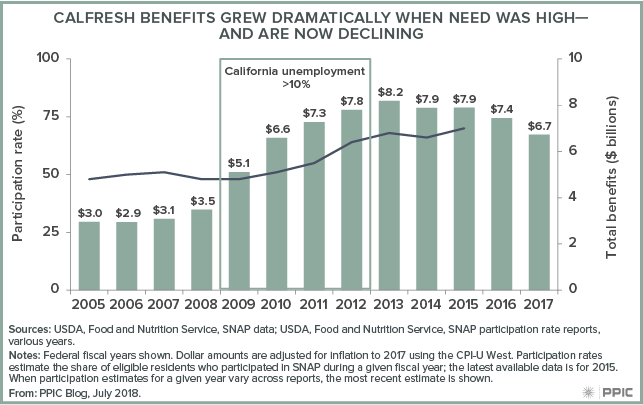
In California, policymakers have focused in recent years on getting more eligible Californians enrolled in CalFresh—the state had the lowest participation rate in the nation for a number of years. The share of those eligible who received benefits grew from about 50% to 70% between 2009 and 2015 (the most recent estimate)—but this improved participation rate is still near the bottom. Nonetheless, the California Poverty Measure estimates that CalFresh benefits kept more than 800,000 residents out of poverty in 2015.

Even as participation rates have been rising, decreases in demand are causing CalFresh benefit costs to fall—from $7.4 billion to $6.7 between 2016 and 2017 alone. Whether or not federal policies change, program costs are likely to continue to fall in the next year—unless the state enters a recession and the need for food assistance rises.

Emergency Departments and the Affordable Care Act

Coverage expansions under the Affordable Care Act (ACA) have resulted in a dramatic decline in the uninsured population in California. Much of the coverage gains have been driven by expanded eligibility for Medi-Cal, the state’s Medicaid program, which has seen a nearly 60% increase in enrollment since January 2014. With this large Medi-Cal expansion comes concerns about controlling costs, ensuring adequate access to care, and supporting the state’s health care safety net.

Monitoring how often people seek care in California’s emergency departments offers important insights—in part because frequent use can signal poor access to other medical care options. Hospitals in some parts of the state have reported growing demand for emergency care services in recent years. In a new study published this month in the journal Health Affairs, we examined emergency department use to understand how things have changed since the implementation of the ACA.

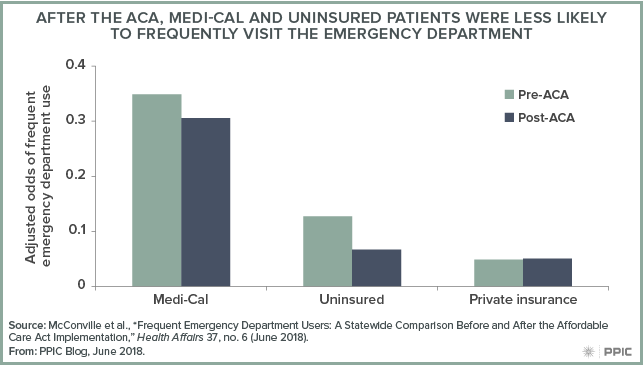
After controlling for factors such as patient age and health status, we found the odds of being a frequent emergency department user—with four or more annual emergency department visits—were significantly lower for Medi-Cal patients after the ACA. The odds of frequent use among the uninsured declined even more, while those with private insurance experienced little change. At the same time, however, there has been an overall increase in both the share and the absolute number of emergency department patients who are frequent users—despite the lower odds of frequent emergency department use after the ACA. We found that frequent users accounted for 7.9% of emergency department patients in the two years before the ACA, compared to 8.5% in the two years after.

Both before and after the ACA, the largest predictors of frequent emergency department use were having a diagnosed mental health condition or substance use disorder. This finding suggests state efforts to better integrate physical and behavioral health services for Medi-Cal enrollees could help lower frequent emergency department visits. Given that Medi-Cal is now the primary coverage source for more than two-thirds of frequent emergency department users, care plans managed by Medi-Cal will be a key player in efforts to manage emergency care moving forward.

In future work, we will be studying in more depth how changes in insurance coverage affected emergency department use across the state—with a particular focus on regions that saw the largest declines in their uninsured rates.

Single-Payer Health Care and the Governor’s Race

One issue that may prove decisive for Democrats in the 2018 governor’s race is single-payer health care. With the leading Democratic candidates supporting a single-payer system—and the leading Republican candidates in opposition—the race has shed light on the financial, political, and regulatory challenges associated with expanding health coverage across the state.

Last year, the state senate passed a bill (SB 562) that would establish a single-payer health insurance program to cover all Californians. However, the bill was shelved in the state assembly until further notice. According to estimates by the nonpartisan Legislative Analyst’s Office, the bill’s total annual costs would be about $400 billion. Democratic gubernatorial candidates Gavin Newsom and Delaine Eastin have been the most vocal proponents of single-payer health care and have publicly backed the bill. Democratic candidates Antonio Villaraigosa and John Chiang, while supportive of the idea, have expressed concerns over financing and implementation. Both the leading Republican candidates, John Cox and Travis Allen, strongly oppose single-payer health care and have emphasized the need for more competition in the marketplace.

With candidates’ differing positions, how are Californians feeling about single-payer health care today?

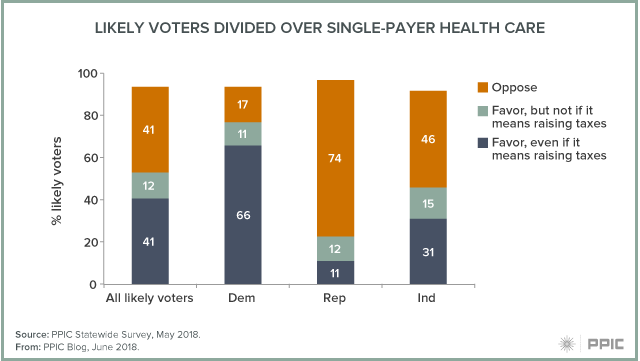
The May PPIC Statewide Survey found a majority of California’s likely voters (53%) favor a single-payer state plan. However, if this plan requires raising taxes, support declines to 41%. Across parties, an overwhelming majority of Democratic likely voters (77%) are in favor, while an overwhelming majority of Republicans (74%) are opposed; independent likely voters are divided (46% favor, 46% oppose). Notably, 66% of Democratic likely voters would favor a single-payer system—even if it means higher taxes.

The issue has become a litmus test for Democrats—pitting progressives against pragmatists—but, overall, Democrats express strong support for a single-payer system. Among likely voters who call themselves strong Democrats, 81% are in favor, compared to 69% who say they are not very strong Democrats. Among likely voters who call themselves strong Republicans, 83% are opposed to a single-payer system (the sample size for those calling themselves not very strong Republicans is too small for analysis).

Given partisan divides, the next governor may face significant political hurdles moving forward with single-payer health care. Coupled with statewide challenges, California would need to collaborate with the federal government to implement such a system. In consideration of these factors, the June primary is an opportunity for Californians to determine their future leadership and the state’s policy directions—including a possible step toward single-payer coverage.