How the Census Affects State Finances

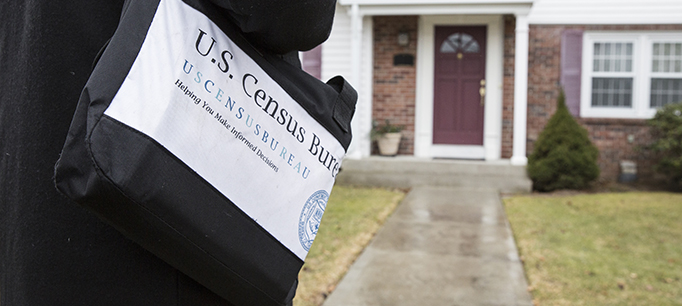
The US Constitution requires a decennial census for the purposes of determining how many seats each state will have in the House of Representatives. Just as critical, a number of federal programs rely on census data to calculate the share of federal dollars distributed to each state. In the case of California, the census-connected funds are big money. Undercounting Californians in the upcoming census could have significant fiscal consequences for the state.

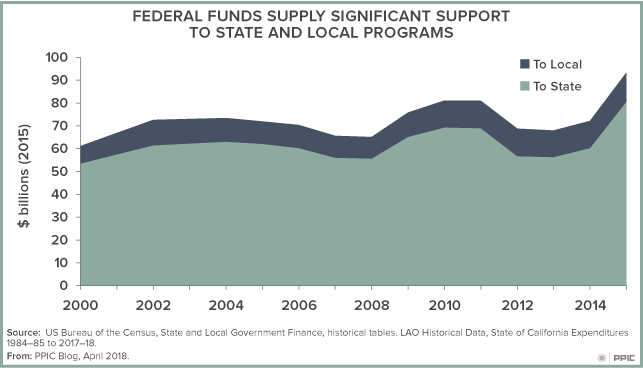
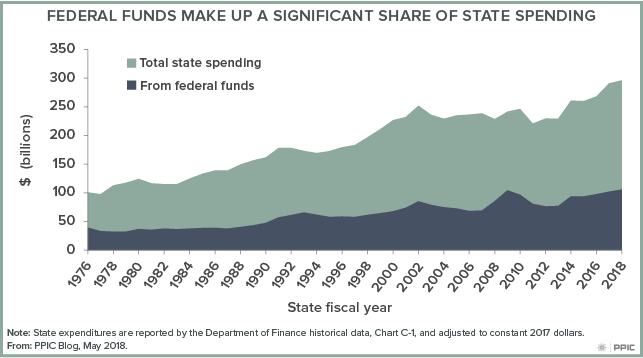
Federal dollars account for more than one-third all state spending (including the general fund, special funds, and bonds). This translates into more than $100 billion in state spending derived from the federal government.

Not all federal programs rely on the census to determine the distribution of dollars, but the vast majority are connected to it in some way. One study estimates that 132 federal programs rely on census data to distribute more than $675 billion. Another estimates the share of census-related funding for the largest programs for each state. For California, that amount was $77 billion, or more than 80 percent of the federal funds the state received in 2015 (the most recent estimate available).

Given the dollars at stake, getting an accurate count of California’s residents is critical—but could be a challenge since large segments of California’s population are historically difficult to count.

But population counts alone do not determine funding, so it is difficult to precisely forecast the impact of an undercount. Compounding the difficulty, the way federal programs use census data to allocate dollars varies, and in some cases, involves other factors such as the relative wealth of the state. For example, a significant share of census-related dollars are determined by a specific federal reimbursement rate. Because California already receives the minimum rate, an undercount would not reduce the amount of federal dollars that the state can count on.

Finally, the use of the census to distribute dollars is, in some cases, a zero-sum-game. For California to avoid “losing” relative to other states, it needs to count as well, or better, than the rest of the country. Other large states—notably Texas and Florida—face similar challenges.

California’s creation of a state committee to ensure an accurate count—along with funding to support such efforts—are crucial to a successful outcome. In fact, a relatively modest investment has the potential to provide enormous returns to the state.

Video: Preparing California for the 2020 Census

The 2020 census will be a defining moment for California. Much is at stake—including billions in federal funds and the state’s political representation in the US Congress. The lasting impact of an undercount can’t be overstated. Governments, K–12 and higher education institutions, businesses, and nonprofits depend on the census to understand the needs of their communities, target services, and plan for the future.

A panel of experts discussed the critical role of the decennial census at a PPIC event in Sacramento on April 24. They examined the challenges of reaching “hard-to-count” communities, the state’s part in ensuring an accurate tally, the impact of the recently-added citizenship question, and more.

The event opened with a wide-ranging conversation between Marc Berman, state assembly member, and Mark Baldassare, PPIC president. One of Berman’s biggest concerns is that California could lose its political clout in DC. The state has “40 million unique stories,” he said, and the census is about “making sure that every voice” gets counted. But the new citizenship question is counterproductive, in his view. We know that adding it “will discourage a lot of people from participating,” he said. “People are so fearful” that it could make a successful census count that much more difficult, he added.

For the first time, the US Census Bureau will try to collect most responses (55%) online, with the rest obtained by mail or in person. John Thompson, former director of the bureau, identified the government’s main rationale for the change—namely, cost. He also detailed best practices for adding a new census question: In the past, he said, the bureau would spend years testing it, partly to craft appropriate messaging and to ensure that residents were comfortable answering it. The new citizenship question did not have that review, a concern Thompson raised with Commerce Secretary Wilbur Ross to no avail.

John Dobard, associate director of political voice with Advancement Project California, discussed ways to involve the state’s hard-to-reach communities. One way to overcome residents’ fear of participation, he said, is to involve trusted leaders in outreach. Otherwise, entire multi-generational immigrant families could be left out.

An undercount could mean a direct hit to essential state services—such as the Children’s Health Insurance Program. In that scenario, young children in poverty would be hurt most of all, said Sarah Bohn, a panelist and PPIC research fellow.

Ditas Katague, the state’s 2020 census director, said her office is steeped in planning for the statewide rollout. Importantly, she said, California needs an “agile, flexible ground team,” and called on citizen volunteers to join state and local agencies, nonprofits, and philanthropic groups to help make that happen.

Federal Funds and California’s Budget

California receives a lot of direct funding—more than $100 billion—from the federal government. Should federal officials make changes to the programs that provide these funds, the state would feel the impact quickly, with the most vulnerable Californians bearing the brunt. As lawmakers begin to work on the state budget in earnest, there is less certainty surrounding the contribution of federal funds than in prior years.

Governor Brown’s current budget proposal estimates that federal support will contribute about $106 billion dollars to state and local programs (a large share of the funds “pass through” state departments and are distributed to counties, school districts, and other entities). That would represent a record amount.

In the past, federal revenue to California hovered between $70 and $80 billion. After implementation of the Affordable Care Act (also known as Obamacare), the total level of federal assistance to the state rose beyond the $100 billion mark—mainly because of the expansion of Medi-Cal.

Though it is the largest, Medi-Cal isn’t the only state program that relies on the federal government for a significant share of total revenue. From CalTrans to the California Department of Education, billions of federal dollars provide support for state and local efforts.

Today, relying on that federal revenue could be hazardous. The Trump administration and congressional Republicans have expressed an interest in making significant changes to key programs. For instance, food stamps—known by its federal moniker as Supplemental Nutrition Assistance Program (SNAP) and as CalFresh here in California—may look very different over time. Trump’s proposal limits the ability of recipients to choose which foods they can purchase, claiming that these limitations will save money. These purported savings underpin a proposed 30% overall cut to the program over the next decade.

Should funding for these programs be cut, California—as the nation’s largest state—would bear the greatest dollar reduction. And the state’s poorest would feel the greatest impact. PPIC research has found that the state’s social safety net programs often spell the difference between being in or out of poverty for hundreds of thousands of residents. For example, CalFresh moves 800,000 people out of poverty.  The impact of CalWORKs—the state’s welfare program—is smaller, but significant (400,000 moved from poverty). The effect of funding reductions today could be amplified in the next recession, when unemployment rises, incomes fall, and more people seek these benefits.

In the past, California, like other states, could look to the federal government as a reliable source of revenue for many of its programs, especially those making up the social safety net. In fact, the federal government has even served as a partial fiscal buffer during economic downturns, increasing spending when state generated revenues fell. The state, however, cannot take the level of federal support as a given and, for now, will have to navigate in an environment of fiscal uncertainty, particularly with regard to programs that serve the poor. In this budget building season, state leaders will need to consider how best to cope with the possibility of reduced federal assistance in the immediate future.

Expanding Health Care Coverage for Undocumented Immigrants

As efforts to create a state-based single-payer health system confront complex questions of costs and federal uncertainty, advocates and state lawmakers are pushing forward with incremental policy measures to expand access to health coverage. The largest group of Californians that remain without comprehensive health insurance are undocumented immigrants, who were largely excluded from the coverage expansions created by the Affordable Care Act. Estimates suggest that almost 60% of uninsured Californians are undocumented.

Today, the Senate Health Committee is holding a hearing on SB 974 (Lara), which would allow all income-eligible California residents, regardless of immigration status, to enroll in comprehensive coverage through Medi-Cal (the state’s Medicaid program). California has already extended Medi-Cal coverage to undocumented children under 19, who have been eligible for comprehensive health benefits since May 2016. At the end of last year, nearly 220,000 undocumented children were enrolled in Medi-Cal, with costs estimated at $280 million in the recent fiscal year’s budget. No cost estimates are available yet for covering undocumented adults. But comprehensive coverage for the undocumented population must come from state funds, since federal Medi-Cal funding can only be used to support emergency services for undocumented immigrants.

In previous research, we estimated that about half of California’s undocumented population would likely qualify for Medi-Cal based on their income levels if restrictions on immigration status were removed. But this varied across regions. In Los Angeles County and parts of the Central Valley, more than half of undocumented immigrants had incomes below the Medi-Cal eligibility threshold of 138% of the federal poverty level, or FPL ($34,600 for a family of four). Bay Area counties had lower shares of income-eligible undocumented immigrants.

Currently, undocumented adults rely on the health care safety net—including community clinics, public hospital systems, and emergency departments—to access needed medical care. These providers play an integral role in caring for both those that remain uninsured and those covered by our vastly expanded Medi-Cal program. As policymakers consider ways to expand comprehensive health coverage, it is important that they continue to support the state’s safety net providers.

The 2020 Census Is Critical for California

The decennial census plays an essential role in American democracy. Most fundamentally, it ensures that communities get the right number of representatives in government. Less well known is the role it plays in determining how hundreds of billions of federal dollars are allocated to states and localities for a wide range of public services, including health care and child nutrition programs.

Although census information is essential, the Census Bureau is currently budget constrained, behind schedule, and scaling back the number of full-scale test runs it was planning. This is of particular concern since several key changes to the census process are in the works: the majority of census information will be collected online, resources for door-to-door outreach may be reduced, and a question about immigration status will be added to the official questionnaire. These and other factors increase the potential for an undercount, especially among vulnerable populations. Just today, California Attorney General Xavier Becerra has filed a lawsuit over this issue.

Why are the stakes so high? A significant undercount could cost California political representation in Congress at a time of record polarization and a deep partisan divide over the direction of the state and the nation. Critical decisions that affect California’s future will be determined to a large extent by federal rules on such issues as climate change, health care, and immigration.

An undercount also means that an important amount of federal funding could dry up. Federal, state, and local government programs that target disadvantaged neighborhoods or populations rely critically on census surveys to identify those in need and distribute funds accordingly. For example, two programs crucial to the health and well-being of children in California—the Children’s Health Insurance Program and the Women, Infants, and Children program—rely on population estimates that use the decennial census count as a baseline for population estimates with which they aim to accurately allocate funds across states.

The impact on California could be huge—and 2020 is fast approaching. At a time when objective facts and information are in short supply, PPIC will be working to raise awareness about the importance of the 2020 Census for California and motivate elected leaders and organizations across the state to work together to ensure an accurate count. Stay tuned for more facts and analysis of the 2020 Census from PPIC.

Testimony: Safety Net Plays Key Role in Reducing Poverty

Sarah Bohn, research fellow at the Public Policy Institute of California, testified today, February 14, 2018, before the Senate Budget and Fiscal Review Committee, Informational Hearing on Human Services. The topic of today’s hearing: poverty and social safety net programs. Here are her prepared remarks.

Poverty is high in California, and it has not improved as much as the economy has in recent years. In fact, California’s poverty rate is highest in country, according to our estimates. Throughout this presentation, I will rely on the California Poverty Measure research (a joint effort between PPIC and Stanford) that accounts not only for earnings but also for benefits from major safety net programs and the cost of housing to give a comprehensive, accurate, and state-specific account of the resources families have on hand to meet their basic needs.

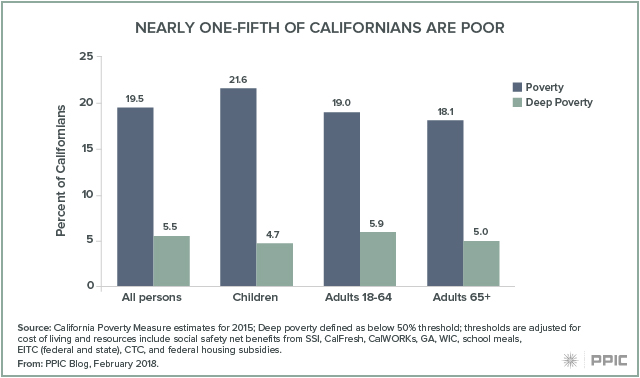
We find that 19.5% of Californians were poor as of 2015—that means 7.5 million people living below a basic needs threshold (less than $30,000 in total resources for a family of four). The poverty rate is slightly higher for children at 21.6%. In addition, 5.5% of Californians are in deep poverty—which means they have less than half of what it takes to meet basic needs, or about $15,000 annually for a family of four. Overall, the share of Californians in poverty remains higher than it was before the last recession started and is relatively high by historical standards.
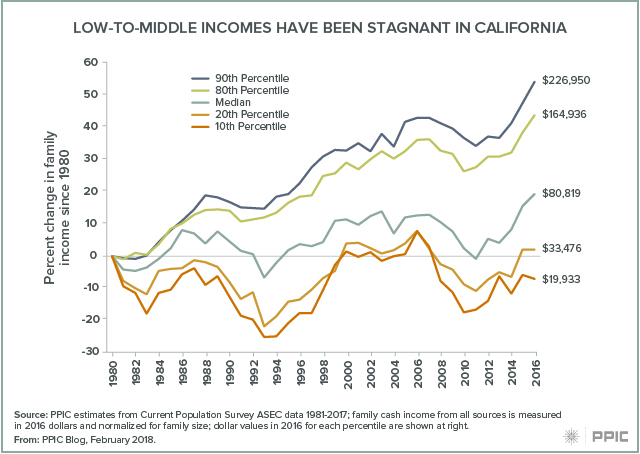
To understand why, providing a long-term picture of how all Californians have fared is helpful. For the bottom half of California families, income has been quite stagnant for at least the past three decades. The bottom 10% are earning less than they were in 1980 (about $20,000) and the bottom 20% are earning just 4% more.  Compare that to the top 10%, which are earning 54% more than they did in 1980.  Much of this is driven by how economic opportunities (especially in the labor market) have changed and polarized – generating both high rates of poverty and high income inequality.
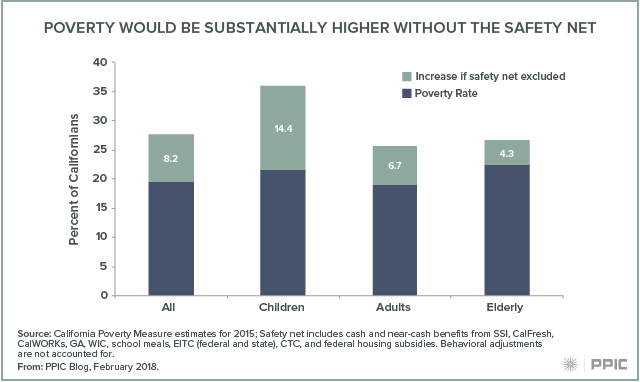
How does this relate to the safety net? With stagnant earnings since 1980, safety net resources become an even more important factor in making ends meet as cost of living increases. Our estimates show that major safety net program benefits play a critical role in mitigating poverty. The California poverty rate would be 8 points higher were it not for these programs—that means an additional 3.1 million Californians would be in poverty. The deep poverty rate would more than double were it not for the safety net.
Looking specifically at CalFresh, CalWORKs, and SSI—the programs we’re focusing on today—we estimate that a large number of Californians are moved out of deep poverty or poverty because of the program benefits they or their family members receive.
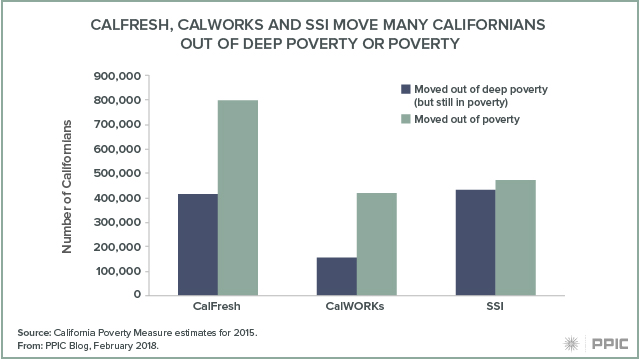
Specifically, CalFresh moves 400,000 people out of deep poverty; 800,000 are moved out of poverty.  The numbers are a bit smaller for CalWORKs families (150,000 from deep poverty and 400,000 from poverty), in part because the program reaches fewer families. And finally, SSI moves about 400,000 out of deep poverty and about the same number out of poverty. Keep in mind that families on these programs may be far from the poverty line, so even if they are not technically moved out of poverty, program resources can still be an important way for them to meet basic needs. Families may also benefit from multiple programs in combination.

The safety net plays a critical role in helping make ends meet but income from work is still the biggest component of family resources, even for families in poverty. And as we saw over the long term, the trend in income alone is not positive for families in the bottom half of the income distribution. So in addition to helping families manage in the short term, ideally social safety net programs could contribute to mobility over the long term, counteracting the trend in income inequality. However, one factor limiting the potential impact of safety net resources is the high cost of living in California, driven mostly by housing but also other living expenses like child care and medical costs.

After we consider these other expenses, we end up with poverty rates that are high compared to other states and high within and across California as well.  This is what the poverty looks like across a number of demographic characteristics.
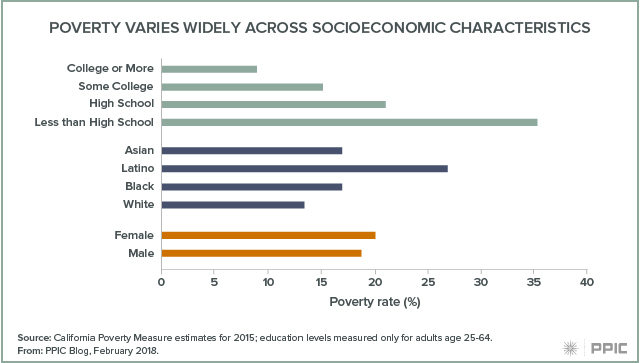
You’ll notice that the incidence of poverty varies the most across education levels (and here we’re only looking at adults age 25–64 who’ve had enough time to acquire education). Men and women are about equally likely to be in poverty. Latinos in California are twice as likely to be poor as white residents (27% vs. 13%), and black and Asian residents fall in between.

Across the state, poverty varies considerably. The highest rate is in Los Angeles, at 25% (with Santa Cruz and Santa Barbara close behind). The lowest is in Placer County at 13% (nearby Sierra counties of Alpine, Mariposa, and others have similar rates).
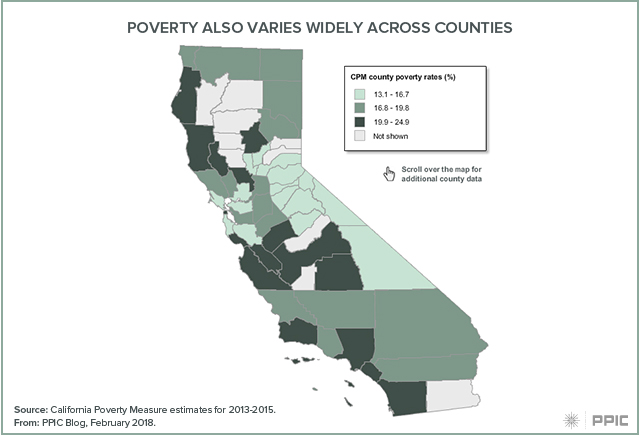
As we all see day to day, poverty is concentrated much more narrowly than at the county level—sometimes it varies neighborhood to neighborhood. In fact, we find that the highest and lowest rates of child poverty in the state are in neighborhoods of Los Angeles that are just 20 to 30 miles apart. Similar differences can be seen in neighborhoods across the Silicon Valley. The concentration of poverty raises concerns that there are other factors about places—beyond just income level—that diminish the chances for residents to get ahead.
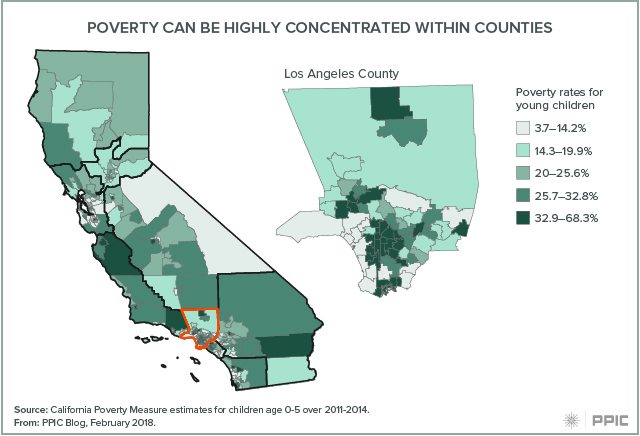
This map is surprising because it does not track one-for-one with unemployment or other economic indicators. Access to good-paying jobs is the number one factor in preventing poverty. But it is not sufficient because the cost of living (housing, child care) looms large—and those expenses tend to be higher in exactly the places where unemployment is lower and wages higher, making it hard to make ends meet even with a full-time job. High living expenses coupled with the long-term stagnation in low to middle incomes yields the high rates of poverty we see today even with very low unemployment rates.

In this context it is critically important to be aware of the role social safety net programs play in helping Californians make ends meet—as I mentioned the poverty rate would be 40% higher were it not for major means tested programs in California.  Nonetheless, California has the highest poverty rate in the country—even with a booming economy—so it is exactly the right time to discuss where the safety net falls short and what needs to be done.
Video: John Chiang’s Priorities

John Chiang, the state’s treasurer and a candidate for governor this year, was asked last week to name the top three issues that will make the most difference for the state’s future. The question is the first one Mark Baldassare, PPIC president and CEO, asks of all gubernatorial candidates appearing before PPIC audiences. Chiang said his priorities are

  • Education
  • Housing
  • Jobs, climate change, health care—issues Chiang lumped together as the “things that are absolutely critical in everybody’s life.”

Chiang praised Governor Jerry Brown for the state’s K–12 finance formula that targets extra resources toward lower-income students, English Learners, and those in foster care. He said he would target more money toward students with special needs.

Referring to the state’s housing situation as an “extraordinary crisis,” Chiang said that even if an affordable housing bond measure passes in November, the state will need to return to the voters to get more money. He advocated reviving local redevelopment agencies, which the governor eliminated in 2011, to give local governments an economic tool to build housing.

Chiang referred to his background as treasurer, state controller, and member of the state Board of Equalization in emphasizing the need to ensure a way to pay for proposals such as single-payer health care—an idea he said he favors in concept. While describing the current system as inefficient, he said that the state can’t achieve single payer health care immediately. How long will it take? Chiang said more clarity from the federal government is crucial to understanding what the state can afford. “Let’s build what we can build. We don’t have to build a mansion at the beginning. Let’s build a starter house.” Chiang also said that the state needed to figure out how to insure an additional 2.9 million Californians who are currently uninsured.

The conversation with Chiang is part of the PPIC Speaker Series on California’s Future. PPIC is inviting all major candidates for governor to participate if they reach a certain threshold in the polls. The goal is to give Californians a better understanding of how the candidates intend to address the challenges facing our state.

Watch all candidate videos


Examining the Federal EITC’s Impact on Poverty

The federal Earned Income Tax Credit (EITC) plays an important role in keeping Californians out of poverty. The credit supplements earnings for low-income workers at tax time, providing $2,400 on average to qualified tax filers.

Without the EITC, we estimate an additional 814,000 Californians would live in poverty, according to the latest data from the California Poverty Measure (CPM), an ongoing collaboration between PPIC and the Stanford Center on Poverty and Inequality. This reduction in poverty makes the EITC nearly comparable to CalFresh (formerly known as food stamps), the safety net program that keeps the most Californians out of poverty. Our estimates reflect data from 2013 to 2015 and do not include the state EITC, which was introduced in 2015 and expanded in 2017. The state EITC lowers poverty by very little because the largest credits go to workers with very low earnings, whose families mostly live well below the poverty line.

The role that the EITC plays varies widely across regions. Statewide, the poverty rate would be 2.2 percentage points higher without the EITC (22.6% instead of 20.4%). But in Lake and Mendocino Counties (combined), the poverty rate without the EITC would be 4.1 percentage points higher than it is currently, reaching 26.8%. Poverty in Marin County, on the other hand, would increase only 0.2 points, to 16.5%. Such differences could be due to several factors—for example, the share of eligible families who take advantage of the credit and the local availability of jobs.

PPIC recently released data showing poverty rates, poverty thresholds, and the effects of safety net programs not only by county, but also by state assembly and senate district and by US congressional district. These data provide an opportunity to dig more deeply into the varying roles of safety net programs across the state.

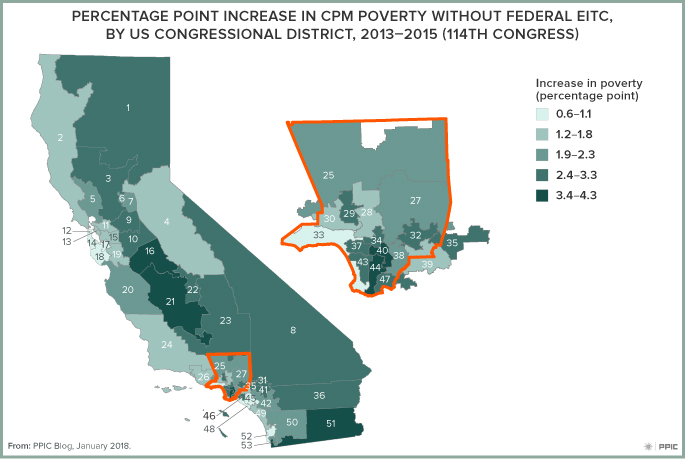
The EITC, for example, has the largest effect in some of the highest-poverty congressional districts, including District 40 (Rep. Roybal-Allard) and District 44 (Rep. Barragán). But in some relatively high-poverty districts it plays a smaller role (District 46, Rep. Correa). The data we provide can be a starting point for investigating—and potentially remedying—incomplete access to the EITC.


Legislative District Data Offers Close-Up View of Poverty

Poverty varies widely across California’s 58 counties—from 13.1% in Placer County to 24.9% in Los Angeles County—according to data from the California Poverty Measure (CPM). The CPM is an ongoing collaboration between PPIC and the Stanford Center on Poverty and Inequality that adjusts for differing housing costs across counties and incorporates major social safety net programs like CalFresh food assistance and the Earned Income Tax Credit (EITC).

For the first time, PPIC recently released CPM data showing poverty rates and the effects of safety net programs not just for counties, but also for state assembly and senate districts and US congressional districts.

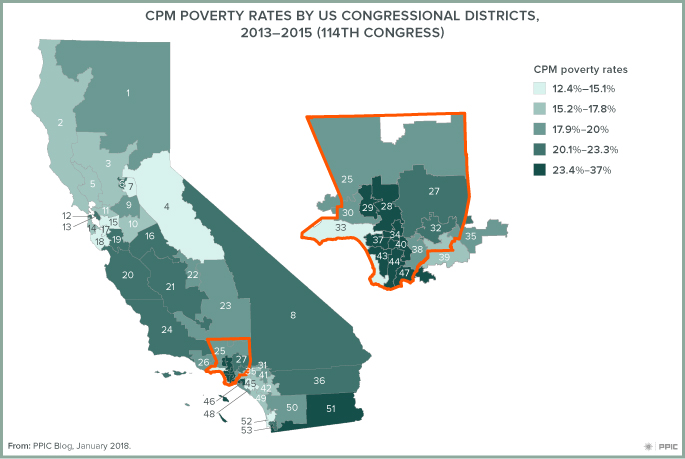
Congressional districts provide a more detailed view of densely populated areas. While counties have static geographic boundaries, California’s congressional districts are adjusted after every decennial census to equalize their populations (in 2010, each of the 53 districts contained 702,905 people). This means that Los Angeles County’s 9.9 million residents, for example, vote in 18 different congressional districts. The county’s average poverty rate of 24.9% reflects both the 13.4% in poverty in District 33 and the 37.0% in District 40, a stark difference illustrated in the map below.

As might be expected, district-level data show even wider geographic variations in poverty than county-level data, from 12.4% in District 15, which includes parts of Alameda and Contra Costa Counties, to 37.0% in District 40, in Los Angeles County. The CPM also shows that without safety net programs, the variation would be even more extreme, ranging from 16.2% in District 33 to 50.3% in District 40.

While counties often take the lead in implementing programs that mitigate poverty, many funding decisions related to social safety net programs are made at the state and federal levels. Understanding the distribution of poverty can help policymakers at all levels develop short- and long-run strategies to alleviate it in every area of the state.

More than a Million California Children Rely on CHIP

Some 1.3 million Californians age 18 and under—about 13% of the state’s children—rely on the Children’s Health Insurance Program (CHIP) for their health coverage. Federal funding for CHIP expired on September 30 when Congress failed to reauthorize the program. While both the House and Senate have proposed bills that would reauthorize and fund the program for another five years, other legislative priorities and a deep partisan divide have complicated their passage.

In the last few months, some states, including California, have received additional CHIP funding from the federal government to maintain their current programs. But according to the state’s Legislative Analyst’s Office, California will likely run out of CHIP funds by the end of the year in the absence of federal reauthorization.

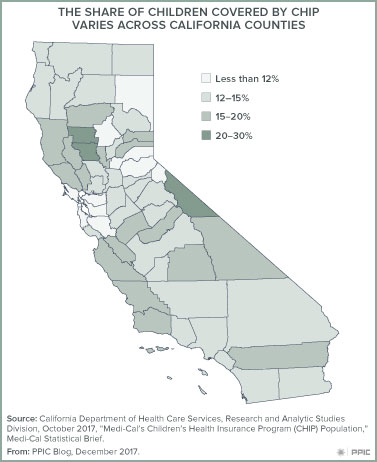
As of May 2017, a quarter of the more than 5.2 million California children covered by Medi-Cal (the state’s Medicaid program) are funded through CHIP. More than 300,000 children in Los Angeles County, over 100,000 children in Orange County, and another 100,000 in San Diego County rely on the program. In a few small counties (such as Glenn, Colusa, and Mono) more than 20% of children are covered under CHIP (see figure). Some counties in the Central Valley (Merced, Madera, and Tulare) and the Central Coast have 15– 20% of children covered by CHIP, while most Bay Area counties have relatively low shares (less than 12%).

Created in 1997 by federal legislation, CHIP provides federal matching funds to states to insure children with family incomes too high to qualify for Medicaid but too low to afford private insurance. In 1998, California established a new program under CHIP called the Healthy Families program, which covered children with family incomes above the Medicaid eligibility threshold and below 250% of the federal poverty level. In 2013, the state transitioned children from the Healthy Families program into Medi-Cal. Under current state law, children with family incomes up to 266% of the federal poverty level (about $65,500 for a family of four) are eligible for Medi-Cal coverage.

Under the Affordable Care Act, states received an enhanced federal matching rate for their CHIP programs that started October 1, 2015 and was supposed to extend until September 30, 2019. California’s enhanced federal matching rate increased the share of CHIP costs covered by the federal government from 65% to 88%. According to Medi-Cal estimates for the 2016–17 state fiscal year, the CHIP component of Medi-Cal cost about $2.6 billion, with federal funds covering about $2.3 billion.

The 2017–18 enacted state budget assumed California’s CHIP matching rate would drop back to 65%, resulting in increased state General Fund spending of about $400 million. While congressional proposals currently under consideration maintain the enhanced federal matching rate through 2019, it remains uncertain how the federal reauthorization process may play out and what impacts that could have on California’s CHIP funding.