Will the Governor’s Budget Reduce the Heat on School Districts?

Last week Los Angeles district leaders reached a deal with public school teachers to end the city’s first teachers’ strike in 30 years, agreeing to higher teacher salaries, smaller class sizes, and more support staff. The strike was the culmination of long-brewing tensions over the amount and allocation of funds in California’s largest school district. Many other districts in the state are facing similar challenges, as the demand for resources grows faster than the available dollars.

Earlier this month, the governor’s first budget proposal acknowledged some of these broader difficulties. The 2019–20 spending plan proposes $3 billion in one-time payment to CalSTRS, the main teachers’ retirement system, on behalf of schools (separate from the General Fund K–12 spending determined by Proposition 98). The proposal also includes $1.1 billion to pay down a portion of the state’s share of the estimated CalSTRS liability.

The proposed $3 billion CalSTRS payment could take some financial pressure off school districts. Funding for schools is determined by two main formulas. First, total statewide funding is determined by applying a formula (Proposition 98) to the expected revenue from state and local property taxes. Then, another formula (the Local Control Funding Formula) is used to determine the bulk of the dollars available to individual school districts.

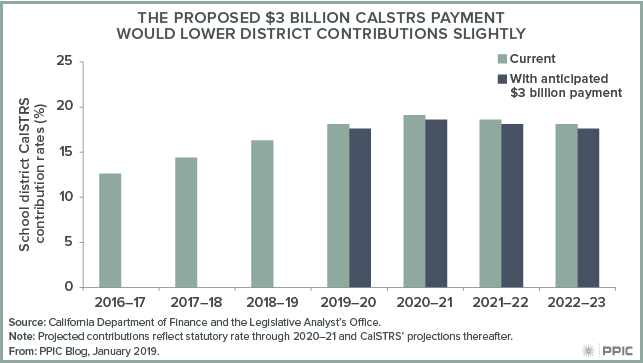
Distributing resources in this manner means local school districts, even one as large as Los Angeles, have limited control over the total amount of dollars they have to work with. But the demand for those dollars is constantly going up as districts find themselves paying more—overall and in particular areas such as special education services, health care premiums, and pensions. Pensions are especially challenging, as legislation passed in 2014 mandated that school districts’ share of teacher pension contributions would rise from 8% (2013) of their teacher payrolls to 19% by 2020. This increase will drive annual pension contributions to more than $1,000 per student in most local school districts.

How much relief might the governor’s proposed payment provide? The answer is some, but not much. The governor’s budget document states that the payment “will reduce the out-year contribution rate by half a percentage point.” Given that number, the expected relief amounts to an annual savings of around $25 per student. In large districts such as Los Angeles, this adds up to tens of millions of dollars annually, but districts with lower enrollment numbers will see more modest financial gains.
The CalSTRS payment proposal is a departure from prior state budgets. First, it represents an acknowledgment that, despite recent increases in total education spending, school districts still face fiscal challenges. Second, it proposes to direct non–Proposition 98 funds, making it a de facto increase in total K–12 resources. School district administrators are likely to appreciate both. However, the proposal still needs the legislature’s approval, and it’s not clear whether it would significantly relieve fiscal pressures on districts.

Whether the one-time CalSTRS payment represents a shift in future policy remains to be seen. If it is in fact only a one-time payment, the impact on the resources available to schools will be welcome but modest. It may, however, signal a different approach to education funding in the long run—something that would be worth watching.

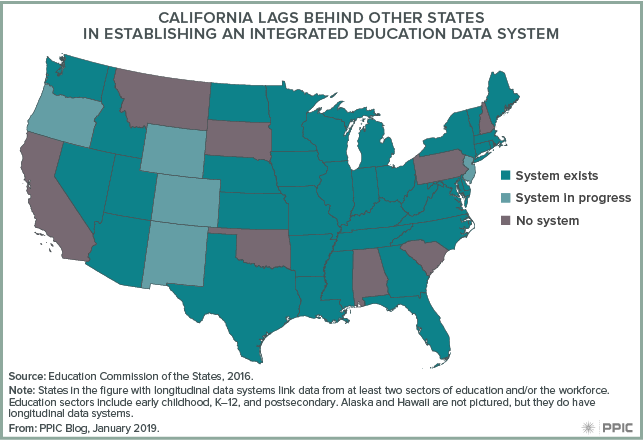
One Step Closer to a Statewide Educational Data System

Governor Newsom’s recently proposed budget includes $10 million in one-time funding for the planning, creation, and implementation of a statewide longitudinal data system—including early childhood education, K–12, higher education, the workforce, and health and human services. As we wrote in a recent PPIC report, this idea holds a lot of promise. An integrated data system could allow for improved feedback for educational institutions, more efficient use of public funds, and better evaluation and coordination for the state. The idea also has support in the state senate, where Senators Glazer and Allen proposed a similar system (SB 2) last December.

Each public education system—K–12, the community colleges, California State University, and the University of California—already recognizes the importance of data. They all collect, store, and analyze data on students within their respective systems to improve instruction and outcomes. However, few connections are ever made between educational sectors. Even though a high school senior may graduate from a K–12 school, attend a community college, and then transfer to a UC, data isn’t shared across those systems in any systematic way. So each system has no idea if students are successful in the next stage of their academic career. California is one of the few states that does not follow students across sectors.

The governor’s budget summary also suggests that the data system could be used to improve K–12 measures of career and college readiness. Current measures are based on high school test scores and high school course-taking. But connecting K–12 data to higher education and employment data could lead to more meaningful measures of whether students are able to take and succeed in college-level courses, or whether they work in a job with a living wage.

With the Newsom administration’s support, California may be closer than ever to establishing a data system that can answer key questions about how students move along the educational pipeline. Creation and implementation will involve security, privacy, and governance challenges, but California has 42 other states that can serve as models. This is a much-needed first step in helping the state develop effective policy solutions that will improve students’ progress through school and into the workforce.

Californians’ Priorities for Their New Leaders

California enters 2019 with Democratic super-majorities in both chambers of the state legislature and a Democratic governor replacing another for the first time in more than a century. What do Californians want state leaders to prioritize? Although the state is projected to have a budget surplus of $21 billion, many are pessimistic about the state’s short- and long-term economic prospects. These economic concerns are possibly linked to Californians’ policy and spending preferences, and they are likely to inform their attitudes toward the governor’s recently released budget proposal for the next fiscal year.

According to the December 2018 PPIC Statewide Survey, fewer than half of Californians (46%) say the state will have good times financially in the next 12 months. The share of adults holding this view hasn’t been this low since October 2014 (45%).

About one in three (32%) also say California will be a worse place to live in 2025, and 50 percent think children growing up in the state today will be worse off financially than their parents.

When asked what the state government’s most important priority should be in planning for California’s future, 39% of residents say it should be improving jobs and the economy. In the shorter term, what issues should state leaders prioritize in the coming year? Findings from the December survey offer some possible answers.

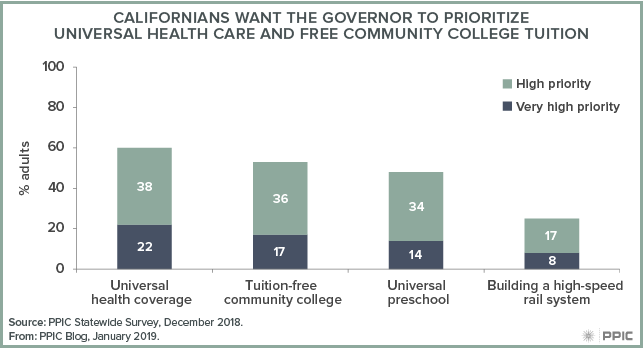
When asked what they would prefer to do with a projected budget surplus, a majority of Californians (57%) say they’d like to increase state funding for education and health and human services. When asked about several potential policies—most of which Governor Newsom highlighted during his campaign—majorities of adults say universal health coverage (60%) and tuition-free community college (53%) should be top priorities for new state funding. Fewer than half (48%) say the same about universal preschool, and one in four (25%) want to prioritize high-speed rail.

These findings underscore Californians’ preferences for programs that can help reduce economic uncertainty. They also indicate that Californians’ priorities are aligned with Governor Newsom’s budget proposal for the next fiscal year. The governor’s budget includes funding for an expansion of Medi-Cal coverage to young adults regardless of immigration status, a second tuition-free year at community college, and steps toward universal preschool for income-eligible four-year old children.

Over the next five months, as the governor and state lawmakers work toward a final budget, Californians will have the opportunity to voice their opinions. Stay tuned to the PPIC Statewide Survey as we track Californians’ attitudes toward new leaders and key policy issues.

Video: Californians and Their Government

As Governor-Elect Gavin Newsom prepares for his first term, half of Californians think he should take a different policy direction than Governor Brown. Four in ten approve of Newsom’s plans and priorities—while three in ten don’t yet know enough to have an opinion. These and other key findings of the latest PPIC Statewide Survey were outlined by Dean Bonner at a Sacramento briefing last week.

The survey asked Californians about four major policy areas that were highlighted in the governor’s campaign. Most see universal health coverage and free community college as top priorities, while fewer see universal preschool as a high or very high priority and only one in four prioritize high-speed rail.

The survey also asked how the state should use the projected surplus in the next budget year. A majority of Californians say they would prefer to use the surplus to increase funding for education and health and human services. Far fewer prefer to use it to pay down debt and build up a reserve or to spend on one-time funding for transportation, water, and infrastructure.

When asked to identify the state government’s highest priority in planning for the future, 39% name improving jobs and the economy, 20% say protecting the environment, and 15% say updating water and transportation infrastructure. Improving jobs and the economy is the highest priority across all parties and demographic groups.

Other survey highlights:

  • Two-thirds of Californians say the state is divided into two economic groups: the “haves” and the “have nots.” Four in ten characterize themselves as haves and 45% say they are have nots.
  • While more than half of Californians think the state is generally headed in the right direction, only about a third are satisfied with the way things are going in the nation. Half have no confidence that President Trump will make the right decisions for the country’s future.
  • Only two in ten likely voters approve of Congress; more than half see the shift in control of the US House from the Republicans to the Democrats as a good thing.
  • Two-thirds of state residents continue to see immigrants as a benefit, and there is still bipartisan support for allowing undocumented immigrants to stay in the US legally if certain requirements are met.

Video: Modernizing California’s Education Data System

California has invested billions of dollars in public education reforms over the past decade, and student outcomes have improved in many areas. But the state can’t answer key questions about student progress because it doesn’t have comprehensive data on important transitions. For example, it can’t easily track student movement between high school and college or from college into the workforce. With new state leadership about to take over in Sacramento, the time may be right for an integrated data system that can help policymakers, educators, and students monitor educational progress and outcomes.

Last week in Sacramento, PPIC researcher Jacob Jackson outlined a new report on the need for such a system and Hans Johnson, director of the PPIC Higher Education Center, moderated a panel discussion about the benefits and challenges of creating one.

As Jackson pointed out, most other states already have integrated education data systems. Colleen Moore, assistant director of the Education Insights Center, added that California “already has four pretty good longitudinal data systems—it’s just that they’re within each of the four education segments and they’re not connected.” As a result, student demographics, coursework, grades, and degrees or certificates can be tracked within each segment but not across segments.

Natasha Collins, principle consultant on education for the Assembly Appropriations Committee, noted that it would not be technically difficult to create a repository that links data and follows student movement through the K–12 system and the three postsecondary systems. “It might make sense to move forward with those core components and then potentially add on other agencies—even things like corrections, or the Department of Rehabilitation—so we can really see student outcomes.” She added, “We could also have information on employment and earnings outcomes at least for students who go to college at some point.”

So why doesn’t California have one? Collins noted that the legislature has considered several bills that would set up a system and recently held a hearing on the topic. Moreover, technical plans to link data across the higher education systems have been drawn up in the past. The panelists agreed that the main barriers are not technical—they are political and logistical.

Lande Ajose, executive director of California Competes, stressed the need for an entity to oversee data collection and access: “The state needs an independent body that would be responsible for collecting, cleaning, analyzing data, and making sure it’s accessible to many other parties.” One stumbling block to creating such a body is determining its scope—should it be simply a secure data repository, or should it have the authority to coordinate segments and/or monitor their accountability?

Laura Metune, vice chancellor for external relations at the California Community Colleges Chancellor’s Office, highlighted another barrier: “One of the challenges has been direction and resources from the state level.” She noted that higher education systems have worked together on data sharing, and her own office shares a lot of data with researchers and the public. But, she added, information sharing requires resources, and “we have a really small staff.”

Ultimately, the panelists put the ball in Governor-Elect Newsom’s court. As Ajose put it, “I really do think that this issue of a data system requires gubernatorial leadership, that the governor has the unique ability to set the stage around what is important within higher education.”

Gender Differences in Higher Education Start Early

Female students in California tend to have stronger high school records and greater rates of college attendance and completion than male students do. At the same time, there are large gender differences in many college majors, with some majors (e.g., computer science) predominantly male and others (e.g., liberal arts) predominantly female.

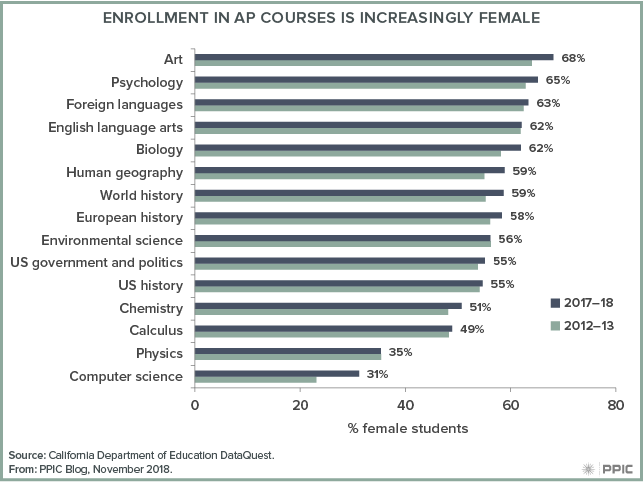
New data on high school courses shows that gender divides in college are already evident by high school. For example, only 31% of high school students in AP computer science courses are girls, while only 38% of students in AP English courses are boys. AP courses provide college-level curricula to high school students and are an important indicator of student pathways to college.

Mirroring differences by college major, AP course enrollments are also notably unbalanced in art, psychology, and foreign languages—all have large majorities of girls. In contrast, physics has a large majority of boys. But in other cases, gender differences in AP courses are not reflected in college majors. For example, in high school more female students take history and math AP classes, but in college more male students major in these subjects.

The low share of girls and women in computer science has been a particular cause for concern. But there is some good news. The share of girls in computer science AP courses has increased markedly in just five years (from 23% in 2012–13 to 31% in 2017–18).  Across the state, some high schools have achieved near gender parity in their AP computer science courses. For example, at Troy High School in Fullerton, a magnet school with the largest AP computer science enrollment in the state, 45% of students are girls.

Overall, female students in California are doing well. Female students make up 57% of enrollment in AP courses and a similar majority of college students. But the lack of women in some key fields is a concern. Colleges should do more to increase enrollment and access for women in subjects like engineering and computer science. High schools also have an important role to play—encouraging more girls to take AP classes in these subjects in high school could help pave the way for more women to pursue them as college majors and careers.

Are K–12 Students Keeping Pace in English?

Last month, we wrote about how newly released 2018 SBAC test score data show that student growth in math has been insufficient to keep pace with grade-level proficiency standards. And though student growth in math proficiency is accelerating, racial disparities are widening as students progress through school.

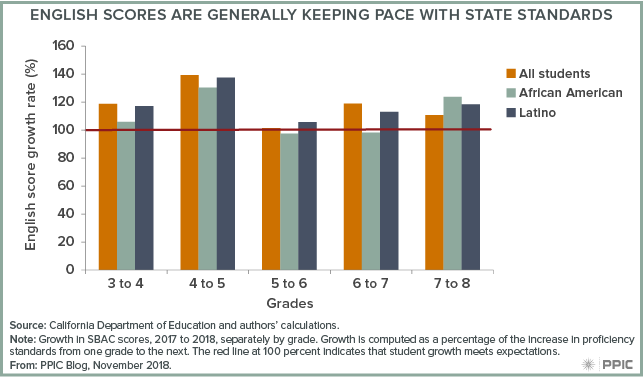
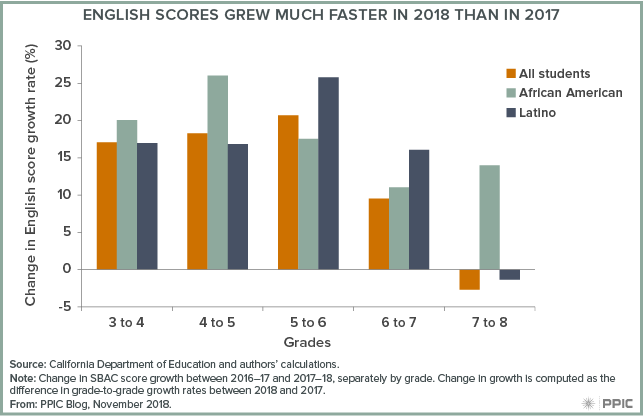
The picture is somewhat more promising for English. Growth in English test scores generally outpaced the state standards—meaning more students were gaining mastery of English than in prior years. Moreover, the growth in 2018 English scores was much higher than in 2017.

The figure below shows the growth in English test scores from grade to grade—how last year’s third graders performed in fourth grade, and so on—relative to the growth in the score required for proficiency in each grade. A growth rate of greater than 100% indicates that average student progress is outpacing what is expected by the standards, while growth of less than 100% suggests progress is not keeping pace with standards.

Across all grades, growth in average student test scores outpaced growth in grade-level proficiency standards. This year’s 5th graders showed particular improvement, with average growth outpacing the standards by 40%. In other words, many more 5th graders are meeting standards in English than they were last year in 4th grade (49.4% vs 45.1% to be exact).

But in most grades, racial disparities in English achievement are still growing with each grade progression: the scores of African American and Latino students grew less than the average student’s scores. However, the pattern is reversed in between grades 7 and 8, where African American and Latino scores grew more than average, reducing these disparities somewhat. In addition, the disparities in English score growth are notably smaller than the disparities in math.

We also see improvements when we compare growth rates between 2017 and 2018. Growth in grades 4 to 7 accelerated considerably in 2018—for example, among Latino sixth graders, English test scores improved a little over 25% more than the scores of their counterparts in 2017—though growth in grade 8 was slightly slower compared to 2017. African American student progress was especially noteworthy, with growth improving more than the average student across four of five grades. While the previous figure shows that achievement gaps still grow slightly as students progress through school, these gaps in growth are small and shrinking.

Looking at the grade-to-grade growth of the same cohorts of students provides a lens to examine whether students are keeping up with grade-level expectations, and whether achievement gaps are shrinking or growing as students advance through school. These findings generate hope that recent reforms are bearing fruit, but there is yet more work to be done. Despite progress in 2018, just under half of our students in grades 3–8 and 11 are proficient at their grade level in English, and less than 40% are in math. Sustaining and improving on this growth will be key to addressing these shortcomings in student achievement.

Are K–12 Students Keeping Pace in Math?

The California Department of Education recently released 2018 SBAC test scores that showed very modest improvement. Since last year, the percent of students meeting or exceeding state standards grew 1.1 percentage points in math. But focusing only on these year-to-year comparisons means that we miss the longer-term picture. That is, we don’t see how the same group of students are progressing over time. When we look at SBAC math scores in this manner, we have some cause for concern—but there are bright spots, too.

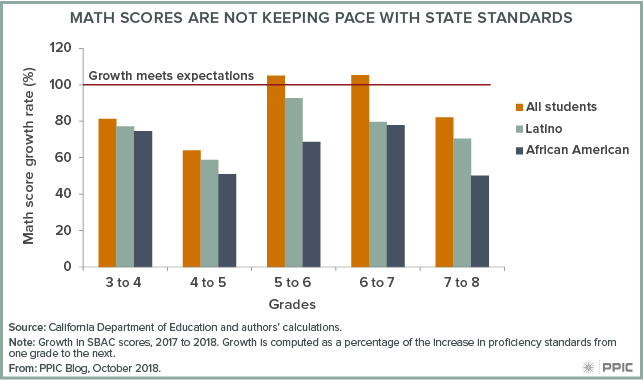
In the figure below, we show the growth in math test scores from grade to grade—that is, we can see how last year’s third graders performed in fourth grade, and so on.  If growth is less than 100 percent, students aren’t keeping up with grade-level standards. If it is greater than 100 percent, student growth is outpacing what is expected by the standards. For instance, fourth grade students gained roughly 80 percent of the increase needed to keep pace with the proficiency standards.

Across all grades student scores grew, but only in grades 6 and 7 did the average student growth keep pace with the growth in standards. In all other grades students fell behind, with fewer keeping pace with the growth in grade-level standards. Perhaps more discouraging, the math scores of African American and Latino students grew less than the average student across all grades, meaning that racial and ethnic disparities are growing as students progress through school. These results suggest that growth among low-income students also lags the standards, since African American and Latino students account for more than 75 percent of economically disadvantaged students.

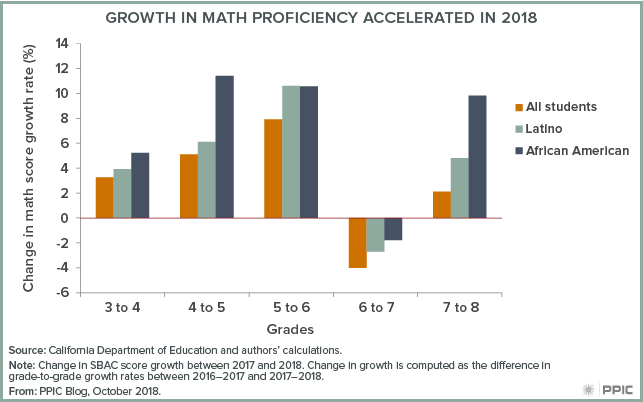
There is a silver lining in the 2018 growth numbers. Across most grades, growth in math was higher in 2018 than it was in 2017, meaning that fewer students are falling behind as they progress through school. This can be seen in the figure below, which shows how math score growth has changed between 2017 and 2018. Growth did slow for seventh graders, yet as the previous figure shows they still managed enough growth to outpace state standards, despite the slowdown.

Also encouraging: racial disparities in growth rates are smaller in 2018 than they were in 2017, as African American and Latino student improvement in math was greater than average student improvement across every grade. For instance, among African American fifth graders math scores improved about 11 percent more in 2018 than their counterparts’ improved in 2017. Thus, while achievement gaps still grow as students advance, gaps in growth are shrinking, and these disparities are growing more slowly than in years prior.

Standardized Testing and College Eligibility

In California and across the nation, there has been a growing focus on increasing college access by improving college readiness for high school students and encouraging more eligible students to attend college. To this end, many states and educational institutions have changed how they use college entrance exams like the SAT and ACT.

One approach has been to have more students take the SAT or ACT in hopes of identifying those who are eligible for college but might not have taken a college entrance exam on their own. As of 2016–17, 25 states use the SAT or ACT as their standardized test for 11th graders.

Assemblymember O’Donnell (D-Long Beach) has proposed AB 1951, which would give districts the option to use the SAT or ACT in place of California’s 11th-grade standardized test. Though Governor Brown vetoed the bill at the end of the 2017–18 legislative session, O’Donnell promised to bring it back in the next session, when California has a new governor.

But even as many states are administering the SAT or ACT to all students, a growing number of colleges and universities are dropping these tests as an entrance requirement. Citing concerns about biases in the exams, as well as the extra financial or time constraints for students, liberal arts colleges like Mills College in California and prominent universities such as the University of Chicago have made submitting test scores optional. Currently, California State University (CSU) does not require students to submit an SAT score (though most still do) if they meet the high school GPA threshold of 3.0 or higher. Despite this trend, most four-year colleges continue to use college entrance exams in their admissions decisions and a growing share of high school graduates take either the SAT or ACT.

In his veto message, the governor suggested another possible way to expand eligibility. California universities could consider using the state’s standardized test (SBAC) as an eligibility measure. All California 11th graders in public schools take the SBAC, which is aligned with the Common Core State Standards and is already used as an early diagnostic of college readiness at CSU and many community colleges. New evidence suggests that the SBAC does as well as the SAT in predicting first-year performance at California’s public universities.

Any of these strategies could increase the number of students eligible for California’s universities—but not all of them would work well together. For example, the University of California and CSU are further scrutinizing the role of the SAT in the admissions process. If the systems decide to drop the SAT requirement, then AB 1951 might have less of an impact. Looking forward, as state policymakers and districts continue to craft policies to improve college access, they should first consider how California’s universities are using—or not using—standardized tests.


Improving Special Education in California

What are the most significant challenges in California’s K–12 school system today? A new report, Getting Down to Facts II, recently released comprehensive findings. PPIC was asked to weigh in on the topic of special education.

We contributed an update to our 2016 report, Special Education Finance in California. This report concluded that state funding for services to students with disabilities is inequitable, inadequate, and lacks transparency. It also fails to provide the same level of local control as other state funding programs. In addition, preschool services to infants and toddlers with disabilities are lacking.

Our new report, Revisiting Finance and Governance Issues in Special Education, expands the analysis of these issues. Overall, we suggest that weaving greater accountability into governance and finance of special education has the potential to improve equity for students with special needs.

Specifically, we find:

  • The state has several good options for revising the special education funding formula so that it better reflects district costs. However, we find that basing funding on the number of disabled students in each district could create negative incentives for districts.
  • Better funding for services to infants and toddlers with disabilities would encourage districts to increase the number of children receiving early services, which would improve behavioral and cognitive skills in some children.
  • Current accountability measures for student success do not acknowledge the unique program factors that can affect district performance data. We find the growth of individual student outcomes is a better measure of progress than the average group scores for all students with disabilities.

We also revisit the role of regional Special Education Local Plan Areas (SELPAs) in special education finance. SELPAs provide support to districts and students in a number of ways, including in the allocation of state and federal funds. We find that district superintendents strongly support their local SELPA, although they provided numerous suggestions for improvement. And we discuss ways that SELPAs could give districts greater autonomy when districts determine that SELPA financial arrangements do not meet local needs.