The Growing Gender Divide in Higher Education

In California and across the nation, women have surpassed men in educational attainment. In 2006, for the first time ever, a majority of college graduates in the state were women. By 2014, 52% of California adults ages 18 to 64 with at least a bachelor’s degree were women, up from 45% in 1990. This gender divide in educational attainment is likely to continue to grow because the disparity is especially notable among younger adults: in 2014, 718,000 (55%) of California’s college graduates under 30 were women, compared to only 588,000 men.

Why are women now more likely to earn a college degree than men? The most direct and obvious answer is that women are more likely to be prepared for college, and thus more likely to enroll in college and graduate from college once enrolled. For example, among high school graduates in California, women are more likely to have completed the courses required for admission to the University of California and California State University. In 2014–15, almost half (49%) of female high school graduates completed these college preparatory courses, compared to only 38% of their male peers. This gap has grown since 2004–05, when 39% of female and 31% of male high school graduates completed these college preparatory courses.

Better academic preparation among women leads to higher college enrollment and graduation rates. According to US Department of Education data, 55% of all undergraduates enrolled in California’s colleges and universities in 2014 were women. And once enrolled, women are more likely to graduate. Six-year bachelor’s degree completion rates in the state were 61% for women and 57% percent for men.

The strong progress that women have made in higher education is good news. Yet inequities remain. Female college graduates earn less than their male peers. Women also have lower rates of employment than men. Policies that promote pay equity, flexible work schedules, and parental leave may help address these issues.

Women are especially underrepresented in important fields such as computer science and engineering—as are African American and Latino men. For California to meet the challenges of the 21st century economy, we need even more women and men—including those from groups traditionally underrepresented in higher education—to earn a college degree.

Learn more

Visit the PPIC Higher Education Center

The Promise of a Four-Year Degree in California

Fewer than one in five first-time freshmen graduate from California State University (CSU) within four years. Because students who graduate on time require less state investment, tend to graduate with lower loan amounts and start earning income sooner, and open up space for other students, CSU has made it a priority to boost four-year graduation rates.

Senate Bill 412, known as the California Promise and recently signed by Governor Brown, aims to help more students graduate on time. Under the law, CSU campuses will promise priority course registration and additional academic advising as long as participating students pledge to take 15 units (usually four courses) per semester—while 12 units per semester is considered full-time for financial aid purposes, students need to accumulate 30 credits per year to graduate in four years.

How can the California Promise help CSU campuses increase four-year graduation?

In our research on CSU graduation rates, we have identified major factors related to low graduation rates and longer times to degree. Among the most common roadblocks are bottleneck courses—for which there is more demand than seats available. Another common problem is that students who change majors or simply don’t take the right combination of courses end up accumulating more units than they need to graduate.

Campuses have implemented several strategies to help students avoid bottlenecks, such as eliminating or streamlining course requirements, as well as increasing the number of sections offered for courses in high demand. Campuses have also focused on engaging students, improving and expanding advising, standardizing requirements across majors, and adjusting major-switching policies to address students accumulating extra units. Campuses expect their focus on four-year graduation to increase with the implementation of the new Graduation Initiative, which sets specific targets for on-time graduation rates. The California Promise also aims to help campuses address these roadblocks. Students who participate in the program will be able to enroll in the courses they need through priority registration. Participating students will receive advising and monitoring to help them take the right number and types of courses. The contracts will also stress the importance of taking enough units to graduate on time.

Who will benefit from the California Promise?

Students have to apply for the program, but automatic acceptance will be offered to any eligible applicant who graduated from an underserved high school, comes from a low-income family (defined as being eligible for a federal Pell Grant), or is a transfer student or first-generation college student. Other students may be accepted as well, as money permits. The California Promise may shorten times to degree for students in the targeted groups who are ready for college-level courses and able to take a full load but who would normally struggle to graduate on time due to course availability, a lack of advising, or who might otherwise take less than a full load without the promise. It is difficult to estimate how many students will fit into this group.

We know that about 40% of freshmen require remediation and may not be able to participate in the promise. Other students may work too many hours to enroll in 30 units per year. Another potential challenge is that high participation levels may make it harder for students who aren’t part of the program to graduate on time. Since no new funding is attached to the law, there are no new courses or advisers. Students without priority registration are likely to have less of a chance of getting in-demand courses that they need. And advising resources could also shift away from those students who are not a part of the contract.

Some campuses, such as CSU San Bernardino, already offer similar contracts. While initial results from some of these contracts suggest a positive impact, the programs are generally small in scope and still need rigorous evaluation. As campuses consider how to structure these agreements, they need to prevent students who don’t or can’t meet the terms of the contract from getting left behind. It will also be important for policymakers to consult with CSU campus leaders, faculty, and students to ensure that there is sufficient support for the program.

Learn more

Read the report Improving College Graduation Rates: A Closer Look at California State University
Visit the PPIC Higher Education Center

Free University Tuition: How Many California Students Would Benefit?

During this election cycle, several candidates have proposed making public college tuition free. While some at the state and national levels are supporting tuition-free community college, Hillary Clinton has outlined a plan that includes four-year colleges—she proposes free tuition for students whose families earn less than $85,000. By 2021 that income threshold would rise to $125,000. How many students in California might benefit from such a plan?

Many students already attend California universities tuition free

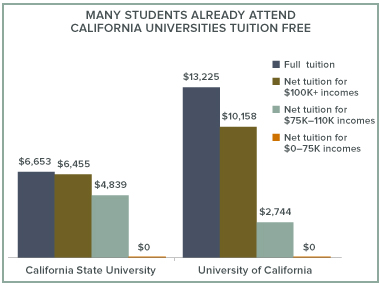
California’s financial aid program, Cal Grants, provides grants (funding that students do not have to pay back) for full tuition for the state’s lowest-income students, as well money toward books and living expenses for some of them. Through a combination of Cal Grants, federal aid, and institutional aid, UC’s Blue and Gold Opportunity plan guarantees free tuition for any family making $80,000 a year or less. CSU has a similar plan, the State University Grant, which bases the amount a family will pay on a number of factors. On average, students who receive financial aid pay no tuition at UC or CSU if their families make $75,000 or less.

Expanding free tuition could impact thousands of California families

While the data on family income are not perfect, they can help us estimate how many students we might expect to benefit from free tuition. Right now, students from families in the $0 to $75,000 range make up about 49% of entering students at UC and 53% at CSU.

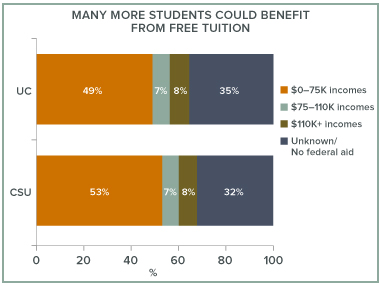
Raising the cap to $110,000—or beyond—would cover at least another 7% of students entering UC (2,300 students) and CSU (3,900 students) in 2014. The average student whose family income is between $75,000 and $110,000 would save about $4,839 at CSU or $2,744 at UC, resulting in more than $25 million in combined tuition savings for those thousands of families.

These estimates may be low, as many middle-class students who currently do not qualify for financial aid may have income levels that that would fall below the cap of an expanded program. Also, a nationwide free tuition program might encourage many low-income students who are currently scared off by the high sticker prices to apply to college or university.

The details of the plan would matter, of course. But if the federal government were to cover all of the $25 million needed to expand full-tuition guarantees at UC and CSU, it’s possible that thousands of low- and middle-income California students could benefit.

Notes: Data for both figures are from IPEDS for entering first-time California resident freshmen in fall 2014. Net tuition applies only to students who received some form of federal aid (grants or loans), which includes 68% of students at CSU and 65% of the students at UC.

Learn more

Visit the PPIC Higher Education Center

Improving On-Time Completion: Year-Round Pell Grants

California and the nation as a whole are pushing for more students to graduate from college in four years. This would not only open up more spots for new students, but also allow students to spend less money on tuition and fees and enter the workforce sooner―creating benefits for both students and the state.

In the graduating class of 2015, 64% of UC and 19% of CSU students graduated within four years. While both systems have made commendable gains since the graduating class of 2005―UC’s on-time graduation rate is 10 percentage points higher and CSU’s has increased by 6 points―there is room for improvement.

We recently looked at the University of Hawai‘i’s 15 to Finish campaign, which has shown early success in encouraging students to take more units per semester and improving on-time graduation rates. However, not all students can take 15 units every semester—and this inability can increase their time to completion. For example, a student who takes 12 or 13 units each semester needs an additional year to complete a four-year degree.

One possible way to help lower-income students graduate on time is to bring back the year-round Pell Grant, which was introduced in the 2009–10 academic year to supplement the original Federal Pell program. The year-round grant allowed students who had exhausted their academic-year Pell awards to pay for summer courses as long as at least one of the units counted toward the next academic year. Funding was also available to students who had not completed the standard unit load due to unforeseen circumstances, allowing them to catch up during the summer. Either way, the year-round Pell provided students unable to take 15 units a semester a pathway to graduate on time.

The year-round Pell was cut in 2011 in response to rising costs—a result of more students becoming eligible and enrolling in college. This cut was part of a compromise that prevented proposed reductions in the maximum award amount from occurring. Because the year-round program was short-lived, we can’t assess its impact. Congress has shown some interest in reviving the year-round Pell, but lawmakers have not passed a bill restoring it, as the Senate and House have differing views on bringing it back.

Given the current focus on improving both student completion and institutional efficiency, it may be time to take another look at a year-round Pell Grant program. Providing more opportunities, especially affordable ones, for summer coursework could help more students graduate on time, make better use of campuses, and help California—and the rest of the nation—meet future demand for educated workers.

Learn More

Visit the PPIC Higher Education Center

Spending on Corrections and Higher Education

California has long been criticized for its growing corrections expenditures, especially as General Fund spending on higher education has declined. The beginning of a new budget year is a good time to examine where the state now stands on spending in these two key areas.

California’s legislature recently adopted a budget for 2016–2017 that devotes $14.5 billion of General Fund revenue to higher education institutions, including the University of California, California State University, and California’s community college system. It allocates $10.6 billion for operations of the California Department of Corrections and Rehabilitation (CDCR), which is responsible for adults in state custody and parolees under state jurisdiction.

These budget allocations reflect a striking shift from California’s budget of forty years ago, when the state spent a larger share on higher education and a much smaller share on corrections. But by the 2008–2009 budget year, allocations to higher education (11.1%) and corrections (10.7%) were almost identical. In the years since, higher education spending has outpaced corrections in relative terms, largely because recent criminal justice reforms have drawn down the number of adults in state custody and on parole. Nonetheless, California spends more on corrections and less on higher education today, in relative terms, than at nearly any point in the past thirty years.

Despite these dramatic trends, spending in each area has actually increased alongside of growth in the populations served. Enrollment in higher education institutions has increased roughly 50% since the 1977–78 academic year; the budget has increased 65% (according to CPEC Fiscal Profiles). Until 2011’s realignment of California’s corrections responsibilities, the number of adults in CDCR custody had increased 555% and the budget increased 526% (CDCR Monthly Population Reports).

Clearly the costs of serving these two populations are different. On average, the cost of the CDCR population is much higher than the cost of students in higher education. Within each area, costs per person vary as well. The cost of educating a student at UC far exceeds the cost of doing so at a community college. Similarly, the cost of incarceration far exceeds the cost of supervising a parolee in the community. Although the per person cost of delivering services has risen over time, the dramatic increase in the prison population has been the key driver of the dramatic shift.

To reverse these trends, the state must identify and disseminate cost-effective strategies to reduce recidivism, further diminish California’s crime rates, and ultimately reduce the prison population enough to allow for the closure of state facilities or the elimination of in-state and out-of-state contract prison beds used to relieve overcrowding. Corrections realignment reduced state prison and parolee populations, but the anticipated savings from this policy shift have yet to materialize. Moreover, the most recent reports show a small uptick in the corrections population (CDCR Monthly Population Reports). ​

In the meantime, California needs to find ways to accommodate more students in its higher education systems—which it could do at relatively low cost by reducing time to degree, or at higher cost by increasing financial aid or expanding the number of slots for students. At the end of the day, ensuring that more of California’s youth attend and complete college will reap positive long-term benefits for the state, helping to meet the needs of the state’s future economy and create a brighter future for all Californians.

Chart source: California Department of Finance Chart C-1 Program Expenditures by Fund.

Learn more

Will California Run Out of College Graduates?
“California’s State Budget”
California’s Future: Corrections

Regional Higher Education Gap Grows

Just as income gaps have grown across California’s regions, so too have disparities in levels of education. Because higher education is a major contributor to economic opportunity, these disparities have significant implications for the future well-being of the state and its residents.

Since 1980, personal income has grown at vastly different rates across the state. Workers in the Bay Area and Orange County earn substantially more (on an aggregate, per capita basis) than the average Californian. Residents in the Central Valley and Sierras, the Inland Empire, and the far north earn substantially less than the statewide average. These disparities have grown over time. In 1980, per capita regional income ranged from 80% to 111% of statewide per capita income. Today, this range is wider, with the Inland Empire at 66% and the Bay Area at 138% of the statewide average.

Regional income differences are tied to the industries and occupations that make up regional economies, as well as broad economic drivers that have accelerated growth in some industries but not others. These same factors affect individual workers’ decisions about where to live.

Given the importance of post-secondary education to economic opportunity, it is not surprising that regional differences in the share of adults with college degrees are similar to differences in income. In the Bay Area as well as Orange and San Diego Counties, the share of adults with four-year college degrees is much larger than the statewide share. The Central Coast region, Sacramento metro area, and Los Angeles County have roughly similar concentrations of college degrees as the state overall; the Central Valley, Inland Empire, and far northern parts of the state have substantially smaller shares.

However, the value of post-secondary degrees has been increasing even in occupations that traditionally have not required college education—including the jobs that comprise a larger share of the economy in lower-income regions of the state. So we might expect regional disparities in college degree attainment to be narrower today. But this is not the case.

In fact, the distribution of higher education credentials across California has become more uneven over time. For example, in 1980 the share of Bay Area adults with college degrees was 128% of the statewide average; today, that share is 138%. Over the same period, the share of college graduates in the Central Valley has fallen from 65% of the statewide average to 56%.

These widening educational disparities are a warning sign for the state’s future. Narrowing regional gaps in educational attainment probably won’t eliminate differences in income, but it could increase competitiveness across all regions and expand economic opportunities for individual Californians.

Note (TOP CHART):The “far north” region includes Butte, Colusa, Del Norte, Glenn, Humboldt, Lake, Lassen, Mendocino, Modoc, Nevada, Plumas, Shasta, Sierra, Siskiyou, Tehama, and Trinity Counties.
Source (TOP CHART): Author calculations from Bureau of Economic Analysis data.

Note (BOTTOM CHART): Share of regional population with a bachelor’s degree or higher compared to statewide share in each year. Source (BOTTOM CHART):Author calculations from the 1980 and 2000 Decennial Censuses and the 2014 American Community Survey, age 25–64 in California.

Learn more

Will California Run Out of College Graduates?
Income Inequality and the Safety Net in California

The Employment Value of Higher Education

As of June, California’s unemployment rate was 5.4%, the lowest that it’s been in nearly nine years. Of course, in that nine years, California’s workers have seen drastic swings in employment opportunity. Higher education is a key determinant of how people fare when the economy slows.

Californians with education credentials beyond high school, from an associate’s degree up to a doctoral degree, have lower than average unemployment rates in general – and had smaller spikes in unemployment during the recession. Even workers with just some schooling beyond high school, but less than an associate’s or bachelor’s degree, fare systematically better than those without any college experience. The following figure shows how unemployment varied according to education levels since 2008. These estimates rely on detailed Census Bureau survey data, which is produced with a significant lag, so the most recent information we have pertains to calendar year 2014.

Although employment across all categories has recovered to its pre-recession levels (or nearly so), Californians with more education have had a smoother course. Unemployment among workers without a post-secondary degree jumped 5–7 points during the recession, but increased by only 2 points for those with advanced degrees.

In good times and in bad, the likelihood of employment is higher the more education Californians have. This—along with generally higher wages—contributes to the substantial gain in lifetime earnings for those who obtain post-secondary credentials. Despite widespread discussion about the value of a college education, the lifetime economic opportunity afforded by post-secondary credentials is not up for debate.

Chart source: Author calculations from American Community Survey data, age 25 and older.

Learn more

Will California Run out of College Graduates?
California’s Need for Skilled Workers
Student Debt and the Value of a College Degree

Getting Students from High-Need Schools into the UC System

The newly approved state budget contains two strategies to enroll more students from disadvantaged backgrounds in the University of California (UC) system and other postsecondary institutions. These spending commitments are designed to increase college readiness and access for the state’s most vulnerable students.

First, the state allocated $200 million to the new College Readiness Block Grant program, which funds “additional services that support access and successful transition to college” for three categories of students: English Learners, students from low-income families, and foster youth. This grant may support a variety of activities related to college readiness—including efforts to increase the number of students completing college preparation courses, such as the a–g course sequence required to attend UC. The College Readiness Block Grant is available to any school that serves students from these designated categories.

Second, the budget also includes funding for the UC system to monitor and increase application, admission, enrollment, and graduation rates among students from “high-need” schools—high schools where 75% or more of the students fall into one of the categories above. Currently, we know little about whether students from high-need schools attend UC and how to get more of them to enroll. I combined data on graduation from public schools and UC enrollment to explore these questions.

What do we know about high-need schools?

In 2015, about 38% of California’s high schools (480 total) were high need based on high rates of enrollment for English Learner, low-income, and foster care students. These schools educate about 34% of all high school students in the state. High-need schools also serve higher proportions of students traditionally underrepresented at UC: about 43% of the African American students in the state and about 51% of California’s Latino students.

High-need schools are less likely to produce graduates who have completed the a–g course sequence required to attend UC. The percentage of all graduates who complete a–g courses at the typical (50th percentile) high-need school is 39%, compared to 49% at regular schools. However, there is a lot of overlap. For example, the top quarter of high-need schools have higher percentages of a–g graduates than the bottom half of regular schools.

Do graduates from high-need schools enroll at a UC?

On average, students from high-need schools are slightly less likely to enroll in a UC. About 5.4% of all graduates enroll in a UC at a typical high-need school, compared to 6.5% for a typical regular school.

However, a–g completion rates are likely driving the difference in UC enrollment between high-need schools and regular schools, since students at regular schools are more likely to have completed a–g courses. When examining the number of UC enrollees compared to the number of a–g graduates a school produces, we see no difference between regular and high-need schools.

The College Readiness Block Grant program’s focus on helping to prepare students for college might be an effective strategy to increase UC enrollment from high-need schools that would not require many changes to admissions policy in the UC system. Evidence suggests that improving a–g completion rates at high-need schools will help boost UC enrollment of graduates from these schools.

Top figure note: Data from California Department of Education. Spring 2015 graduates. N=1,276 schools.

Bottom figure note: Data from California Department of Education, University of California, and California Postsecondary Education Commission (CPEC). Spring 2015 graduates compared to fall 2015 enrollees. “All graduates” refers to the ratio of graduates to enrollees from the school. “A–G graduates” refers to the ratio of a–g graduates to enrollees from the school. Fifteen percent of schools were not in the crosswalk provided by CPEC and are not used in the comparison of enrollees. Another 8% are not represented in the UC data set, but are present in the UC data and crosswalk, and thus are given zero enrollees for the purpose of these figures. N=1,072 schools.

A Generational Challenge for Higher Education

Generational progress in educational attainment has long been a critical component of societal improvements in well-being and economic mobility. For many decades in California and the United States, the expectation has been that children will eventually attain a higher level of education than their parents. And for many decades, that is exactly what occurred.

In recent years, however, generational progress has stalled. The share of Californians ages 25–34 with at least a bachelor’s degree (33%) is only very slightly higher than the share of bachelor’s-degree holders among the 55–64 age group (31%). Compared to countries that are part of the Organisation for Economic Co-operation and Development (OECD), an international organization of 34 member countries that provides data on economic and education trends, California ranks 1st in the share of older adults holding at least a bachelor’s degree (or equivalent), but only 22nd among younger adults.

Unlike almost all OECD countries, California has seen very little generational progress (2 percentage points). In stark contrast, Korea, Poland, and Ireland witnessed gains of 23 or more percentage points in the share of bachelor’s-degree holders among younger adults, relative to older adults. Because educational attainment is the single most important determinant of employment and wages, this lack of progress has implications not only for individuals but also for the state’s economy.

Not all states share California’s lack of progress. Among the 30 largest states, California ranks 21st in generational gains. New York, Iowa, and Illinois have all seen some of the largest improvements (10 to 12 percentage points) in the share of bachelor’s-degree holders among younger adults, compared to older adults. In Massachusetts (not shown), half of all young adults have a bachelor’s degree, compared to 40% of older adults.

A few states, including Arizona, Colorado, and Oklahoma, actually saw generational regress, meaning older adults are more highly educated than younger adults. Despite the lack of generational progress, Colorado still has a relatively high share of young adults (37%) with at least a bachelor’s degree.

What is most worrisome for California is that the lack of generational progress is coupled with a relatively low share (33%) of young adults with college degrees. Connecticut (not shown) has not seen much generational progress either, but even so, over 40% of young adults in that state have a college degree.

These differences in generational progress (or lack thereof) are not necessarily attributable to differences in education systems across states. For example, in Colorado, many highly educated older adults have migrated to the state from elsewhere.

The tremendous challenge facing California and the key to improving economic well-being in the state is to increase educational attainment among young adults. PPIC has identified key strategies to do this:

  • Improve access to four-year colleges.
  • Increase transfers from community colleges to four-year colleges.
  • Raise graduation rates for those already in college.

By taking steps now, the state and higher education leaders can put California back on the path of strong generational progress.

Chart source: OECD and American Community Survey.
Figure notes: Charts display select countries or states, including those with the highest and lowest generational gains.

Learn more

Read Higher Education in California: Addressing California’s Skills Gap
Visit the PPIC Higher Education Center

The Rise and Fall of Enrollment at For-Profit Colleges

Increased demand for postsecondary education in California has contributed to dramatic growth in enrollment at for-profit colleges. But in recent years, this trend has begun to reverse. Many students who saw for-profit colleges as a viable alternative to public and private nonprofit institutions are in debt and without a degree, and some for-profit colleges are now the focus of state and national investigations, lawsuits, and sanctions.

California is home to almost 400 private, for-profit postsecondary institutions that are eligible to participate in federal financial aid programs. These colleges vary widely in size and mission, from small independent vocational schools enrolling only a few dozen students to large national chains that enroll thousands and offer graduate as well as bachelor’s degrees. Altogether, for-profit colleges make up more than half of all postsecondary institutions in the state and enroll one in eight postsecondary students.

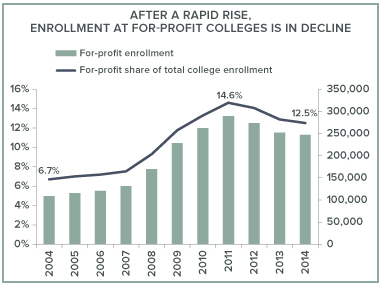
Enrollment at for-profit colleges in California almost tripled between 2004 and 2011, growing from 109,000 students to 289,000 students (as measured by full-time equivalent enrollment). Over the same period, enrollment in other colleges changed very little (increasing only 12%). By 2011, one in seven college students attended a for-profit institution. For-profit colleges enrolled more students than the University of California system and all private nonprofit colleges in the state.

But since 2011, enrollment in for-profit colleges has declined by more than 40,000 students, a 15% drop. Every sector of for-profit colleges experienced declines, with the sharpest reduction (29%) occurring among two-year institutions. Meanwhile, public and private nonprofit colleges saw slight enrollment increases during this same time frame.

What accounts for the rise and fall of enrollment at for-profit colleges?

Certainly, students were attracted to the easy access and convenient course times that for-profit colleges offered—something that other colleges can and have been learning from. But investigators have also found that a number of for-profit colleges engaged in predatory marketing practices, targeting vulnerable students and making false promises about job placement. Such practices may have helped enrollment growth at first, but as these practices became more well-known, and as regulatory and legal actions became more widespread, enrollment began to decline.

The decline also coincides with restrictions on institutional eligibility for the state’s large financial aid program, Cal Grants. In 2011, institutions with a high share of students receiving federal loans were required for the first time to meet minimum standards for graduation rates and loan default rates for their students to remain eligible for Cal Grants. In 2014, only 40 of the 383 for-profit colleges in California met these standards and remained eligible for Cal Grants. Enrollment declines were smaller (9%) at the for-profit colleges that retained Cal Grant eligibility. (Students at colleges that do not meet the minimum standards for Cal Grant eligibility can still receive federal financial aid.)

The future of for-profit colleges is uncertain. In the near term, enrollment losses are likely to continue. Though not yet available, 2015 enrollment data will show further declines due to the closing of Corinthian Colleges, the parent company for Heald, Everest, and WyoTech colleges, in California. Those institutions enrolled over 15,000 students in fall 2014.

Meanwhile, the US Department of Education has taken aim at the Accrediting Council for Independent Colleges and Schools (ACISC), the largest accrediting agency of for-profit colleges in the nation. Continued actions such as this one could eventually lead to a loss of accreditation and hence federal funds for hundreds of for-profit institutions nationwide. Without federal funding, many for-profit colleges would be unable to operate, leading to further enrollment declines.

Chart source: Integrated Postsecondary Education Data System (IPEDS), fall full-time equivalent enrollment in California.

Learn more

Visit the PPIC Higher Education Center