Primary Takeaways: Democracy Is Alive and Well in California

With the release of the official Statement of the Vote, the final tally is in for the 2018 California primary. The election outcomes are encouraging news for California’s democracy—especially in light of criticisms of the top-two primary system by the national media. Several important statewide trends stand out:

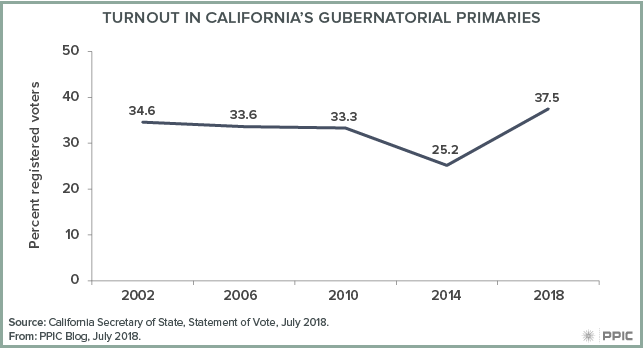
  • Strong political participation. A record-setting 19 million Californians—75.7% of eligible adults—were registered to vote in the gubernatorial primary. This threshold has not been reached since the middle of the 20th century. Moreover, the 7.14 million voters who cast ballots is an all-time high for a gubernatorial primary and, at 37.5% of registered voters and 28.4% of eligible adults, the turnout rates are the highest reported in the five gubernatorial primaries since 2000. Since his election four years ago, California Secretary of State Alex Padilla has been on a mission to make it easier for Californians to register to vote and cast ballots, and the efforts seem to be working. The May PPIC survey found that likely voters’ attention to election news was relatively high, so credit also goes to the media for stoking interest in political participation.
  • More independent voters. Many Californians are responding to the hyper-partisanship of national politics by eschewing the major parties and registering as independents (also known as NPP for “No Party Preference”). In June’s election, for the first time in the state’s history, NPP voters outnumbered Republican voters (25.5% to 25.1%). In the past four years, the number of NPP voters increased (+1,103,602) more than the number of Democratic voters (+745,598), while Republican ranks shrunk (-267,311). The makeup of the June ballot reflected the political clout of NPP voters. Four of the statewide races included NPP candidates, giving voters some nonpartisan choices they did not have under the previous primary system. And in a first for the general election, the top two candidates for insurance commissioner are a Democrat and an NPP candidate (formerly a member of the Republican Party).
  • Diverse statewide candidates. After much consternation about the likelihood of a single-party race at the top of the ticket, five of the eight partisan races—including the governor’s—feature a Democrat running against a Republican. Except for the governor’s race, the top-two primary results offer a diverse pool of candidates to choose from in the fall, at least among Democratic options. The US Senate election and the seven down-ticket races include five Latinos, four women, two Asian Americans, and one African American. Also, eight of the nine statewide races—including the governor’s—are contests between Northern and Southern Californians. While many Republicans are likely to skip voting in a US Senate race with two Democratic candidates, as they did in November 2016, a Democratic-only race for the open lieutenant governor seat will be closely watched for signs of cross-party voting.
  • Popular state ballot measures. Four of the five state propositions placed on the June primary ballot by the legislature passed. This is consistent with the historically high pass rate for legislative ballot measures. With the legislature’s approval holding steady and at a relatively high level in the May PPIC survey, the four state propositions each passed by healthy margins—including a 58% “yes” vote for the state water and parks bond. The latter results bode well for the state housing bonds passed by the legislature and placed on the November ballot. (Citizens’ initiatives appear only on the November general ballot.)

The main takeaway from the June primary is that the vital signs of California’s democracy are healthy. In the wake of California’s many election reforms, records may be shattered in the numbers of registered voters and ballots cast this fall—and throughout the 2020s. The top-two primary system may have its quirks, but it is well suited for the burgeoning number of NPP voters. NPP candidates have found a home in the top-two primary, an NPP will be on the fall ballot, and there will likely be NPP statewide officeholders in the future. The fears about major party voters feeling left out of the fall election were overblown, and most top two candidates reflect the state’s diversity. Positive responses to the June ballot measures suggest an easy time for the state propositions from the legislature this fall; the fate of the nine citizens’ initiatives—including a repeal of the recent gas tax increase—is currently less clear.

At PPIC, the race for governor, US senator, and superintendent of public instruction stand out as uniquely worthy of public attention. We have invited the two candidates in each race to participate in conversations with me about the future of California. Stay tuned for more information about these public events. Meanwhile, throughout the fall the PPIC Statewide Survey will focus on the governor’s race, the US Senate election, and the congressional races—as well as the gas tax repeal and other state propositions that impact our future. We look forward to informing discussions and raising awareness about the importance of this consequential election for the state and nation.

A Preview of the California Governor’s Election

The people have spoken and the November election for governor has been decided: Democrat Gavin Newsom will face off against Republican John Cox. Let’s look at recent PPIC surveys to help us understand the determining factors of this outcome and the political dynamics that will surface in this fall’s matchup.

In the weeks before the June primary, the May PPIC survey found that Newsom was his party’s favorite in a race with the four major Democratic contenders, while Cox was his party’s top choice in a contest between the two major Republican contenders. The election results confirmed these trends in the voting patterns of red and blue counties. What is it about these candidates that was attractive to their bases?

The primary results were foreshadowed in a January PPIC survey. When likely voters were asked about the qualifications that they are looking for in a candidate for governor, most Democrats (84%) said they wanted a candidate with experience in office, while most Republicans (65%) preferred a candidate with experience running a business. The party faithful chose the person who arguably fit their profile best—Lieutenant Governor Newsom and businessman Cox. While California likely voters favor elected experience to business experience by a wide margin (62% to 31%), the fall election will focus on issues where opinions are more divided. This suggests a more competitive race than one might expect in deep blue California.

The November gubernatorial election is set in a midterm-election context perceived as a referendum on President Donald Trump and the Republican-led Congress. John Cox is endorsed by President Trump while Gavin Newsom is a vocal member of the Trump resistance. Democrats hope to flip several of the House seats held by California Republicans so that their party can take control of Congress. This election comes at a time when independents are now the second largest voter group at 4.9 million (SOS, June 1).

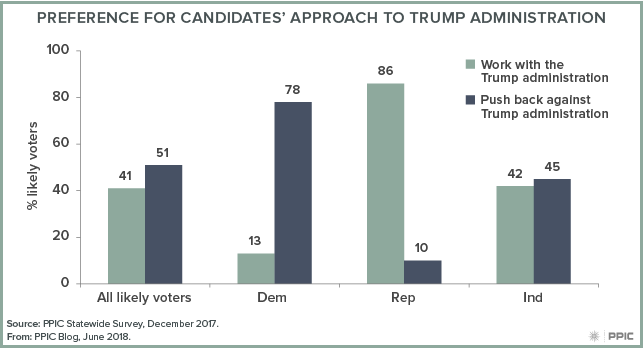
Slim majorities of California likely voters also say they would vote for the Democratic candidate over the Republican candidate in their House district races in both the March PPIC survey (53% to 39%) and in the May PPIC survey (52% to 38%). Democrats strongly preferred the Democratic candidate (92% March, 91% May) and Republicans strongly favored the Republican candidate (87% March, 86% May) while, again, independents are divided (Democrats: 37% March, 43% May). The independents’ turnout and leanings will thus be a focal point in House races—another reason this voter group is the wildcard in November.

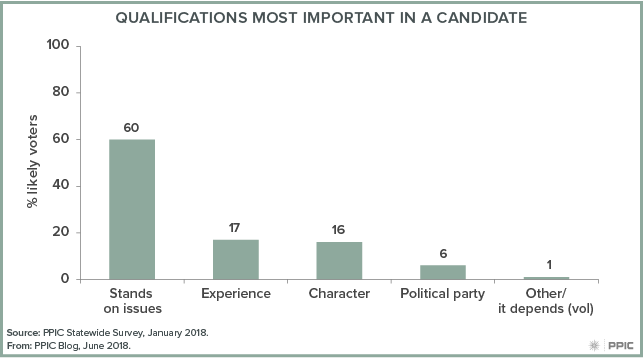
What else will Californians need to know about the two candidates? In the PPIC January survey, 60% of likely voters rank the candidates’ stands on the issues above several traits: experience (17%), character (16%), and political party (6%). Likely voters most often name the economy, immigration, and housing costs as their top issues in the May PPIC survey. Eighty-two percent of likely voters say that the candidates’ performances in public debates will be important in determining their vote for governor.

PPIC has invited the two gubernatorial candidates to participate in a public conversation with me about the issues, their leadership, and vision for California. Stay tuned for more information about when and where it will take place, and how you can attend or watch this special PPIC event.

Single-Payer Health Care and the Governor’s Race

One issue that may prove decisive for Democrats in the 2018 governor’s race is single-payer health care. With the leading Democratic candidates supporting a single-payer system—and the leading Republican candidates in opposition—the race has shed light on the financial, political, and regulatory challenges associated with expanding health coverage across the state.

Last year, the state senate passed a bill (SB 562) that would establish a single-payer health insurance program to cover all Californians. However, the bill was shelved in the state assembly until further notice. According to estimates by the nonpartisan Legislative Analyst’s Office, the bill’s total annual costs would be about $400 billion. Democratic gubernatorial candidates Gavin Newsom and Delaine Eastin have been the most vocal proponents of single-payer health care and have publicly backed the bill. Democratic candidates Antonio Villaraigosa and John Chiang, while supportive of the idea, have expressed concerns over financing and implementation. Both the leading Republican candidates, John Cox and Travis Allen, strongly oppose single-payer health care and have emphasized the need for more competition in the marketplace.

With candidates’ differing positions, how are Californians feeling about single-payer health care today?

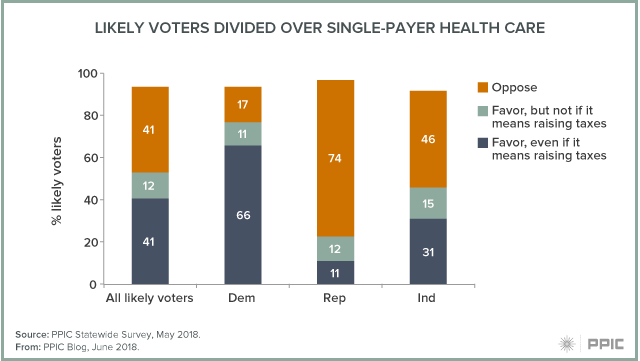
The May PPIC Statewide Survey found a majority of California’s likely voters (53%) favor a single-payer state plan. However, if this plan requires raising taxes, support declines to 41%. Across parties, an overwhelming majority of Democratic likely voters (77%) are in favor, while an overwhelming majority of Republicans (74%) are opposed; independent likely voters are divided (46% favor, 46% oppose). Notably, 66% of Democratic likely voters would favor a single-payer system—even if it means higher taxes.

The issue has become a litmus test for Democrats—pitting progressives against pragmatists—but, overall, Democrats express strong support for a single-payer system. Among likely voters who call themselves strong Democrats, 81% are in favor, compared to 69% who say they are not very strong Democrats. Among likely voters who call themselves strong Republicans, 83% are opposed to a single-payer system (the sample size for those calling themselves not very strong Republicans is too small for analysis).

Given partisan divides, the next governor may face significant political hurdles moving forward with single-payer health care. Coupled with statewide challenges, California would need to collaborate with the federal government to implement such a system. In consideration of these factors, the June primary is an opportunity for Californians to determine their future leadership and the state’s policy directions—including a possible step toward single-payer coverage.

The Top Two and Turnout in California’s Primary

California voters face many decisions on a long and crowded June 5 primary ballot. None will be more closely watched than the choices made in the top-of-the-ticket governor’s race that will determine the top two candidates in the November election runoff. Six candidates—four Democrats and two Republicans—have been serious contenders in this race. In the May PPIC Survey, Democrat Gavin Newsom continues to lead the pack, with little separation between Republican John Cox and Democrat Antonio Villaraigosa for the coveted second-place finish. It’s a toss-up if the gubernatorial race will include two Democrats or a Democrat and a Republican. Why does this matter so much?

It is likely that a Democratic candidate will prevail—no Republican has won a statewide election since 2006. Since then, the gap in partisan registration has ballooned to 19 points (44% Democrat, 25% Republican; Secretary of State, April 2018). The issue today is turnout. The partisan makeup of this November’s electorate has consequences for the Democrats’ efforts to flip several Republican House seats in competitive California districts (Cook Report, May 10) to gain party control of the US Congress. Without a candidate at the top of the ticket, Republicans have one less reason to vote.

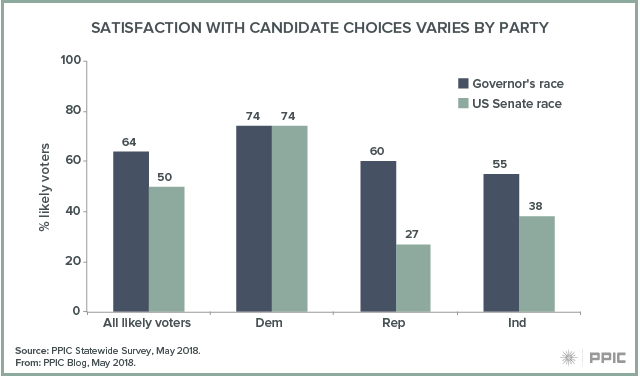
Californians have warmed up to the current gubernatorial contest. The May PPIC Survey finds that likely voters’ interest in news about the gubernatorial candidates has almost doubled since January (30% to 58%). Equal proportions of likely voters across parties are very or fairly closely following election news today (58% Democrats, 61% Republicans, 60% independents). Moreover, likely voters’ satisfaction with the candidate choices has grown since January (54% to 64%)—especially among Republicans, who were the least satisfied earlier this year. Majorities of likely voters across parties are now satisfied with their choices (74% Democrats, 60% Republicans, 55% independents). In addition, more likely voters have found a candidate to support for governor since January (76% to 85%), and by similarly large margins across parties (86% Democrat, 86% Republican, 81% independent) today. Democratic pluralities are favoring Newsom, Republican pluralities are supporting Cox, and independents are dividing their support across two parties and four candidates.

By contrast, we need to look no further than the US Senate primary to foreshadow the impact of a one-party governor’s contest this fall. Democratic US Senator Dianne Feinstein is on the ballot with Democratic California State Senator Kevin de León. There are no major candidates from the Republican ranks in this race. In the May PPIC Survey, likely voters’ satisfaction with senate candidate choices (50%) is much lower than in the governor’s race (64%), with vastly different satisfaction levels across parties (74% Democrat, 27% Republican, 38% independent). More importantly, fewer voters have found a candidate to support in the senate race (64%) than in the governor’s race (85%), and this trend is especially pronounced among the GOP likely voters (87% Democrats, 41% Republicans, 53% independents) today.

The top-two system was created in 2010 to encourage the growing ranks of independent voters to participate in the June primary. Third parties countered that their voters would be shut out of the November election, an outcome that has largely proven true. With the dwindling ranks of Republicans today, another flaw that impacts the two-party system has surfaced—lack of participation from those feeling unrepresented on the ballot. And with deepening partisan divisions in the country, voters cannot be counted on to cross party lines and choose a candidate from outside their ranks. Republicans face an unprecedented obstacle of unknown proportions if a one-party governor’s race depresses their turnout. In the long run, California’s democracy has a bigger problem if many voters are feeling disenfranchised by the top-two primary results and choose not to participate in a statewide election. To fully assess the significance of these issues, PPIC surveys will continue to track voter interest, candidate satisfaction, and ballot choices in this consequential election.

Video: California Primary Preview

In the run-up to California’s June 5 primary, Democrat Gavin Newsom remains the top choice among likely voters in the governor’s race, according to the latest PPIC poll. Republican John Cox is in a close race with Democrat Antonio Villaraigosa to gain the second spot on November’s general election ballot. Senator Dianne Feinstein holds a wide lead over fellow Democrat Kevin de León.

Dean Bonner, PPIC associate survey director, detailed these findings and more at a recent Sacramento briefing.

The survey shows Newsom (25%) leading among likely voters, followed by Cox (19%), Villaraigosa (15%), Republican Travis Allen (11%), and Democrats John Chiang (9%) and Delaine Eastin (6%). Fifteen percent of likely voters are still undecided. Results were similar in an April PPIC poll (26% Newsom, 15% Cox, and 13% Villaraigosa). Cox’s support has more than doubled since the January (7%) PPIC poll.

Other highlights of the survey include:

  • A majority of likely voters (63%) favor Governor Brown’s final budget, and overwhelming majorities like his idea of additional one-time spending on infrastructure, homelessness, and mental health programs.
  • Immigrants are viewed as a benefit to the state by a majority of likely voters (67%) because of their hard work and job skills. The vast majority (80%) favor a way for undocumented immigrants to stay in the US legally—if certain requirements are met.
  • Californians are divided on the motivation of the Russia investigation, but a strong majority of likely voters (74%) think the Russian government tried to influence the outcome of the 2016 presidential election.
  • Californians distrust both the state and federal government—just 18 percent of likely voters say you can trust Washington to do what’s right.

Do Californians Support State Action on Immigration?

California became the nation’s first sanctuary state in January, when Governor Jerry Brown signed legislation (SB 54) that limits cooperation by local law enforcement with federal immigration authorities. In March, the US Justice Department announced that it was suing California over three immigration-related laws—including SB 54. Since then, six counties—including San Diego and Orange—and at least 13 cities have voiced opposition to the sanctuary laws, either by passing resolutions or by joining the Justice Department’s lawsuit against California.

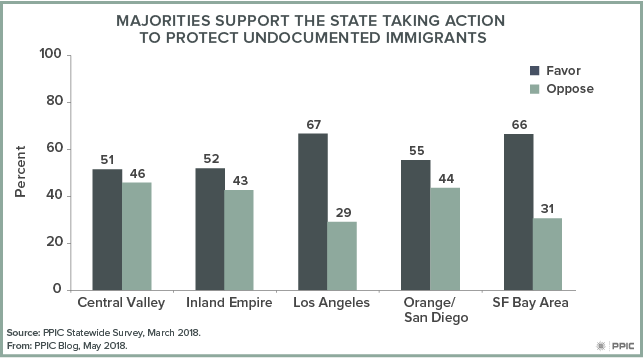
A solid majority of Californians (61%) support the state taking action to protect undocumented immigrants. But there is a stark partisan divide: the March PPIC Statewide Survey found eight in ten Democrats in favor of and eight in ten Republicans opposed to the state taking action. It is notable that there is majority support across the state’s regions. This includes 55% support among residents in Orange and San Diego Counties, home to a majority of the cities opposing the sanctuary laws. About half of residents in the Central Valley and the Inland Empire favor the state taking action. And support is even higher in Los Angeles and the San Francisco Bay Area, where it hovers around two-thirds. There are some differences between coastal (64%) and inland (52%) residents.

Across demographic groups, there is considerable support for state action on this issue—in fact majority support drops below 50% only among whites (47%). Support is highest among Latinos (76%), immigrant residents (73%), those with a high school degree or less (71%), Californians age 18 to 34 (67%), and those living in households making less than $40,000 (67%).

While the courts will ultimately decide the fate of the federal lawsuit, two things are clear: 1) California will continue to chart its own course on issues its leaders care about, and 2) immigration continues to be a topic that divides partisans but unites many other Californians across the state. Stay tuned to PPIC as the Statewide Survey will continue to monitor the opinions of Californians on this important policy issue.

The 100th Anniversary of Women in the California Legislature

The Public Policy Institute of California is hosting a public event in Sacramento to commemorate the election of the first women to the California Legislature in 1918. Today, with Toni Atkins as the first woman in the powerful position of senate president—and in the wake of the capitol’s sexual misconduct scandals—we want to offer some reflections on the status of women in California’s statehouse.

First, it’s important to point out that the legislature has far fewer women than men at a time when women have an edge over men in voting. Women now make up slightly more than half of California’s likely voters (53%). This edge persists across racial/ethnic groups: women make up more than half of African American (57%), Latino (57%), white (52%), and Asian American (51%) likely voters. Across parties, women make up 62% of Democratic likely voters, 49% of Republican likely voters, and 44% of independent likely voters.

But the predominance of women voters is not reflected in the composition of the California Legislature. After the path-breaking elections of 100 years ago, the following decades saw relatively few women serving in the assembly. And it wasn’t until 1966 that women of color won assembly seats. A decade later, the first woman was finally elected to the state senate. The top two leadership roles in the assembly and senate were filled even more slowly. No woman held the assembly Speaker position until 1995—and that was for only three months. The next woman Speaker wasn’t elected until 2008.

Legislative term limits—passed by voters in 1990—were partially conceived as a path toward increasing diversity in the statehouse. But in the nearly 30 years since—an era that has been defined by California’s increasing ethnic and racial diversity, and Democratic leanings—there has been little change. The proportion of women in the legislature has ranged from a low of 18% in the 1991–92 session to a high of 31% in the 2005–06 session; overall, the average has hovered around 25%. A slew of recent reforms such as independent legislative redistricting, the top-two primary, and additional legislative term limit reforms—as well as efforts to encourage voter registration and voting—have had little impact.

Today, the proportion of women in the California Legislature stands at 23% and is similar in both houses. However, Republicans trail Democrats in the proportion of women legislators, with 6 women among the 38 Republican members and 22 women among the 79 Democratic members.

Surprisingly, California is a laggard in this area. Although a 2018 Rutgers University report finds that 25.4% of state legislators across the US are women, California ranks just 32nd out of the 50 states, close to the next-largest state, Texas (#35, 20.4%). Compared to our western neighbors, California is well behind Arizona (#1, 40%), Nevada (#3, 38.1%), Oregon (#8, 33.3%), and Washington (#5, 37.4%).

The lack of gender diversity in the California Legislature raises serious questions about the effects of political representation. What is the impact of the gender gap on equitable and effective policymaking? What are the greatest barriers for women in political careers? Will electing more women to legislative office provide inspiration and pathways for others—and help to build a more inclusive culture? One thing is certain: California’s current gender gap has consequences for the ability to recruit and retain top talent in the legislature today.


Parents Have High Educational Hopes for Their Children—Can California Keep Up?

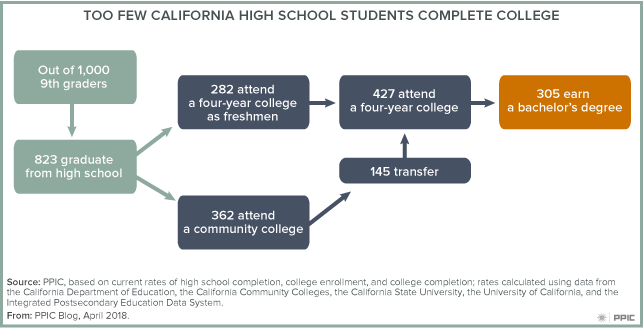
The most recent PPIC Statewide Survey on Californians’ views on education finds that the vast majority of parents (83%) hope their children will obtain at least a bachelor degree—in fact, nearly half (48%) want their children to earn a graduate degree. These parental aspirations are relatively constant across race/ethnicity, political ideology, and income. They are also fairly consistent across regions—although, among the regions represented in the survey, parents in the Central Valley are the least likely (77%) and San Francisco Bay Area parents are the most likely (96%) to want their children to earn college or graduate degrees. These parental aspirations may be linked to student course taking and performance in high school. Over the past decade, there has been a 48% increase in completion of the coursework that makes California high school graduates eligible for UC or CSU; in 2015, 43% of the state’s graduating class met this eligibility requirement.

Moreover, these aspirations are aligned with urgent state needs. If current economic and educational trends persist, California will fall 1.1 million bachelor’s degrees short of economic demand by 2030. The state economy is increasingly reliant on high-skill workers, but most K–12 students do not stay on track to obtain a bachelor’s degree, let alone a graduate degree. Previous PPIC research has shown that for every 1,000 9th graders in California, only 305 will earn a bachelor’s degree at UC or CSU.

Parental Aspiration Figure

California has a long way to go in meeting demand for higher education, but there are signs of progress. The state has been reinvesting in public higher education, increasing undergraduate enrollment, and improving student outcomes—and the public education systems are increasingly willing to work together to streamline the higher education pipeline. California will need continued innovation and significant investment in facilities and faculty in order to accommodate the kind of enrollment growth that can keep up with economic demand and individual aspirations. Moreover, given the large share of Californians who see advanced degrees as important, the state may want to begin a more robust discussion about graduate school, along the lines of its recent focus on career technical education.

Tax Day: Californians Feel Overburdened

Tax day is here, and Californians are feeling particularly burdened.

A record-high number of adults (72%) say that California ranks above average or near the top in per capita state and local tax burden compared to other states. This perception is close to the fiscal facts: a Tax Foundation report ranked California’s 2014 state and local tax collections per capita as 13th-highest in the nation.

Taxes are not only perceived to be high, but they are also viewed as disproportionate: a majority of Californians (56%) say they pay more taxes to state and local governments than they feel they should (37% much more, 19% somewhat more). Californians’ views were similar last March (58%), following an extension of income tax increases on high-earning residents. Today, traditionally tax-opposed Republicans (78%) are much more likely than independents (63%) and far more likely than Democrats (47%) to say that they pay much or somewhat more than they should. This perception is also more common across higher-income groups (65% $80,000 or more, 58% $40,000 to under $80,000). Lower-income groups are more divided: among residents with household incomes under $40,000, 47% say they pay more or somewhat more than they should, while 40% say they pay the right amount.

How do these views align with approval ratings of state elected officials? Among those who say they pay much more than they should, 50 percent disapprove of the way Jerry Brown is handling his job, 60 percent disapprove of the California Legislature, and 57 percent disapprove of the way that the state legislators representing their assembly and senate districts are doing at this time.

Nonetheless, legislators are moving forward with more tax proposals. According to a recent California Tax Foundation Report, the state legislature introduced 33 bills and constitutional amendments since the start of the 2017–18 legislative session that could increase taxes and fees by over $269 billion annually, though few are likely to become law. The most expensive proposals include a government-run healthcare tax, a sales tax on services, and a new tax on California businesses. These proposals come in the midst of an election year and expected state budget reserve of nearly $16 billion.

Californians will soon have the opportunity to make significant decisions at the ballot box—choosing new leaders and helping to shape the state’s future. Stay tuned to the PPIC Statewide Survey for timely coverage of this year’s election and Californians’ leadership preferences.

Video: Californians and Education

In the wake of the Parkland, Florida, killings, the latest PPIC survey finds an overwhelming majority of Californians are concerned about a possible shooting in their local schools. But most oppose having teachers carry guns in school facilities.

Lunna Lopes, PPIC researcher, detailed these and other key findings at a Sacramento briefing last week.

When asked about school shootings, 73 percent of California adults and 82 percent of public school parents say they are very or somewhat concerned. Yet two-thirds of adults (67%) and public school parents (68%) oppose allowing more teachers and school officials to carry guns in schools. Strong partisan differences emerge on this issue. An overwhelming majority of Democrats (86%) and a strong majority of independents (69%) are opposed to arming teachers and school officials, while a solid majority of Republicans (60%) favor the idea.

A few other survey highlights include:

  • Californians (65%) support having local school districts declared sanctuary safe zones for undocumented students, but there are deep partisan divisions.
  • California adults and likely voters continue to see the state’s K–12 funding as inadequate. Solid majorities (60%) of likely voters favor local school bonds, while fewer (48%) support local parcel taxes for schools.
  • Across parties, majorities of likely voters agree that gubernatorial candidates’ positions on K–12 education are very important.
  • Among likely voters in the gubernatorial race, Democrat Gavin Newsom maintains his lead (26%), followed by Republican John Cox (15%) and Antonio Villaraigosa (13%). Nearly a quarter of likely voters (22%) remain undecided.