Video: Strategies for Reducing Child Poverty

High housing costs and low-wage work make it hard for low-income Californians to meet their basic needs. The result? Nearly a quarter of California’s youngest residents live in poverty—a fact with profound educational, health, and economic repercussions now and in the future. Social safety net benefits help low-income families supplement their incomes but do not reach the working poor in high-cost areas and the very poor across the state.

A new PPIC report examines how high housing costs and low wages contribute to child poverty. It also looks at additional policy approaches: an expansion of the Earned Income Tax Credit, establishment of a state child credit, and an overhaul of the state renter’s credit. Each approach holds promise, and each involves trade-offs.

Researcher Caroline Danielson presented the report in Sacramento last week. She also demonstrated an interactive tool that allows for a deeper exploration of how policy changes could affect California’s diverse counties. It underscores the need for policymakers to be strategic in determining how best to help families in need throughout the state.

Explore the accompanying tool Interactive: Reducing Child Poverty in California.

Californians Opposed to Governor’s Transportation Plan

In PPIC’s most recent statewide survey, 61% of Californians say that spending more money on the maintenance of roads, highways, and bridges is very important for California’s future quality of life and economic vitality. At the same time, a majority of Californians (54%) oppose the governor’s proposal to do so. His transportation funding plan would provide $43 billion of additional spending for state and local transportation projects, with money coming from a new $65 vehicle fee and an increase in gasoline and diesel taxes. Republicans are overwhelmingly opposed to the governor’s proposal and independents are divided. Among Democrats, a slight majority (53%) favor the plan while 42% oppose it.

Californians’ reluctance to support the governor’s plan is understandable in light of another survey finding: many are not satisfied with the way transportation funds are being spent now. When asked what is most needed to improve the quality of California’s roads and surface transportation, 51% of adults choose the wiser use of existing funds. This response contrasts with what Californians said when asked a similar question about higher education funding in December. Just a little over a third (36%) said that the wiser use of existing funds alone would significantly improve the quality of public higher education.

Among Californians who oppose the governor’s proposal, 64% say that the wiser use of existing funds is the best way to significantly improve the quality of the state’s roads. Only 30% say that both wiser use of existing funds and more state funding is needed.

Across parties, 80% of Republicans and 69% of independents who oppose the governor’s plan think that the wiser use of existing funds is the best approach. Notably, Democrats who oppose the governor’s plan are far more likely than those who support it to say that the wiser use of funds alone is a way to improve California’s roads, highways, and bridges (55% to 31%). If the governor hopes to win the support of some of those 42% of Democrats who oppose his plan, he will likely have to overcome the perception that transportation funds are not being put to good use now.

Learn more

Read the January PPIC Statewide Survey: Californians and Their Government
Find out more about the PPIC Statewide Survey

Video: Ending the Housing Crisis

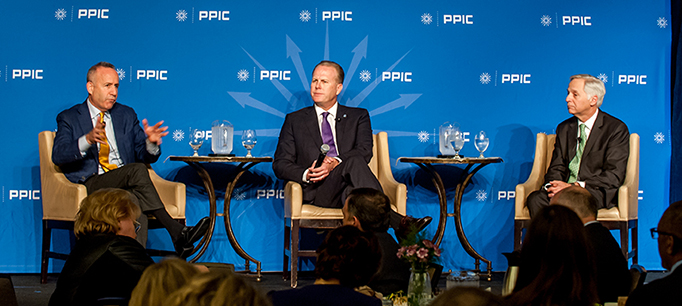
Sacramento’s mayor and San Diego’s mayor have different political perspectives, clearly evident in PPIC’s “Building California’s Future” event last week. Their views diverged on issues from high-speed rail to the voting requirements for passage of local transportation tax measures. But the mayors reached some consensus on one issue: the need for more housing and the difficulty of building the political will to end the state’s housing crisis.

“I don’t see the political coalition around housing that I see around transportation,” said Darrell Steinberg, Sacramento’s Democratic mayor.

“I could not agree more,” said Kevin Faulconer, San Diego’s Republican mayor. “It has not gotten the attention it should.”

Asked the single biggest action the state can take this year to help with our housing crisis, both mentioned regulatory reform. Steinberg said robust reform needs to be combined with a source of funding for affordable housing. He said he hoped the state can “combine these two prongs to make it easier to site housing and at the same time provide real funding to be able to subsidize and build affordable housing.”

Faulconer said reform of the 40-year-old California Environmental Quality Act (CEQA) is essential. Those who share his views contend that CEQA lawsuits have been used to slow or stop housing developments, even those deemed environmentally friendly. Faulconer said the business and housing climate are important in attracting businesses to California communities.

“We have to have really clear rules of the road, we have to follow those rules of the road,” he said. “We have to get people through the process in a defined amount of time because time is money.”

Housing was also an important part of the discussion in the panel that followed the mayors’ conversation at the PPIC event. Participants included two county supervisors, Kristin Olsen of Stanislaus County and Joe Simitian of Santa Clara County, as well as Lucy Dunn, president and CEO, Orange County Business Council. John Diaz, editorial page editor of the San Francisco Chronicle moderated.

Californians Favor Higher Taxes over Higher Tuition

After six years without tuition increases, California’s public universities are considering proposals to modestly raise tuition for California residents. The University of California (UC) has proposed increasing systemwide tuition and fees for undergraduates by $336 to a total of $12,630 for the academic year. The California State University (CSU) has proposed increasing in-state student undergraduate tuition by $270 to a total of $5,742 for full-time students. Campuses at each system charge additional fees, which currently average about $1,200 at UC and $1,400 at CSU.

A recent PPIC Statewide Survey on Californians and higher education indicates that these proposals are likely to be unpopular with the public. The survey found that Californians are concerned about the cost of college: 57% said that the overall affordability of California’s public colleges and universities is a big problem. Only 23% of Californians would be willing to increase student fees in order to increase funding for California’s public higher education system.

This is not the first time Californians have voiced disapproval of tuition increases. Before UC and CSU raised tuition in 2011, PPIC’s 2010 higher education survey found that only 35% of Californians favored increasing student fees as a way to maintain higher education funding levels in the face of state budget cuts. In 2011, our survey found that 65% of Californians were very concerned about increasing student tuition and fees as a way to deal with decreased funding.

Today, when many policy preferences are often divided along party lines, there is partisan consensus on this issue: at least 70% of Californians across parties say they would be unwilling to increase student fees to fund higher education. Indeed, less than a third of Californians across all regions and demographic groups say they would be willing to increase student fees.

At the same time, a majority of Californians (67%) believe that the current level of state funding for public colleges and universities is inadequate. So what are Californians willing to do to increase funding for public higher education? Overall, they are twice as likely to say they are willing to pay higher taxes as to say they are willing to increase student fees (48% to 23%). However, and perhaps unsurprisingly, we see notable partisan differences when it comes to willingness to pay higher taxes. While 68% of Democrats say they would be willing to pay higher taxes to increase funding for public colleges and universities, only 20% of Republicans say the same.

Another way to increase funding for California’s public colleges and universities would be to admit more out-of-state students, who pay higher tuition. Californians are somewhat divided on this issue, with half saying they would not be willing to admit more out-of-state students, while 46% say they would be willing to do so. However, only 21% of Californians support admitting more out-of-state students if this would mean admitting fewer in-state students. This view holds across party lines: only one in four Republicans (25%), and even fewer independents (21%) and Democrats (16%), are willing to admit more out-of-state students if this would mean admitting fewer in-state students. UC has proposed increasing systemwide out-of-state tuition and fees by over $1,600 to almost $40,000.

Our survey findings suggest that the proposed UC and CSU tuition and fee increases may be unpopular among Californians of all political persuasions—and that Californians’ reluctance to increase the financial burden on the state’s students may be driven by concerns about access and affordability.

Learn more

Read the PPIC Statewide Survey: Californians and Higher Education
Find out more about the PPIC Statewide Survey
Visit the PPIC Higher Education Center

Video: Grading the Higher Education System

Californians give positive grades to the three branches of the state’s public higher education system—the community colleges, California State University, and the University of California. But the PPIC Statewide Survey on higher education shows that they have big concerns about affordability. Most California adults—regardless of political party, income, or age—see it as a big problem. And when Californians are asked to name the most important issue facing the state’s public colleges and universities, affordability leads the list.

“This is really the issue that’s at the forefront of people’s minds when you’re talking about higher education,” said PPIC researcher Lunna Lopes, who presented the findings at a Sacramento briefing last week.

Two out of three Californians say state funding of public colleges and universities is inadequate. While most would support a state construction bond to fund higher education projects, there is much less consensus on other ideas to increase revenue.

Learn more

Read the December PPIC Statewide Survey: Californians and Higher Education
Find out more about the PPIC Statewide Survey

California Is Different

Mark Baldassare, PPIC president and CEO and director of the PPIC Statewide Survey, spoke to the Sacramento Press Club today (November 16, 2016). Here are his prepared remarks before a post-election discussion with Mark DiCamillo, senior vice president of Field Research Corporation and director of the Field Poll.

With the stunning victory of Donald Trump in the presidential election, it is easy to overlook the significance of the California vote. The political experience here was starkly different from the US in ways that went beyond our normal “blue state” election performance. I’m going to focus on election and polling trends that caught my attention—including citizen engagement, presidential preference, the state ballot measures, the role of government, and voter turnout. My colleague Eric McGhee has an excellent analysis of the top-two legislative races in another PPIC blog post. I’ll close with a look toward next year and the 2018 California election in light of the changing political landscape in California and the US.

Citizen engagement. The California voter rolls grew by 2.15 million in 2016 to reach a historic high of 19.4 million before the November 8 election. According to the California Secretary of State, the voter registration surge was largely a Democratic Party phenomenon, resulting in a 19-point gap between the Democrats and Republicans (45% to 26%)—the largest since 1976. Clearly, online registration and social media brought in new voters. But Hillary Clinton, Bernie Sanders, and Donald Trump shaped those voters’ party choices. One of the Republican candidate’s main messages—on immigration—simply did not resonate here. The 2016 PPIC Statewide Surveys consistently found that most Californians viewed immigrants as a benefit, favored a path to citizenship for undocumented immigrants, and opposed building a wall on the US–Mexico border.

Presidential preference. Democrat Hillary Clinton is currently defeating Republican Donald Trump by a 29-point margin in California. Clinton’s margin is higher than President Barack Obama’s in 2008 (+24) and 2012 (+23), while Trump’s support (33%) is lower than every Republican presidential candidate since 1992. Clinton is running up big margins in Los Angeles and the San Francisco Bay Area, while Trump is running behind even in Republican-leaning Orange County and “purple” areas of the state such as Fresno, Riverside, San Bernardino, and San Diego Counties. This was occurring in California even as blue areas turned red in the nation’s swing states. The margin for the presidential race in the October PPIC survey was 26 points, indicating that polls were accurate in accounting for Trump and Clinton supporters here.

State ballot measures. California also distinguished itself from the rest of the nation by asking voters to be the deciders on 17 state propositions. The September PPIC survey found satisfaction with the initiative process but unhappiness with the scale and complexity of state measures, and the oversized role of special interests in the process. Would voters just say no to all measures or skip this portion of the ballot? They did neither. They are currently approving 12 of the 17 state propositions and, in saying yes to at least 9 of the 14 citizens’ initiatives, exceeding the historical pass rate. Apparently, and in line with PPIC reports, California voters are up to the challenge of making policy at the ballot box.

Role of government. The big surprise in the 2016 California election is a sea change in voter preferences for the role of government. Californians reversed course in terms of their own previous decisions and stood apart from a number of national trends.

  • Californians passed both a cigarette tax increase (64%, Proposition 56) and marijuana legalization (56%, Proposition 64), both of which failed at the ballot earlier.
  • Years after they instituted a tough-on-crime three strikes law and mandated that schools teach only in English, the state’s voters passed criminal sentencing reform (64%, Proposition 57) and bilingual education (73%, Proposition 58).
  • While second-amendment rights were a litmus test for presidential candidates in other states, Californians expanded firearms restrictions (63%, Proposition 63).
  • Voters may be known for their distrust in state government, but they endorsed the plastic bag ban that was passed earlier by the legislature, at the same time reinforcing their “green” credentials (53%, Proposition 67).
  • Californians showed a generous streak by passing state school bonds (54%, Proposition 51), Medi-Cal funding (70%, Proposition 52), and a tax extension (62%, Proposition 55).

Notably, voter support for tax and spending propositions that we tracked in the September and October surveys were both stable and close to the election results, indicating that opinions were unmoved by the “no” campaigns. “Calexit” has become shorthand for the idea of California leaving the US. Instead, it may end up referring to Californians leaving behind the tax revolt that started here.

Voter turnout. The California Secretary of State is reporting a record-setting 15.18 million counted and unprocessed ballots in the November election. This vote count also reflects gains in the turnout among registered voters and eligible adults compared to the 2012 presidential election. Turnout rates were somewhat higher in the 2008 election. The October PPIC survey showed a high level of interest in the presidential election, and California seems to have bucked the national trend of depressed turnout. Still, only about half of the approximately 30 million California adults voted in this election. As noted in a recent PPIC report, nonvoters are mostly Latino, immigrants, lower-income, and young adults. In other words, those who don’t vote are among the most affected by changes in the role of government.

The voters have spoken and the awkward result is a conflicting policy agenda for the state government and the federal government. How will Governor Brown and the state legislature respond when the Republican president and US Congress shift gears on immigration, the Affordable Care Act, climate change, and abortion rights policies favored by California residents?

As the priorities, plans, and programs of the new president and Congress take shape, the mission of the PPIC Statewide Survey—­­to provide a voice for both adults and likely voters—takes on even greater importance.

And as we look further ahead, the next California governor will play a challenging role in managing the federal and state relationship. PPIC will invite the 2018 gubernatorial candidates to public forums next year to learn what we can about their leadership style and their vision for the state’s future in the changing political landscape in California and the US.

Video: The Mood Before Election Day

The final PPIC Statewide Survey before the November election found Hillary Clinton leading Donald Trump by 26 points among California likely voters and Kamala Harris leading Loretta Sanchez by 22 points. It also found that majorities support measures to extend a tax increase on high incomes, increase cigarette taxes, and legalize marijuana. Research associate David Kordus presented these and other key findings at a briefing in Sacramento last week.

The survey also examined issues that are likely to linger past Election Day. It finds that Californians are divided on the direction of the state. Majorities say the nation is going in the wrong direction, and they express low levels of trust in the federal government. And most Californians say the two major political parties do such a poor job that a third major party is needed.

Learn more

Read the October PPIC Statewide Survey: Californians and Their Government
Visit the PPIC Statewide Survey website

“Sin” Taxes on the Ballot This Fall

Two measures have qualified for the November ballot that ask California voters to increase so-called “sin” taxes. One measure, the Healthcare, Research, and Prevention Tobacco Tax Act, will add an additional $2.00 per pack to cigarettes sold in the state. Currently, the tax is $0.87 per pack, which ranks lower than the cigarette tax in 33 other states. The other measure, the Adult Use of Marijuana Act, proposes to legalize the recreational use of marijuana and impose a state tax on its sales.

States use sin taxes not only to raise revenue for state treasuries, but also to affect behavior. The notion is that as the price of a product goes up, consumption will drop, and with that drop, negative societal consequences—the rate of lung cancer, for instance—will decrease. In fact, revenue from sin taxes often fund related treatment or health care programs.

Though it is early on in the campaigns, Californians hold favorable views of both ballot measures. According to the May 2016 PPIC survey, 67% of likely voters favor an increase in the cigarette tax to fund health care and 60% favor marijuana legalization.

While there are a number of reasons voters may support or oppose these measures, our focus here is on the revenue implications.

How much more money could these taxes bring in?

Both measures hold promise for raising significant funds and represent an alternative source of revenue in a state that is heavily dependent upon personal income taxes. Together, they could bring in more than $2 billion in state revenue. This would be significantly more than the state’s other sin tax on alcohol, which raised about $350 million in 2014.

The state reported more than $800 million in tobacco tax revenue in 2014. An additional $2.00 per pack would more than triple the current tax, suggesting a significant jump in total revenue. The Legislative Analyst’s Office estimates that an additional $1 billion to $1.4 billion would be raised should the proposition pass.

Why wouldn’t total tobacco revenue triple? Total revenue will be determined by both the tax rate and the amount of tobacco purchased. If the increase has the desired effect, cigarette smoking will decline in the future. That, combined with the fact that California recently raised its smoking age to 21, should have an impact on total consumption. Indeed, the share of individuals who smoke cigarettes has been declining in California, from 18.6% in 1996 to 12.8% in 2014. In comparison, alcohol consumption has decreased since 1977, but has remained consistent over the past 20 years.

Nationally, California had the second-lowest cigarette smoking rate in 2014 (after Utah). But it’s worth noting that e-cigarette use nearly doubled among California adults from 1.8% in 2012 to 3.5% in 2013, complicating estimates of future revenue. If passed, the tax would also apply to e-cigarettes. If Californians use e-cigarettes as a substitute for cigarettes, then the measure will also capture revenue due to increased e-cigarette use. As we noted in our recent report, the additional revenue generated by taxing marijuana could be as much as $1 billion a year for the state. In the first full year after legalizing recreational marijuana, Colorado raised just over $120 million in state revenue, and Washington collected slightly less than $130 million. Given California’s larger population, the $1 billion figure is in the right ballpark. But since much is still unknown about the marijuana market, any estimate should be treated with caution.

How does California compare with other states?

The proposed taxes would be comparable to those currently in place in other states. If the tobacco tax passes, it would boost per capita revenue from $21 per resident to $50 per resident. This would still be below the national average of $57 per resident, though it would be much closer. For marijuana, the estimate of $1 billion in revenue would translate to about $26 per resident. Though there isn’t a national reference point for marijuana taxes, this number would be higher than the per capita amounts raised in Colorado and Washington. Interestingly, California’s alcohol tax revenue is less than most other states. On a per capita basis, California ranks 40th of the 50 states in alcohol revenue collected. In 2014, California collected only $9 per resident in alcohol taxes compared to the rest of the country, which raised $21 per resident. Doubling this rate—which would still be below the national average—could add another $350 million to state revenues.

Sources: National Institute of Alcohol Abuse and Alcoholism (NIAAA), Centers for Disease Control and Prevention (CDC), US Census, Office of Attorney General (OAG), Legislative Analyst’s Office (LAO).

Notes: Per capita alcohol consumption is taken from the NIAAA, which calculates consumption based on sales and a conversion of gallons in terms of pure alcohol (ethanol). Population data are drawn from the US Census. Cigarette smoking rates are from the CDC.

Commentary: Why We Expect Sanders Voters to Have Impact in November


This commentary was published in the Sacramento Bee on Sunday, July 3, 2016.

What’s next for Bernie Sanders supporters in the wake of a disappointing loss? They will find ballot initiatives – and one in particular – of great interest in California’s November election. For this reason, we expect to see the Sanders voters return to the polls and have a broad impact on election outcomes.

Read the full commentary on sacbee.com.

Worlds Apart: California’s Partisan Divide and the 2016 Election

With the June 7 primary behind us, it’s time to reflect on what we have learned about California’s likely voters as we look ahead to the November 8 election.

The December 2015 PPIC Statewide Survey reported a profound schism between Republicans who wanted “new ideas and a different approach” and Democrats who favored “experience and a proven track record” in a presidential candidate. Last Tuesday’s election provided more evidence of these attitudes. Donald Trump, a businessman with no political experience, won the Republican primary while Hillary Clinton, with a long record of public service, won the Democratic primary. It is now obvious that Californians’ candidate preferences are just one example of a deep partisan fissure that has emerged in the 2016 PPIC Statewide Surveys.

We found another example of this divide when we asked about the mood of the California electorate in 2016. Most Republican likely voters (78%) said the state is going in the wrong direction while most Democratic likely voters (67%) said it is going in the right direction in our May PPIC Statewide Survey. We found a similar divide in views about the direction of the US and about whether California and the US are headed into good economic times or bad ones next year.

The job approval ratings of elected officeholders also largely depend on one’s partisan stripes. President Obama has an 84% approval rating among Democratic likely voters and an 85% disapproval rating among Republican likely voters. This party split is also clear in the approval ratings of the US Supreme Court, California US Senators Barbara Boxer and Dianne Feinstein, Governor Jerry Brown, the California Legislature, and even local House members and state legislators. The only area of consensus is the overwhelming disapproval of the US Congress (84% Republican, 81% Democrat).

There are also large and consistent partisan divides over the role of government. The vast majority of Republicans—83%— want a smaller government with fewer services, while a strong majority—69%—of Democrats say they prefer a bigger government with more services.

Similar partisan differences are evident when Californians are asked about gun laws, government regulation, and economic inequality. While 64% of Republicans say the government goes too far regulating guns, 79% of Democrats say it does not do enough. A majority of Republicans—66%—say government regulation does more harm than good, while 76% of Democrats say government regulation is necessary to protect the public. And 68% of Republicans say the government should not be doing more to reduce the gap between the rich and poor, while 79% of Democrats say it should be.

Last but not least is the partisan gulf on immigration and race. There are also different perspectives on the proposal to build a wall along the entire Mexico border (60% Republicans favor; 87% Democrats oppose) and whether immigrants are a burden (66% Republicans) or a benefit (78% Democrats) to California. Most Republican likely voters (58%) say there is equal treatment in the criminal justice system while most Democratic likely voters (80%) say that blacks and minorities do not get equal treatment.

Looking ahead to the November ballot, there are starkly different views on extending a temporary income tax on the wealthy, with 68% of Republicans opposing the extension of this Proposition 30 tax and 80% of Democrats in favor of it. The results are similar when our survey asked about a state school bond (50% Republicans no, 82% Democrats yes) and marijuana legalization (56% Republicans oppose, 69% Democrats favor).

How will California’s partisan divide impact the November election? Democrats now have an 18-point edge over Republicans in voter registration (45% to 27%).The PPIC Statewide Surveys this year also indicate that independent voters are leaning in the same direction as Democratic voters in their presidential, US Senate, and ballot choices, and their overall outlook, approval ratings, and policy preferences. In this context, the May PPIC Statewide Survey found that the state’s likely voters favor the presidential candidate who stands for experience and a proven track record over the presidential candidate who stands for new ideas and a different approach. Still, Republicans overwhelmingly support their party’s standard bearer and appear to be aligned with his perspectives and policies.

California seems poised to maintain its blue status this fall. However, the geo-political segregation of the state —with Republican pockets of strength in California’s northern, inland, and rural regions—means that federal and state legislators will be elected to represent the views of voters who are worlds apart. Indeed, the political polarization and antipathy of this year’s election may result in a California Congressional delegation that will contribute to Washington gridlock and a California Legislature that will struggle to find common ground on solutions to the many challenges facing California’s future.