Testimony: California’s Future Need for Bachelor’s Degrees


Patrick Murphy, PPIC research director, testified before the Senate Budget Subcommittee Number 1 on Education at San Diego City College in San Diego today (November 1, 2016). Here are his prepared remarks.

The Public Policy Institute of California (PPIC) projects that between now and 2030 California will fall 1.1 million bachelor’s degrees short of workforce demand. Closing this gap will require substantial improvements in access to four-year colleges, transfer rates from community colleges, and completion rates among college students. This testimony describes specific targets for California’s public and private colleges and universities to help ensure that the state will have a sufficient number of highly educated workers in the future. It also briefly describes a recent pilot program in California that offers bachelor’s degrees at community colleges and similar efforts in other states in the context of closing the workforce skills gap.

PPIC senior fellow Hans Johnson, in testimony before the Assembly Budget Subcommittee Number 2, has offered a scenario for how the state might close the workforce skills gap relative to its current baseline. Assuming that college enrollment rates, completion rates, and transfer rates remain at current levels, the state will produce 3.1 million bachelor’s degrees over the next 15 years. Our closing-the-gap scenario charts a course to producing 4.2 million bachelor’s degrees by 2030—a 36% increase over the baseline for the entire projection period. It should be emphasized that this goal cannot be realized unless the state substantially improves the attainment of degrees by currently underrepresented groups, including first-generation college students, low-income students, Latinos, and African Americans.

There are two important issues to note regarding our closing-the-gap scenario. First, successfully reaching this goal requires contributions from all three of the state’s higher education systems as well as private colleges. Our scenario sets the following targets:

  • Access to four-year public institutions will increase, with eligibility increasing 5 percentage points over current levels at UC (the top 17.5% of high school graduates will be eligible for UC, up from the 12.5% set by California’s Master Plan for Higher Education) and 6.7 percentage points at CSU (the top 40% will be eligible for CSU, up from the top third). These new eligibility levels will be phased in over an eight-year period.
  • The number of transfer students from community colleges will grow incrementally to 35% above baseline levels over a five-year period.
  • Completion rates will increase 9 percentage points at UC and 17 percentage points at CSU. At UC, completion rates for students who enroll as freshmen will increase incrementally from 83% in 2016 to 92% by 2026. Completion rates for freshmen at CSU will increase incrementally from 57% in 2016 to 74% by 2030.
  • Private nonprofit colleges, which produce about one-third of all bachelor’s degrees annually, will keep pace with the relative rate of growth, increasing their production of degrees by 26% over baseline levels.

The second notable point is that there is no single solution to closing this gap. Our scenario represents only one path toward reaching the number of bachelor’s-degree holders the state needs. Based on the structure and performance of the current system, our scenario estimates the relative contribution that higher education segments could make in the future. Other combinations are conceivable. For example, a smaller expansion in eligibility and greater improvements in completion rates could also close the gap.

The assumptions underpinning our closing-the-gap scenario are clearly ambitious. Are the assumptions realistic? Is it possible to, for example, raise the completion rate at CSUs by 17 percentage points? Based on recent improvements, we think so. In another PPIC report, my colleagues Jacob Jackson and Kevin Cook observed that, from 2009 to 2015, the CSU system increased its six-year graduation rate 6 percentage points, from 51% to 57%. These increases came at a time when the system was focused on improving completion as part of its 2015 Graduation Initiative. This past September, Chancellor White announced that CSU seeks even greater improvements as part of its 2025 Graduation Initiative. The recently announced goals, including achieving a six-year graduation rate of 70% by 2025, are consistent with our closing-the-gap scenario.

We did not include in our scenario any assumptions regarding the potential for California’s community colleges to produce bachelor’s degrees. Beginning in 2015, the California Community Colleges Chancellor’s Office granted approval to 15 colleges to offer bachelor’s degrees in specific majors as a pilot program under Senate Bill 850. At this time, these programs are quite small and it is difficult to predict what impact they may have on the long-term production of bachelor’s degrees. A brief review of the experiences of two other states provides examples of different trajectories this pilot program could take.

Community colleges in Washington State began a pilot program offering applied bachelor’s degrees following legislation passed in 2005. The program, which focuses on fields currently not addressed by the state’s four-year public institutions, became part of the state’s regular programming in 2010. Community colleges currently offer bachelor’s degrees in 30 fields but produced only about 300 (less than 1%) of the more than 33,000 bachelor’s degrees conferred in the state in 2015.

In Florida, legislation authorizing community colleges to begin offering bachelor’s degrees passed in 2001. Florida has been quite aggressive in expanding the programs and schools offering bachelor’s degrees, with 24 of the state’s 28 colleges offering a total of 170 such programs. In 2015, these colleges produced 6,900 (about 7%) of the state’s 100,500 bachelor’s degrees.

As it is currently configured, California’s pilot program resembles the Washington approach. It has the potential to supply applied degrees in specific fields, making a contribution to the demand for skilled labor in some professions. But, due to its small scale, it is unlikely to have a significant impact on the overall workforce skills gap in the near term.

This is not to suggest that community colleges do not play a role in meeting the growing demand for bachelor’s degrees. In fact, about 103,000 community college students in California transfer to four-year institutions each year. Our closing-the-gap scenario assumes an increase in the number of transfers of 35% over five years—which would mean an additional 36,000 students moving on to four-year institutions. Should those students complete their bachelor’s degrees at rates similar to today’s transfer students, this would lead to tens of thousands of additional bachelor’s-degree holders by 2025.

Community colleges, UC, CSU, and private colleges must all play a role in the state’s efforts to meet the demands of a changing economy. Closing the workforce skills gap will lead to better economic outcomes for all Californians, increased state revenues, and reduced social service demands.
Free University Tuition: How Many California Students Would Benefit?

During this election cycle, several candidates have proposed making public college tuition free. While some at the state and national levels are supporting tuition-free community college, Hillary Clinton has outlined a plan that includes four-year colleges—she proposes free tuition for students whose families earn less than $85,000. By 2021 that income threshold would rise to $125,000. How many students in California might benefit from such a plan?

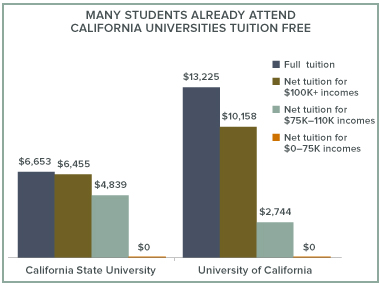
Many students already attend California universities tuition free

California’s financial aid program, Cal Grants, provides grants (funding that students do not have to pay back) for full tuition for the state’s lowest-income students, as well money toward books and living expenses for some of them. Through a combination of Cal Grants, federal aid, and institutional aid, UC’s Blue and Gold Opportunity plan guarantees free tuition for any family making $80,000 a year or less. CSU has a similar plan, the State University Grant, which bases the amount a family will pay on a number of factors. On average, students who receive financial aid pay no tuition at UC or CSU if their families make $75,000 or less.
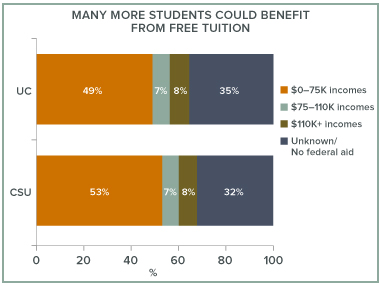
Expanding free tuition could impact thousands of California families

While the data on family income are not perfect, they can help us estimate how many students we might expect to benefit from free tuition. Right now, students from families in the $0 to $75,000 range make up about 49% of entering students at UC and 53% at CSU.

Raising the cap to $110,000—or beyond—would cover at least another 7% of students entering UC (2,300 students) and CSU (3,900 students) in 2014. The average student whose family income is between $75,000 and $110,000 would save about $4,839 at CSU or $2,744 at UC, resulting in more than $25 million in combined tuition savings for those thousands of families.

These estimates may be low, as many middle-class students who currently do not qualify for financial aid may have income levels that that would fall below the cap of an expanded program. Also, a nationwide free tuition program might encourage many low-income students who are currently scared off by the high sticker prices to apply to college or university.

The details of the plan would matter, of course. But if the federal government were to cover all of the $25 million needed to expand full-tuition guarantees at UC and CSU, it’s possible that thousands of low- and middle-income California students could benefit.

Notes: Data for both figures are from IPEDS for entering first-time California resident freshmen in fall 2014. Net tuition applies only to students who received some form of federal aid (grants or loans), which includes 68% of students at CSU and 65% of the students at UC.

Learn more

Visit the PPIC Higher Education Center

Improving On-Time Completion: Year-Round Pell Grants

California and the nation as a whole are pushing for more students to graduate from college in four years. This would not only open up more spots for new students, but also allow students to spend less money on tuition and fees and enter the workforce sooner―creating benefits for both students and the state.

In the graduating class of 2015, 64% of UC and 19% of CSU students graduated within four years. While both systems have made commendable gains since the graduating class of 2005―UC’s on-time graduation rate is 10 percentage points higher and CSU’s has increased by 6 points―there is room for improvement.

We recently looked at the University of Hawai‘i’s 15 to Finish campaign, which has shown early success in encouraging students to take more units per semester and improving on-time graduation rates. However, not all students can take 15 units every semester—and this inability can increase their time to completion. For example, a student who takes 12 or 13 units each semester needs an additional year to complete a four-year degree.

One possible way to help lower-income students graduate on time is to bring back the year-round Pell Grant, which was introduced in the 2009–10 academic year to supplement the original Federal Pell program. The year-round grant allowed students who had exhausted their academic-year Pell awards to pay for summer courses as long as at least one of the units counted toward the next academic year. Funding was also available to students who had not completed the standard unit load due to unforeseen circumstances, allowing them to catch up during the summer. Either way, the year-round Pell provided students unable to take 15 units a semester a pathway to graduate on time.

The year-round Pell was cut in 2011 in response to rising costs—a result of more students becoming eligible and enrolling in college. This cut was part of a compromise that prevented proposed reductions in the maximum award amount from occurring. Because the year-round program was short-lived, we can’t assess its impact. Congress has shown some interest in reviving the year-round Pell, but lawmakers have not passed a bill restoring it, as the Senate and House have differing views on bringing it back.

Given the current focus on improving both student completion and institutional efficiency, it may be time to take another look at a year-round Pell Grant program. Providing more opportunities, especially affordable ones, for summer coursework could help more students graduate on time, make better use of campuses, and help California—and the rest of the nation—meet future demand for educated workers.

Learn More

Visit the PPIC Higher Education Center

Spending on Corrections and Higher Education

California has long been criticized for its growing corrections expenditures, especially as General Fund spending on higher education has declined. The beginning of a new budget year is a good time to examine where the state now stands on spending in these two key areas.

California’s legislature recently adopted a budget for 2016–2017 that devotes $14.5 billion of General Fund revenue to higher education institutions, including the University of California, California State University, and California’s community college system. It allocates $10.6 billion for operations of the California Department of Corrections and Rehabilitation (CDCR), which is responsible for adults in state custody and parolees under state jurisdiction.

These budget allocations reflect a striking shift from California’s budget of forty years ago, when the state spent a larger share on higher education and a much smaller share on corrections. But by the 2008–2009 budget year, allocations to higher education (11.1%) and corrections (10.7%) were almost identical. In the years since, higher education spending has outpaced corrections in relative terms, largely because recent criminal justice reforms have drawn down the number of adults in state custody and on parole. Nonetheless, California spends more on corrections and less on higher education today, in relative terms, than at nearly any point in the past thirty years.

Despite these dramatic trends, spending in each area has actually increased alongside of growth in the populations served. Enrollment in higher education institutions has increased roughly 50% since the 1977–78 academic year; the budget has increased 65% (according to CPEC Fiscal Profiles). Until 2011’s realignment of California’s corrections responsibilities, the number of adults in CDCR custody had increased 555% and the budget increased 526% (CDCR Monthly Population Reports).

Clearly the costs of serving these two populations are different. On average, the cost of the CDCR population is much higher than the cost of students in higher education. Within each area, costs per person vary as well. The cost of educating a student at UC far exceeds the cost of doing so at a community college. Similarly, the cost of incarceration far exceeds the cost of supervising a parolee in the community. Although the per person cost of delivering services has risen over time, the dramatic increase in the prison population has been the key driver of the dramatic shift.

To reverse these trends, the state must identify and disseminate cost-effective strategies to reduce recidivism, further diminish California’s crime rates, and ultimately reduce the prison population enough to allow for the closure of state facilities or the elimination of in-state and out-of-state contract prison beds used to relieve overcrowding. Corrections realignment reduced state prison and parolee populations, but the anticipated savings from this policy shift have yet to materialize. Moreover, the most recent reports show a small uptick in the corrections population (CDCR Monthly Population Reports). ​

In the meantime, California needs to find ways to accommodate more students in its higher education systems—which it could do at relatively low cost by reducing time to degree, or at higher cost by increasing financial aid or expanding the number of slots for students. At the end of the day, ensuring that more of California’s youth attend and complete college will reap positive long-term benefits for the state, helping to meet the needs of the state’s future economy and create a brighter future for all Californians.

Chart source: California Department of Finance Chart C-1 Program Expenditures by Fund.

Learn more

Will California Run Out of College Graduates?
“California’s State Budget”
California’s Future: Corrections

Getting Students from High-Need Schools into the UC System

The newly approved state budget contains two strategies to enroll more students from disadvantaged backgrounds in the University of California (UC) system and other postsecondary institutions. These spending commitments are designed to increase college readiness and access for the state’s most vulnerable students.

First, the state allocated $200 million to the new College Readiness Block Grant program, which funds “additional services that support access and successful transition to college” for three categories of students: English Learners, students from low-income families, and foster youth. This grant may support a variety of activities related to college readiness—including efforts to increase the number of students completing college preparation courses, such as the a–g course sequence required to attend UC. The College Readiness Block Grant is available to any school that serves students from these designated categories.

Second, the budget also includes funding for the UC system to monitor and increase application, admission, enrollment, and graduation rates among students from “high-need” schools—high schools where 75% or more of the students fall into one of the categories above. Currently, we know little about whether students from high-need schools attend UC and how to get more of them to enroll. I combined data on graduation from public schools and UC enrollment to explore these questions.

What do we know about high-need schools?

In 2015, about 38% of California’s high schools (480 total) were high need based on high rates of enrollment for English Learner, low-income, and foster care students. These schools educate about 34% of all high school students in the state. High-need schools also serve higher proportions of students traditionally underrepresented at UC: about 43% of the African American students in the state and about 51% of California’s Latino students.

High-need schools are less likely to produce graduates who have completed the a–g course sequence required to attend UC. The percentage of all graduates who complete a–g courses at the typical (50th percentile) high-need school is 39%, compared to 49% at regular schools. However, there is a lot of overlap. For example, the top quarter of high-need schools have higher percentages of a–g graduates than the bottom half of regular schools.

Do graduates from high-need schools enroll at a UC?

On average, students from high-need schools are slightly less likely to enroll in a UC. About 5.4% of all graduates enroll in a UC at a typical high-need school, compared to 6.5% for a typical regular school.

However, a–g completion rates are likely driving the difference in UC enrollment between high-need schools and regular schools, since students at regular schools are more likely to have completed a–g courses. When examining the number of UC enrollees compared to the number of a–g graduates a school produces, we see no difference between regular and high-need schools.

The College Readiness Block Grant program’s focus on helping to prepare students for college might be an effective strategy to increase UC enrollment from high-need schools that would not require many changes to admissions policy in the UC system. Evidence suggests that improving a–g completion rates at high-need schools will help boost UC enrollment of graduates from these schools.

Top figure note: Data from California Department of Education. Spring 2015 graduates. N=1,276 schools.

Bottom figure note: Data from California Department of Education, University of California, and California Postsecondary Education Commission (CPEC). Spring 2015 graduates compared to fall 2015 enrollees. “All graduates” refers to the ratio of graduates to enrollees from the school. “A–G graduates” refers to the ratio of a–g graduates to enrollees from the school. Fifteen percent of schools were not in the crosswalk provided by CPEC and are not used in the comparison of enrollees. Another 8% are not represented in the UC data set, but are present in the UC data and crosswalk, and thus are given zero enrollees for the purpose of these figures. N=1,072 schools.

Does Guaranteed Tuition Lower College Costs?


This post is part of an occasional series examining how California can learn from policies in other states.

California’s public universities have a volatile tuition history. Stretches without increases are followed by sharp tuition hikes. The most recent increases in 2008—during the Great Recession—followed a pattern seen throughout the US: recessions generally cause states to allocate less money to their public universities, and the universities respond to the lost revenue by increasing tuition. Other states with similar tuition volatility have enacted policies to make tuition more predictable for students and their families.

Policy: Illinois Undergraduate Guaranteed Tuition Program

Since 2004, Illinois law has guaranteed that students who enroll in any of the state’s public universities pay the same tuition for four years. Any tuition increases that occur during those four years affect only the new class of freshmen. This allows students and their families to plan for the four years of college financially. But the policy covers only tuition—so students are still subject to yearly increases in other costs, such as room and board, other fees, and books. These additional expenses represent a large portion of the overall cost of college but are generally less volatile than tuition.

How does guaranteed tuition in Illinois compare to year-to-year tuition in California? A University of Illinois Urbana–Champaign student starting in 2008 and finishing in four years knew in advance that tuition would be $9,242 for all four years, leaving the student with an overall bill of $36,968. For an incoming UC Berkeley student, tuition was a relatively low $6,262 in 2008, but that student did not know that tuition would increase 79% by the fourth year and would add up to more than $34,000.


Policy Impact

Institutions that guarantee the same tuition for four years risk bearing the cost of inflation and other external factors (such as a reductions in state funding). This risk could be handled in many ways, including dramatically increasing tuition for the newest class of students, accepting more out-of-state students (who pay much higher tuition), or setting tuition at a higher level than necessary in the first year of a student’s enrollment. In fact, a recent study suggests that colleges affected by the Illinois guaranteed tuition law have raised tuition for incoming students by 26% to 30%—or about $1,500. This has resulted in students paying about 7% more tuition on average than they would have paid without the policy. In short, these students may have traded affordability for predictability.

Lessons for California

A similar policy in California would make tuition predictable for students, but public universities would still be at the mercy of the state budget process, recessions, inflation, and other factors. The universities would have to plan very carefully or risk not having enough revenue. The current practice of setting tuition year to year may allow the state’s universities to be more flexible and responsive to changes in revenue. This practice makes tuition volatile, but it may offer students a cheaper degree.

Learn more

Visit the PPIC Higher Education Center

Increasing On-Time Graduation Rates in Hawai‘i


This post is part of an occasional series examining how California can learn from policies in other states.

While 57 percent of students at California State University (CSU) earn a bachelor’s degree, only 19 percent of first-time freshmen graduate in four years. Taking longer to graduate increases the cost of the degree and delays entry into the workforce.

One reason students are not graduating in four years is because they are not taking a full course load of 15 units—about five classes—per term. For financial aid purposes, students are considered full-time if they enroll in 12 units per term—about four classes. But taking 12 units means taking an extra year to graduate. Students have many reasons for taking less than a full load: family obligations, employment, inadequate preparation for the rigor of college courses, or the cost of extra books. It is also possible that students do not realize they need 15 units per term to graduate in four years. UCLA’s Cooperative Institutional Research Program found that 86 percent of freshmen nationwide believe they will graduate in four years, but only about 55 percent actually do so. CSU may be able to learn from 15 to Finish, a campaign adopted by the University of Hawai‘i in 2011 to increase student enrollment in 15 units per term and increase their four-year graduation rates.

Policy: University of Hawai‘i’s 15 to Finish Campaign

In 2010, the University of Hawai‘i system (UH) launched the Hawai‘i Graduation Initiative (HGI) to increase college participation and completion. One of HGI’s strategies is a 15 to Finish campaign to encourage university and community college students to enroll in 15 units a term so they can graduate in four years. Other HGI strategies include creating block or cohort scheduling so that groups of students take the same courses together; reducing summer tuition; and developing academic roadmaps to help freshmen plan their course sequences to graduate on-time. The 15 to Finish campaign’s communication strategy highlights the need to take 15 credits per term and the benefits of graduating in four years in television commercials, informational handouts, and student orientations. It also markets the additional three units as “free” because tuition is the same for 12 and 15 units.

Policy Impact

The early results of UH’s 15 to Finish campaign look promising. Between 2011 and 2013, enrollment in 15 units per term rose by about 5 percentage points, to 25 percent of the UH student population enrolled in 15 units. More important, the system’s four-year graduation rate has risen 7.2 percentage points since the graduating class of 2012, to 25 percent. At CSU, the four-year graduation rate has improved just 2.9 percentage points, to 19 percent, over the same period.

Lessons for California

CSU’s 2015 Graduation Initiative was successful in raising six-year graduation rates. As the system launches a new 2025 Graduation Initiative, which focuses in part on increasing four-year graduation rates, campuses should consider implementing a media strategy to inform students about the three “free” units per term that will help them graduate on-time. One campus, Cal State LA, has already started: it launched a 15 to Finish campaign in August 2015, in anticipation of its transition to a semester calendar.

A system-wide 15 to Finish campaign could also persuade some campuses to stop discouraging students from taking 15 units if they work. It would be more helpful for campuses to inform students they need 15 units a semester to graduate in four years and give them estimates of the number of homework hours created by this course load, so they can make their own decisions about how many units to take each term.

This kind of messaging could also help UC and the community colleges increase on-time completion rates. It could be a relatively simple way to create more room for new students and increase the number of college graduates in our state.

Learn more

Visit the PPIC Higher Education Center

Race and College Admissions in Texas


This post is part of an occasional series examining how California can learn from policies in other states.

Passed in 1996, California’s Proposition 209 prohibits colleges from considering race as a factor in admissions. Partly as a result, the University of California (UC) system does not fully reflect the diversity of the state’s high school graduates, a cause for concern among many observers. This disparity is even greater at the most elite campuses: UC Berkeley and UCLA. Other states facing bans on race-based affirmative action, including Texas, have developed alternative policies to address racial equity in college admissions.

Policy: Texas’s Top 10% Plan

In 1998, Texas instituted a two-part plan to promote diversity at its universities in response to the state’s ban on race-based affirmative action. The first part, the Texas Top 10% Plan, guarantees admission to any public Texas university to students in the top 10% of their high school’s graduating class. The plan relies on the fact that Texas high schools are highly segregated by race and income to produce a diverse set of students with guaranteed admission.

The second part of the plan fills any remaining spots at public universities with students from outside of the top 10%, and allows campuses to consider many factors, including race, during this process. This second part is being called into question in the Fisher v. University of Texas affirmative action case that was recently argued in front of the Supreme Court.

Policy Impact

Following the law’s implementation, the top school in the state, the University of Texas at Austin (UT Austin), saw more applications and enrollees from traditionally underrepresented high schools—those with high concentrations of minority students, from rural areas or small and midsize cities, and from less affluent regions throughout Texas. The policy also likely encouraged Latino students to apply and gain access to top Texas universities. Today, a majority of UT Austin students are top 10% students. The policy, however, did not produce the same diversity levels as affirmative action.

Lessons for California

UC already has a program called Eligibility in the Local Context (ELC), which guarantees admission for eligible students who are in the top 9% of their high school. Unlike the Texas plan, ELC does not guarantee students admission to the school of their choice—they are only guaranteed a spot somewhere in the UC system. Students who are eligible but do not get into their campus of choice are offered a spot at a campus with space—most often UC Merced. In 2014, over 11,000 UC-eligible students were referred to UC Merced, but very few enrolled.

UC’s guaranteed-admission plan has not led to high levels of diversity at its elite campuses. But would a guaranteed-choice plan like Texas’s work in California? A recent report by the Civil Rights Project shows that California has among the most segregated K–12 schools in the nation, so guaranteeing top students a spot at their preferred UC campus may give students in underrepresented groups across California a path to the top universities that ELC does not currently provide.

More research is needed to determine how California’s most competitive and prestigious public universities would deal with even higher demand. Texas’s results show that guaranteed admission alone can’t produce the same results as affirmative action, but it might be a part of an effective plan to remedy underrepresentation in California’s top universities.

Learn more

Testimony: Closing California’s Workforce Skills Gap

Hans Johnson, director of the PPIC Higher Education Center and PPIC senior fellow, testified before the Assembly Budget Subcommittee Number 2 on Education Finance in Sacramento yesterday (May 17, 2016). Here are his prepared remarks.


The Public Policy Institute of California (PPIC) projects that between now and 2030 California will fall 1.1 million bachelor’s degrees short of workforce demand.1 Closing this gap will require substantial improvements in access to four-year colleges, transfer rates from community colleges, and completion rates among students who enroll in college. In this testimony, PPIC identifies specific goals for access, transfer, and completion at California’s public colleges and universities, and increases in private colleges that together could close the workforce skills gap.

Our work on this issue emphasizes that closing the workforce skills gap will require strong improvements in college enrollment and completion among underrepresented groups, including low-income students, first-generation college students, Latinos, and African Americans. California cannot succeed economically unless gaps in educational attainment are eliminated or at least substantially reduced. A forthcoming report from PPIC will show how new goals for access, completion, and transfer will improve equity in California.

In our baseline scenario, which is based on current practices and procedures, California’s public and private higher education institutions will produce 3.1 million bachelor’s degrees between 2015–16 and 2029–30. This baseline scenario assumes that the state’s college enrollment rates, completion rates, and transfer rates will remain at current levels.

Our “closing-the-gap” scenario charts a course to producing 4.2 million bachelor’s degrees over the next 15 years. In this scenario, the total number of bachelor’s degrees awarded in 2029–30 would be 60 percent higher than in the baseline scenario—and it would be 72 percent higher than the number of degrees awarded in 2014–15. Such dramatic increases are not entirely without precedent. Between 2002–03 and 2014–15, the annual number of bachelor’s degrees awarded by California’s public and private universities increased almost 50 percent. Gains in earlier periods were even more impressive. For example, between 1964–65 and 1979–80 the number of bachelor’s degrees awarded at CSU increased 95 percent.

In the recent past, growth in the number of bachelor’s degrees awarded at UC and CSU was fueled primarily by increases in the number of students who enrolled in college and secondarily by increases in completion rates. Even though the share of high school graduates entering UC and CSU did not change appreciably, enrollment increased as the number of high school graduates grew.

The California Department of Finance projects that the number of high school graduates will not change substantially over the next fifteen years. This means that increasing the number of bachelor’s degrees awarded will require changes in three key thresholds in the education pipeline from high school to college to degree.

  • First, the share of recent high school graduates eligible for and enrolling in four-year colleges will need to increase.
  • Second, persistence and completion rates for students enrolled in college must increase.
  • Third, the number of students who transfer from community colleges to four-year colleges (or return to college) must increase.

The exact mix of improvements in these three areas is not set in stone. Our closing-the-gap scenario is based on empirical trends, and our current focus is on public institutions. We assume that private colleges will keep pace with those in the public sector, continuing to produce about a third of all bachelor’s degrees awarded each year. Also, we have not incorporated applied bachelor’s degrees awarded by the state’s community colleges, as those numbers are still very small. This means that UC and CSU together would need to produce an additional 730,000 bachelor’s degrees over this period and private colleges would need to produce an additional 340,000 bachelor’s degrees (a total of 1.1 million) to fully close the degree gap by 2030. Private nonprofit colleges would account for the vast majority of the additional degrees awarded by the private sector.

Our initial closing-the-gap scenario sets the following targets for the state’s public colleges and universities:

  • Eligibility will increase 5 percentage points over current levels at UC (the top 17.5 percent of high school graduates will be eligible for UC, up from the 12.5 percent share set by California’s Master Plan for Higher Education) and 6.7 percentage points at CSU (the top 40 percent will be eligible for CSU, up from the top third). These new eligibility levels will be phased in over an eight-year period.
  • The number of transfer students will increase 35 percent over baseline levels. These increases will be phased in over a five-year period.
  • Completion rates will increase 9 percentage points at UC and 17 percentage points at CSU. At UC, completion rates for students who enroll as freshmen will increase incrementally from 83 percent in 2016 to 92 percent by 2026. Completion rates for freshmen at CSU will increase incrementally from 57 percent in 2016 to 74 percent by 2030. There will be similar increases in completion rates for transfer students at both institutions.

CSU will account for most of the increase in degrees awarded over the entire projection period—it will award 481,000 additional degrees, compared to UC’s increase of 251,000. This is both because CSU is a larger institution, enrolling many more students than UC, and because CSU has much more room for improvement in graduation rates. Private nonprofit colleges would also play an important role, adding an additional 206,000 degrees. Other additional sources, such as private for-profit colleges, online degree programs, and bachelor’s degrees awarded by community colleges, will also need to play a role (see Table 1).

Most of the projected increase in degrees awarded at CSU comes from improvements in completion, while increased eligibility accounts for almost half of UC’s increase. Increased transfer rates will also be necessary to close the gap (see Table 2).

Of course, this is just one scenario for closing the workforce skills gap (our interactive model is available upon request). In the future, we expect to develop alternative closing-the-gap scenarios; we will also examine the potential impact of shortening the time it takes students to get their degrees. Additional work should assess the role that private institutions might play. Other scenarios might involve different assumptions and targets. But, however it is accomplished, closing the gap will lead to better economic outcomes for all Californians, increased state revenues, and reduced social service demands.

1. Hans Johnson, Marisol Cuellar Mejia, and Sarah Bohn, Will California Run Out of College Graduates? (PPIC, 2015).
Figure note (middle): “Other” includes online degrees, private for-profit degrees, and applied bachelor’s degrees awarded by the community colleges.
Photo credit: Public Affairs/Sacramento State

Early Results from Education Reforms

California’s K–12 system is implementing an unprecedented number of reforms. The state’s school funding system and curriculum standards are new, as are all statewide tests. A new school accountability system is being developed. A number of large urban districts are changing their high school graduation requirements. These reforms are designed to equalize opportunities for students and close achievement gaps among demographic groups.

It will be some time before we know what all of these changes add up to, but PPIC researchers who examined the early results of two reforms presented their findings at a PPIC event in Sacramento last week.

California’s New Standardized Tests

PPIC senior fellow Laura Hill summarized the results of California’s new standardized tests, the focus of a PPIC report she coauthored. The scores show that English Learners and economically disadvantaged students are far behind other student groups—possibly farther behind than initially thought. As the accountability system evolves in the state, the test results are an important call to action for districts and schools struggling to help high-need students, Hill said. High-need students did well in some schools and districts, and the first-year results provide an opportunity to learn from their experiences.

College Prep for All?

Julian Betts, an economics professor at the University of California, San Diego, and PPIC adjunct fellow, examined a high school graduation requirement that makes college preparatory courses mandatory for all students. Major urban school districts—including Los Angeles, San Diego, San Francisco, and Oakland—recently implemented this requirement, making it mandatory for students to complete the a–g sequence of classes required for admission to the University of California or California State University. Based on a PPIC analysis of the San Diego Unified School Districts’ Class of 2016, Betts and his coauthors concluded that this requirement is likely to help many students but damage the prospects of others. He suggested steps that San Diego and other districts can take to help lower-achieving students meet the new graduation goals.

Learn more

Visit PPIC’s K–12 education pages
Visit the PPIC Higher Education Center