Many Low-Income Families Left Out of Federal Stimulus Benefits

As part of the federal response to COVID-19, the IRS has started issuing stimulus checks—to boost consumer confidence—directly to millions of families. For the record number of Californians who have lost jobs, hours, and certainty around their incomes, these payments could come just in time.

We estimate that about 81% of Californians live in a family that will receive an “economic impact payment,” with the typical family receiving around $2,200. In total, Californians could receive about $26 billion through the program.

However, nearly 20% of families are unlikely to receive a stimulus check. Because the payments phase out as incomes rise, most of these families are above the income cutoff ($99,000 for single tax filers and $198,000 for joint filers without children). But nearly a third are among the state’s lowest income families. In part, this reflects the fact that only people who have filed taxes recently, or who receive either supplemental security income (SSI) or social security, will receive a check.

People with very low incomes are not required to file taxes, and they will not receive stimulus checks unless they actively share their banking details with the IRS. Partly for this reason, our estimates indicate that just 65% of people in families with the lowest 10% of incomes—less than about $22,000 a year for a family of four—are likely to receive a check.

By comparison, 90% to 97% of those in middle-income families—with annual incomes of $52,000 to $176,000—are likely to receive a check.
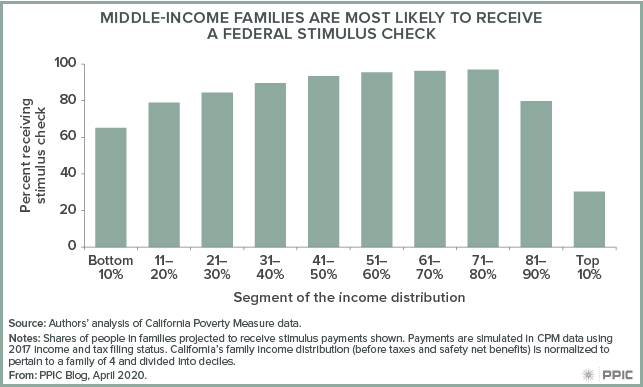
figure - Middle-Income Families Are Most Likely To Receive a Federal Stimulus Check

Yet even if all Californians who do not file taxes submit their information to the IRS, people in low-income families will still receive checks at lower rates than middle-income families. Because many low-income families include undocumented residents, the entire family is ineligible for these federal payments. If families with undocumented members were eligible, all families from the 11th to 80th percentiles of the income distribution could potentially receive a check.

To help Californians during this crisis, the state’s safety net will need to reach those most affected economically. The temporary expansion of unemployment insurance will provide much more aid to certain low-income families than the federal stimulus payments. And California’s recently announced Disaster Relief Fund, which will use public and private funds to provide up to $1,000 per household to families of some undocumented immigrants, will help to fill in certain gaps. But while replacing wages is important, a response focused only on wages would skip many people in need.

Food assistance programs like CalFresh and school meals are also critical safety net supports because of their wide reach, and expansions are also underway. Along with the federal stimulus payments, these are important steps, but—depending on the length and the depth of the crisis—more remains to be done.
Early Insights on California’s Economic Downturn

California’s unemployment rate jumped from a historically low 3.9% to 5.3% in March. For comparison, it took a full year from the official start of the Great Recession for unemployment to increase by 1.4 percentage points (although the levels were higher: 5.9% in December 2007 to 7.3% in December 2008). Notably, the March rate is based on data from the middle of the month, so it does not fully reflect the massive layoffs that occurred as the COVID-19 pandemic took hold.

Between March 15 and April 18, 3.4 million Californians applied for unemployment insurance. There has been much forecasting (including by us) about the sectors and workers that will feel the immediate effects of the downturn. We do not have demographic breakdowns and we don’t know which industries employed these workers. But recently released labor market data can provide some new insights.

By mid-March, California had recorded a net loss of 100,000 jobs, comprising about one-seventh the decline nationwide and reflecting the state’s early response to COVID-19 crisis. That’s less than 1% of the state’s 17 million jobs. The lion’s share of job loss (more than 80%) occurred in three service sectors: arts, entertainment, and recreation; accommodation and food; and “other services” (a category that includes automotive repair, personal care, and dry cleaning).

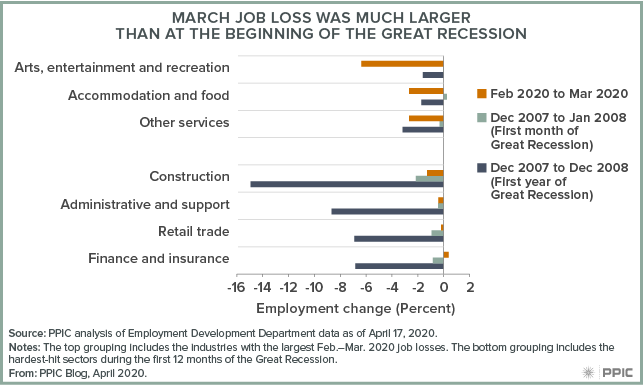
A comparison with the Great Recession highlights the severity of the current situation. Between February and March this year, employment in arts, entertainment and recreation fell 6.4%. Over the first year of the Great Recession, employment in this sector fell 1.6%. The number of jobs lost in the accommodation and food service sector was much higher between February and March, but these losses represented only 2.7% of the workforce in this much-larger sector.

A look at job losses in the industries that were hit hardest during the Great Recession shows that jobs are being lost much more quickly during the COVID-19 crisis. In the first month, construction—the recession’s most severely affected industry—saw a 2.2% decline, and no other sector experienced losses greater than 2%.

figure - March Jobs Loss Was Much Larger Than at the Beginning of the Great Recession

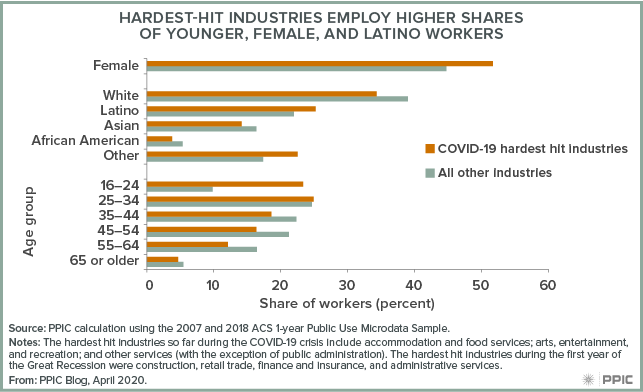
These initial data clearly show that the current crisis is hitting a different set of sectors than the Great Recession. It also shows that workers in the initially affected industries are more likely to be women (52% versus 45%), Latinos (25% versus 22%), and young adults (23% versus 10%) compared to workers in other sectors—and to workers in the hardest-hit industries during the first year of the Great Recession.

figure - Hardest-Hit Industries Employ Higher Shares of Younger, Female, and Latino Workers

As the current crisis continues to unfold, a more complete picture of the workers and industries affected will emerge. The staggering number of recent unemployment claims indicates that the losses in the March data are only the tip of the iceberg. April data will no doubt show deeper declines and a widening impact across sectors.

Unemployment insurance will provide an important economic backstop for many workers over the next several months. However, it will be important to monitor the workers and industries being affected by this crisis, both to ensure that policy efforts are directed where they are most needed and to inform additional measures to mitigate the economic damage.

California’s Quick Response to COVID-19 Likely Saved Lives

As of April 21, nearly 5,000 Californians are hospitalized and more than 1,300 have died due to COVID-19, but proactive public health measures may have safeguarded many others. Because the coronavirus spreads exponentially, days matter. And early actions before the statewide shelter-in-place order may have proved especially effective in reducing transmission.

The Bay Area had some of the state’s earliest cases of coronavirus, which spurred a rapid response. Santa Clara was the first county to declare a public health emergency, and large companies in the region asked employees to work from home as early as the first week of March.

Seven Bay Area counties—including Alameda, Contra Costa, Marin, San Francisco, San Mateo, Santa Clara, and Santa Cruz—implemented shelter-in-place orders beginning on March 17. Los Angeles County instituted a comparable order mere days later, but the virus was already spreading rapidly.

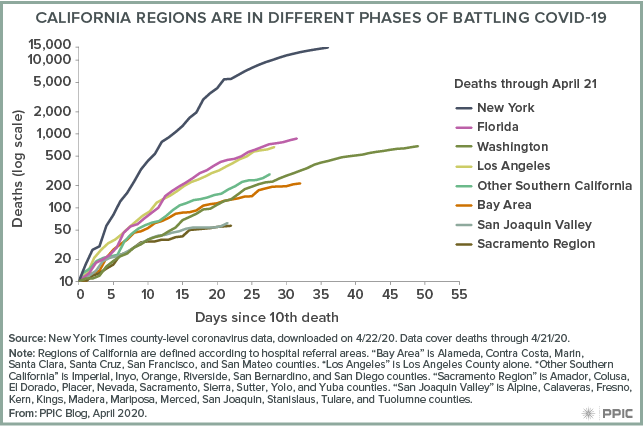
As of now, regions are in different phases of flattening the COVID-19 death curve. In Los Angeles County, the last week of data suggest the number of deaths doubles about every 8 days. That is a faster rate than Florida (12 days), but still far slower than New York in its deadliest week—when deaths doubled almost every day.

Other parts of Southern California also saw a spike, with deaths doubling every 8 days. Meanwhile, at 12 days, deaths in the Bay Area are doubling more slowly, as they are in the Sacramento region at 15 days. Both the San Joaquin Valley and other parts of the state have essentially plateaued at 19 and 32 days.

figure - California Regions Are in Different Phases of Battling COVID-19

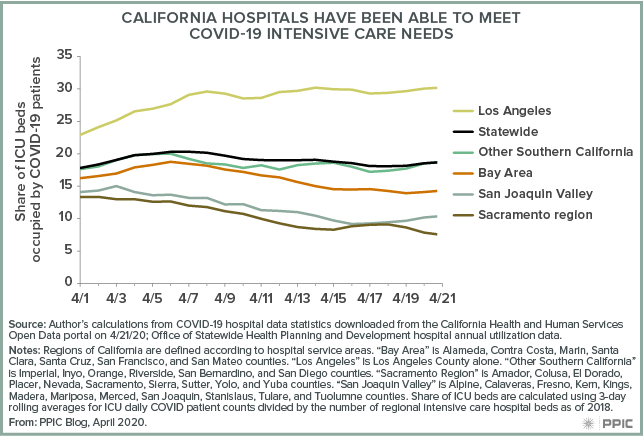
Local policies have also curbed demand for COVID-19 hospital care. Statewide, hospitalizations and ICU beds filled due to COVID-19 have been trending downward for two weeks, but have ticked up slightly the last few days. Certain counties—notably Los Angeles—have continued to see an upward trend in COVID-19 patients in intensive care, although it does seem to be plateauing.

In Los Angeles in recent weeks COVID-19 patients occupied about 30% of total ICU beds, compared to less than 15% in the Bay Area. The San Joaquin Valley and Sacramento regions also seem to be faring well, with about 10% of ICU beds filled due to the coronavirus. Regional estimates of ICU occupancy rates (as of 2018) suggest hospitals can manage current levels of COVID-19 patients while meeting other intensive care needs.

figure - California Hospitals Have Been Able To Meet COVID-19 Intensive Care Needs

Governor Newsom listed clear criteria for reopening the state’s economy in the midst of the global pandemic. All of California will meet certain benchmarks, such as data tracking and scientific advances in testing and treatment, on a single timeline. Others, such as plans for conducting business while social distancing and protecting vulnerable residents, will likely differ by region.

The state acknowledges that communities may reopen at different times based on circumstances. Recent experiences suggest that responsive local policies could help the state reopen while suppressing COVID-19 hospitalizations and deaths.

Water Availability for San Joaquin Valley Farms: A Balancing Act

In the midst of the COVID-19 crisis, work continues on managing groundwater for long-term sustainability, as required by California’s landmark Sustainable Groundwater Management Act (SGMA). In January, water users in 21 critically overdrafted basins delivered their groundwater sustainability plans to the state Department of Water Resources. In this series, we examine the 36 plans submitted for 11 critically overdrafted basins in the San Joaquin Valley—California’s largest farming region, where excess pumping is a major challenge.

Why does surface water access matter for groundwater sustainability?

Although the San Joaquin Valley has the largest groundwater deficit in the state, water resources vary considerably within the region. A few areas receive abundant surface water. Most others supplement with groundwater. Still others depend entirely on groundwater. In many areas, groundwater is being used at unsustainable rates and pumping will need to be cut to bring basins into balance.

Irrigated agriculture is a major industry in the valley, and the largest water user. Our in-depth study of water solutions for the region found that ending overdraft will entail fallowing at least 500,000 acres of farmland. Access to surface water will be a key factor in determining which croplands stay in production, and which lands are retired.

How does surface water availability vary across valley farmland?

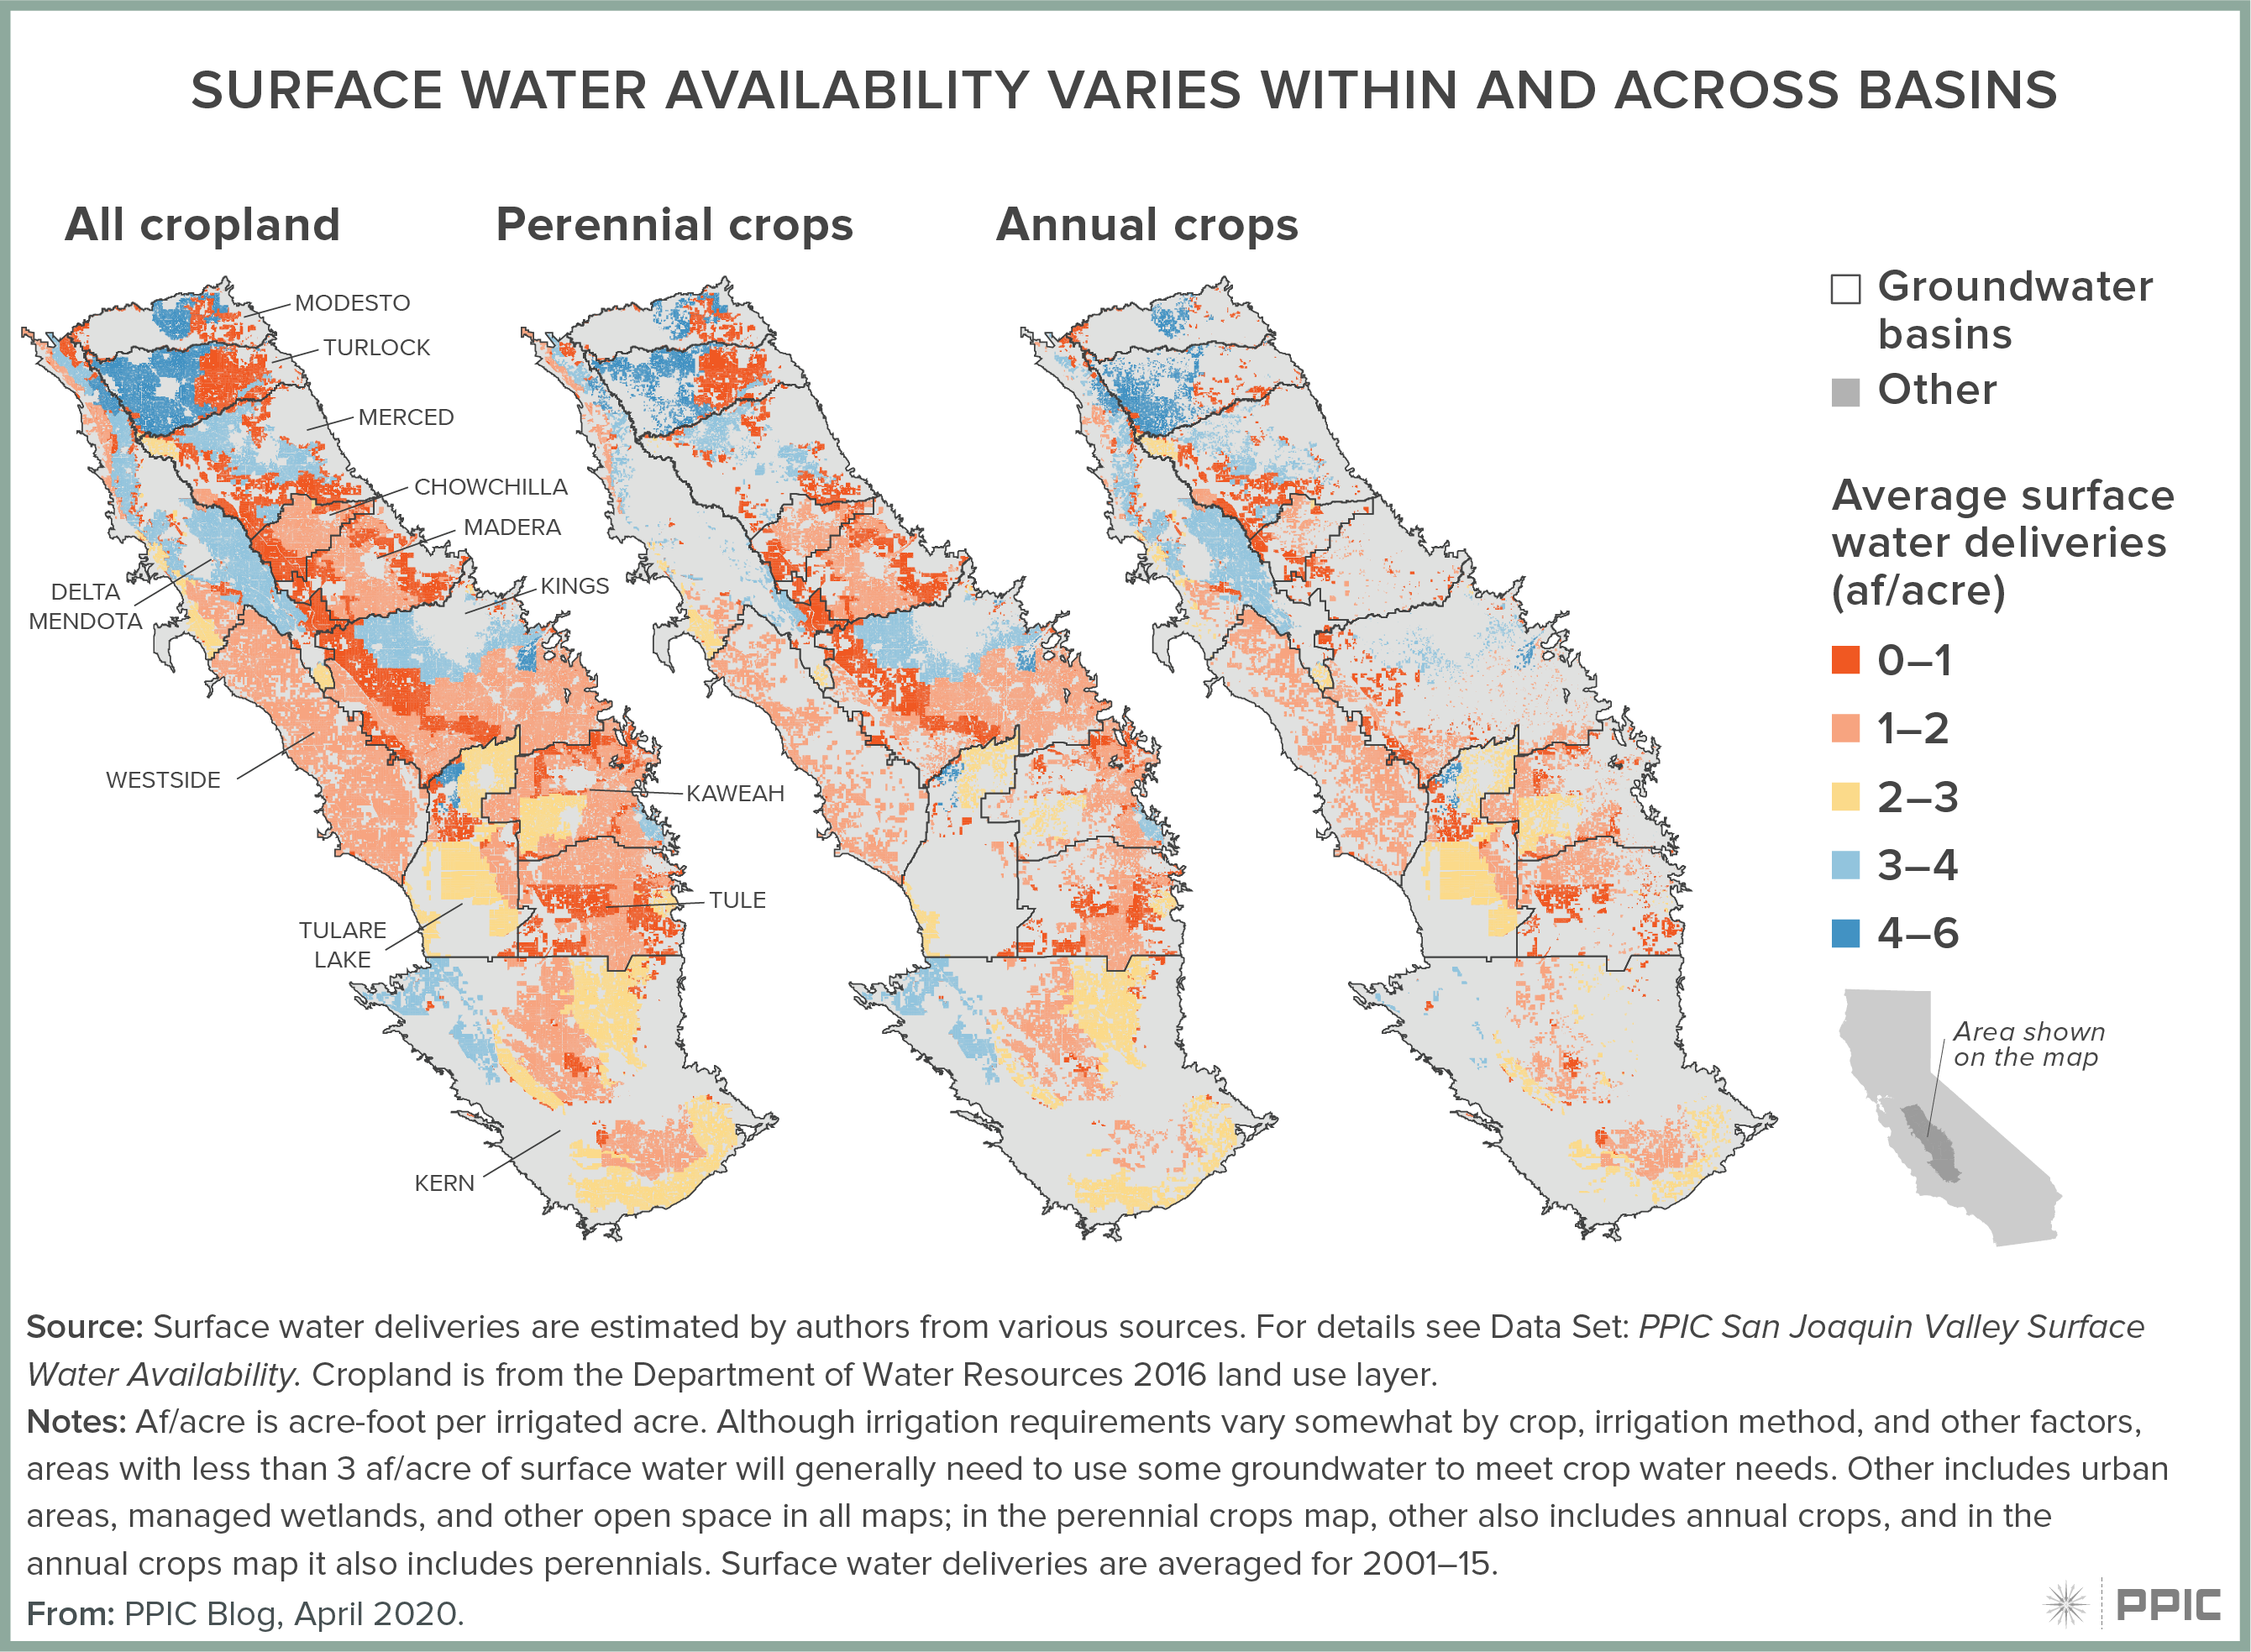
Last year we identified the location of groundwater-only croplands. Our newly compiled dataset allows a much richer view of surface water availability across the region. The maps below show surface water per acre of irrigated agriculture, using average water deliveries from 2001‒15 and cropland mapping from 2016. Surface water averages 1.8 acre-feet per acre valleywide, but availability varies widely both within and across basins. As a rough guide, lands with less than 3 acre-feet per acre of surface water generally need to supplement with groundwater. The less surface water there is, the more groundwater is needed.

figure - Surface Water Availability Varies Within and Across Basins

How does the growth in perennial crops affect approaches to sustainability?

Since the early 1980s, the valley has seen a sustained shift from annual crops to perennial fruit and (especially) nut orchards. Perennial crops now occupy nearly 60% of irrigated lands. More than 20% of perennial acreage is on groundwater-only lands.

The expansion of orchards has benefitted the regional economy, enabling valley agriculture to generate more GDP and jobs than would have occurred if farmers had not made this shift. But perennials are less flexible, because they need to be watered every year to maintain the investment. With groundwater cuts looming, areas with little or no surface water are on the front line of the effort to bring basins into balance. Inflexible approaches to managing this transition could result in unnecessarily large, undesirable reductions in high-value crop acreage, regional employment, and GDP.

What solutions are different areas pursuing?

Bringing basins into balance will require expanding water supplies or reducing water demands. The new groundwater sustainability plans generally emphasize new supplies—with groundwater recharge projects and a variety of efforts to expand or extend surface water deliveries. Fewer plans focus on demand, and those that do give few details on their approach. By our estimates, the plans are too optimistic about the availability of new supplies, and more demand management efforts will be needed.

Basins with less surface water for irrigation are more likely to include demand management as part of their portfolio. For instance, water-short Madera County outlines a range of efforts to augment recharge and to purchase surface water from more water-rich areas. But it also anticipates the need to gradually reduce groundwater pumping by nearly 120,000 acre-feet in the Madera and Chowchilla basins.

Only a few areas—mainly some districts in Kern—propose incentives for flexible demand management to reduce groundwater use. This includes pumping fees, voluntary land-purchase programs, and groundwater trading that enables farmers to reduce use on the least productive lands and keep the most valuable lands in production.

Incentives that encourage farmers to trade groundwater locally—and to trade surface water both within and across basins—can make a big difference to the valley economy. We estimate that trading can reduce the regional costs of ending overdraft by two-thirds.

What’s next?

The valley’s variable water conditions call for managing groundwater sustainability at a regional scale. This scale is appropriate for considering many recharge investments, such as expanding regional conveyance to help get unclaimed floodwaters to suitable recharge areas. It is also necessary to help assess the land use implications of valley-wide surface water trading, which has the potential to keep the most valuable croplands in production while putting fallowed lands into new productive uses. Scaling up this work will require collaboration across a broad sector of valley stakeholders—together with their state and federal partners—in much wider and more comprehensive ways than ever before.

Note: The underlying data and additional notes on surface water availability in the valley can be found in Data Set: PPIC San Joaquin Valley Surface Water Availability. The data on supply and demand options identified in the groundwater sustainability plans is located in Data Set: PPIC San Joaquin Valley GSP Supply and Demand Projects.

Allocating Floodwaters to Replenish Groundwater Basins

In the midst of the COVID-19 crisis, work on managing groundwater for long-term sustainability continues, as required by California’s landmark Sustainable Groundwater Management Act (SGMA). In January, water users in 21 critically overdrafted basins delivered their groundwater sustainability plans to the state Department of Water Resources. In this series, we examine the 36 plans submitted for 11 critically overdrafted basins in the San Joaquin Valley—California’s largest farming region, where excess pumping is a major challenge.

How can floodwaters reduce groundwater overdraft?

Water users have two options for bringing overdrafted groundwater basins into balance: reduce pumping or increase groundwater supplies. In many places, recharging basins with floodwaters from winter and spring storms is one of the most promising supply-side approaches. With SGMA, interest in capturing this water is at an all-time high. In the San Joaquin Valley, 28 of the 36 groundwater sustainability plans propose recharge projects. Total demand for floodwaters is so high that it outstrips what is likely to be available. Competition could be fierce.

Allocating this water is the state’s responsibility, and developing an effective allocation system is a top priority for successful SGMA implementation. Ideally, this system should allocate floodwaters to generate the most benefits and encourage cooperation among parties to realize these benefits in the most cost-effective ways.

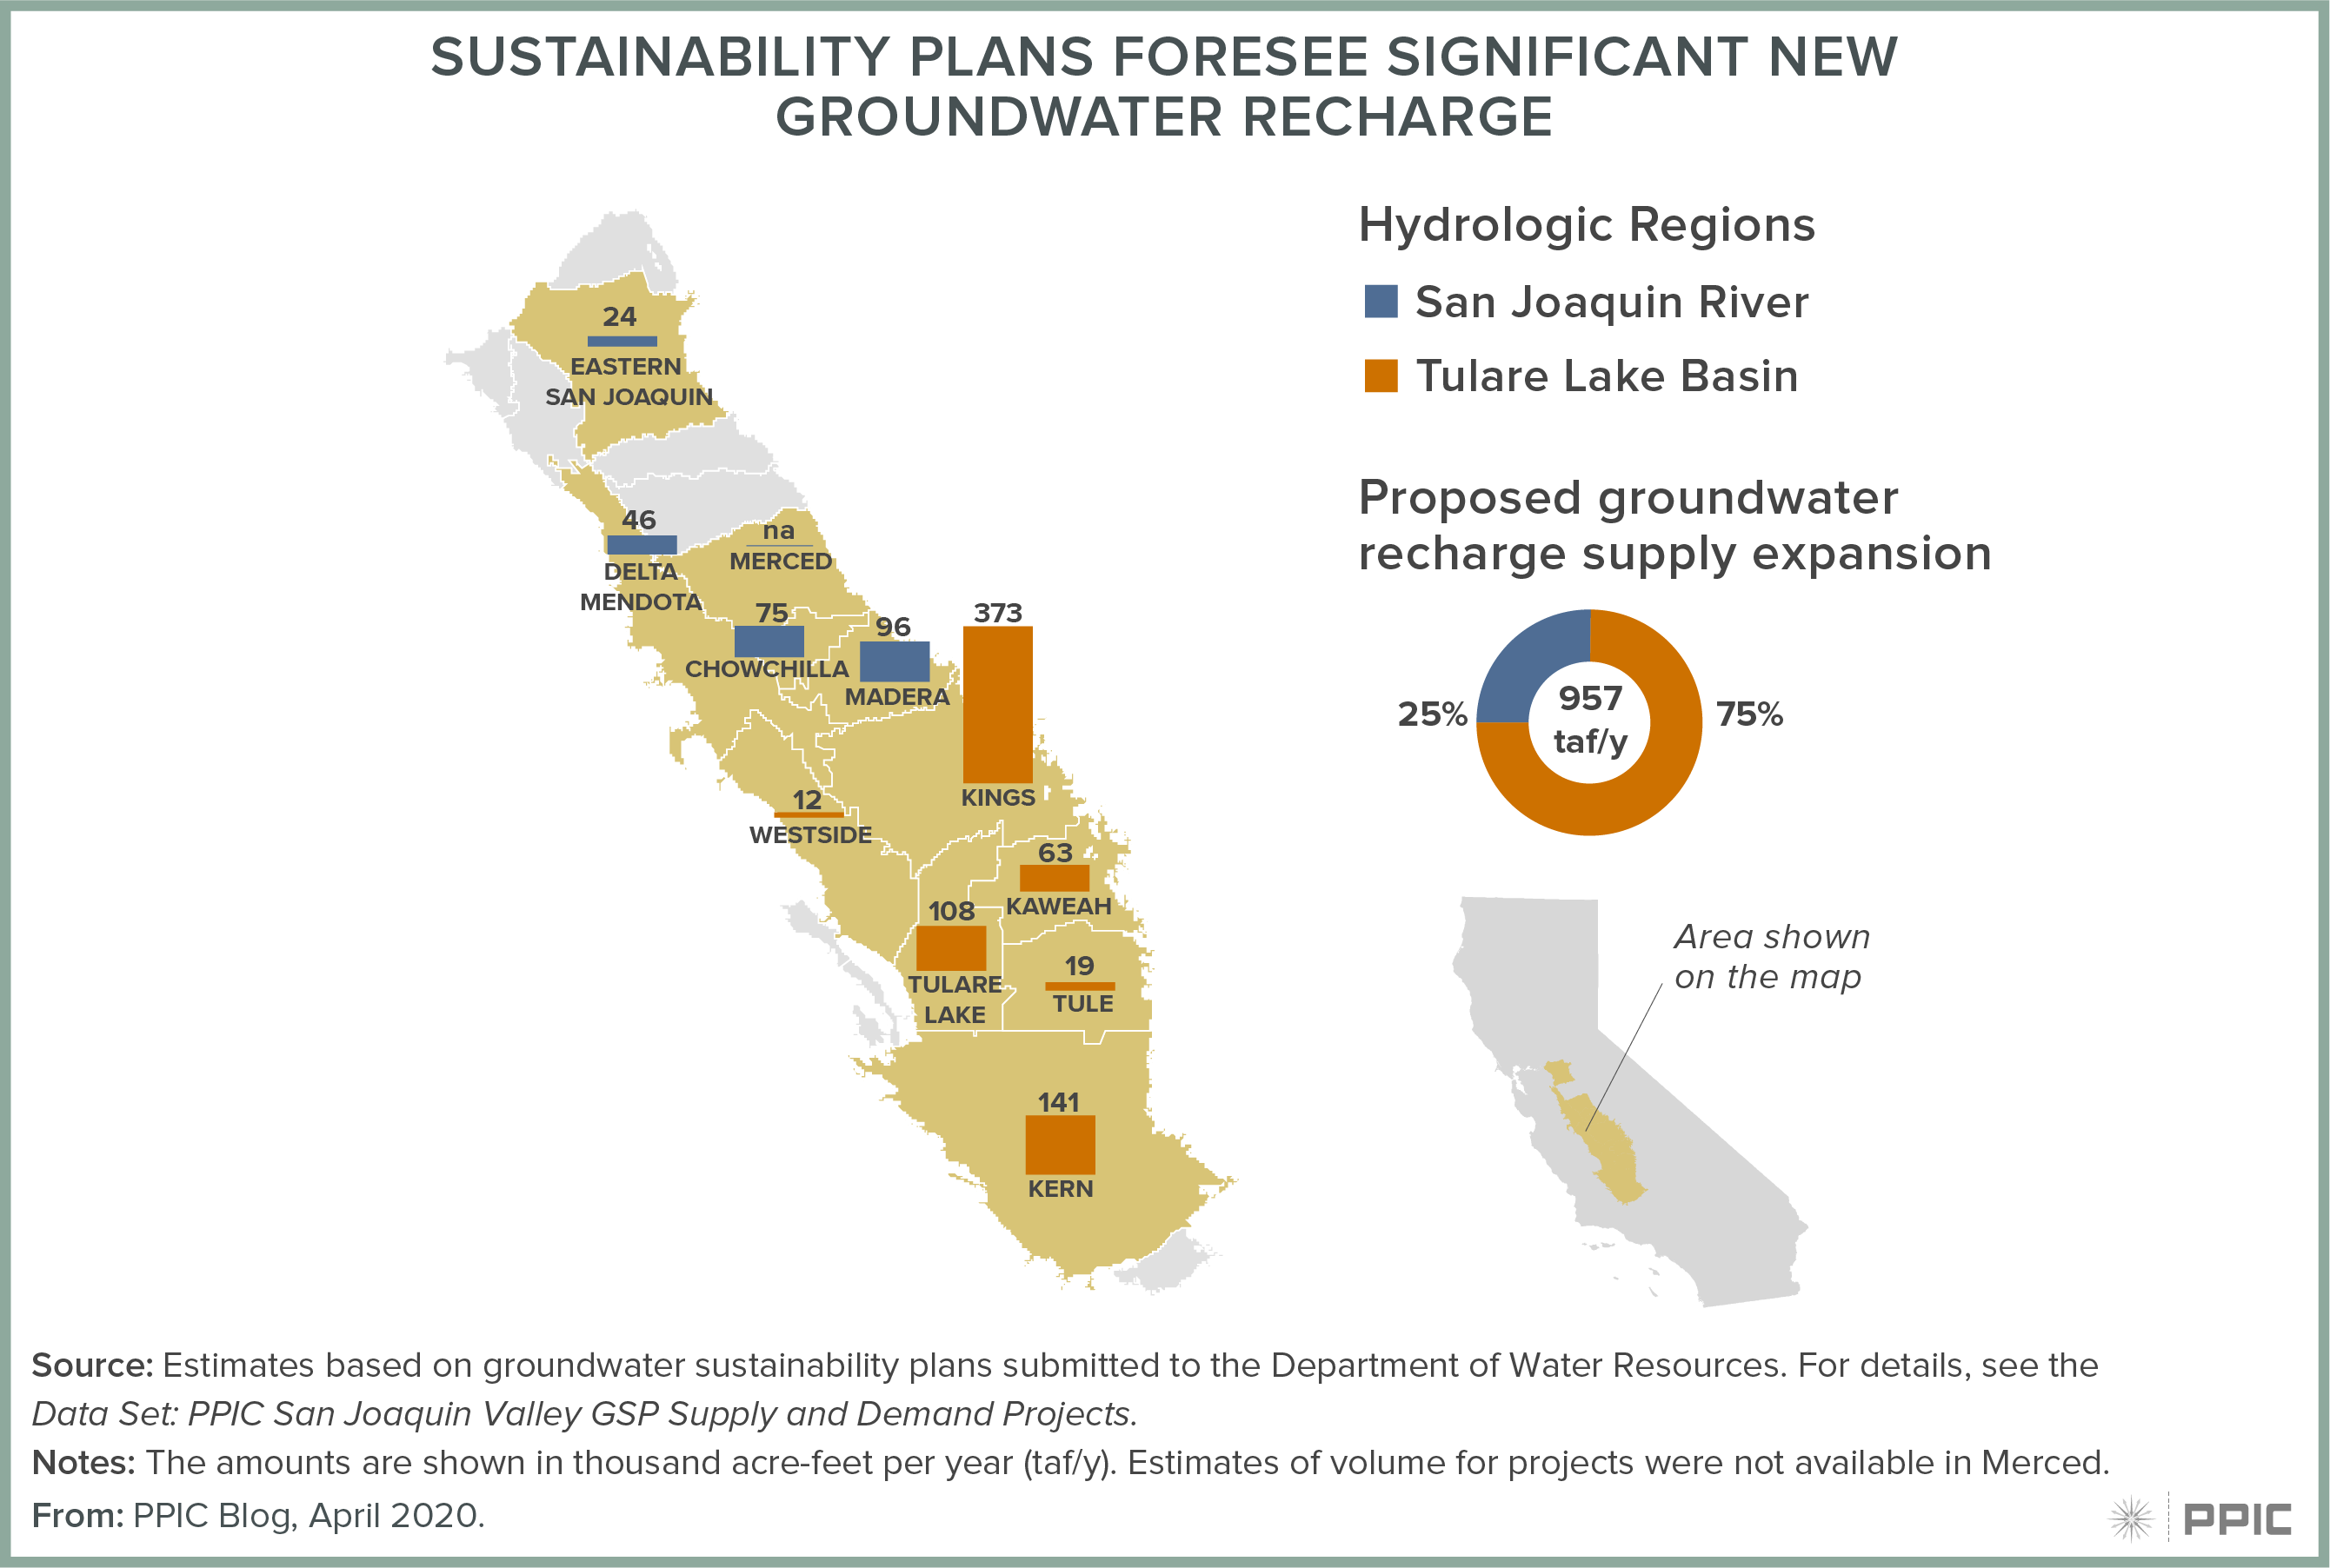
figure - Sustainability Plans Foresee Significant New Groundwater Recharge

What is the state’s current approach for allocating floodwaters?

Previously, some water users have tapped unclaimed floodwaters for recharge, but there hasn’t been a formal permitting process until very recently. In 2019, the legislature enacted AB 658, authorizing the State Water Board to grant temporary permits to groundwater sustainability agencies and other public agencies to divert certain floodwaters. Based on this authority, the board also recently announced a permit system to establish permanent rights to divert and store floodwaters. This recharge water can be used to address various “undesirable results” of groundwater extraction as defined in SGMA, and diversions are limited to prevent harm to other legal users and aquatic species.

As with California’s system for permitting water rights, permanent rights to divert floodwaters will generally be allocated by seniority; those who first establish valid claims will have priority. Temporary permits will likely follow a similar priority system when water is available after satisfying the permanent rights.

Although these changes should make it easier to implement recharge projects, there are important shortcomings. Allocating water by the date of claim does not ensure it will be used to deliver the greatest benefits. It also encourages parties to fight to get to the head of the line, rather than to cooperate and plan to make the best use of this scarce resource.

Could an auction system improve the process?

In a recent article with colleagues from UC Berkeley and the Department of Water Resources, we proposed an auction approach as an alternative way for the state to allocate floodwaters for recharge. As in the current system, the state would set limits on how much water could be diverted within a watershed. But rather than simply apply for the right to divert and store high flow waters, parties would bid for this right.

Although parties would still be competing for the right to divert, this bidding process also encourages cooperation. To improve their chances of being selected, beneficiaries will have incentives to develop joint bids. Cooperative projects within and across groundwater basins will often have the best potential to mobilize funds for the investments needed to capture and use these waters.

By teaming up, parties can also develop projects that use the best locations for recharge—thereby lowering costs of this new supply. Bidding could also encourage cooperation with other beneficiaries—such as flood control districts that could benefit from reduced levee erosion or environmental groups who seek to increase wetland habitat on recharge lands.

Funding is another key difference between auctions and the current system. Right now, permittees pay a fee to cover administrative costs, but they do not pay for the water itself. In an auction system, the winning bidders would pay for the water. These funds could be used to support regional water management goals.

In short, the bidding process would spur creative, collaborative approaches to make the best use of recharge waters—with projects that bring the most benefits for the least cost. This would be a marked improvement over the currently planned “first-in-time, first-in-right” selection process, which does not explicitly consider the relative merits of competing proposals.

What’s next?

An auction approach can help coordinate stakeholders and improve the allocation of unclaimed floodwaters for recharge projects. Although legislation may be required to authorize it, existing California water law does not present an obvious impediment to adopting an auction system. Given its potential advantages over the current system, the state may wish to trial a round of auctions in river systems where recharge resources are likely to be scarce.

Note: The data on supply and demand options identified in the groundwater sustainability plans is located in Data Set: PPIC San Joaquin Valley GSP Supply and Demand Projects.

Will Mail-in Ballots Benefit One Party?

If coronavirus is still active during this November’s presidential election, the risk remains of spreading the virus among voters and poll workers. The best solution is to limit in-person options and rapidly expand the number of voters who submit ballots through the mail.

This is the right choice for public health. But a debate around the degree of change needed is reasonable: how many mail-in ballots and how many polling places are needed to both keep people safe and allow fair access? And lurking in the background are darker questions: does one party stand to benefit as vote by mail expands? Is this a partisan game masquerading as a question of public health?

The short answer to both questions is no. On the surface, there might seem to be a partisan angle. Many Democrats have pushed for expanding vote by mail, while President Trump has firmly stated it would hurt Republican candidates. States friendly to voting by mail tend to vote more Democratic, while some Republican-leaning states like Texas have resisted more voting by mail even in the pandemic. And Californians who vote by mail are older and more likely to be white, demographics that also vote more Republican on average.

But these scenarios describe the status quo; they don’t tell us how election results might change if vote by mail became more widely available. When election jurisdictions—including some California counties—have rapidly expanded vote by mail, neither major party has clearly benefited. Likewise, early evidence from experiments with heavy vote by mail in California suggests an increase in turnout among Latinos, Asian Americans, and young people of up to seven percent, though often with a fair amount of statistical uncertainty.

The same analysis suggests overall turnout increased about two to three percent, making it difficult to say that the composition of the electorate changed much in the end. Thus, while the greater convenience of vote by mail does seem to draw in a few more voters, these voters aren’t that different on average from the ones who show up already.

The demographic differences between in-person and by-mail voters are real, but should not be overstated. People from all backgrounds and political persuasions vote in person. All of them will be at risk in an election where coronavirus is still active. Expanding vote by mail is now a pure question of public health and administrative capacity. Neither party should worry that it will put them at a disadvantage.

The Coronavirus Pandemic Will Test the State’s Budget Reserves

As it grapples with the COVID-19 pandemic, California faces an uncertain fiscal future. This global crisis has caused a sharp decline in economic activity, exposing crucial sectors to heightened risk. As discussions continue about when and how to re-open the economy, it is clear that the state will have to respond to significant fiscal challenges.

The good news is that California has made important changes to its reserve policies since the Great Recession. The passage of Proposition 2 (2014) created the Budget Stabilization Account—the state’s rainy day fund—as well as the Public School System Stabilization Account, a separate reserve for K–12 districts and community colleges. In addition, Governor Brown and the legislature created the Safety Net Reserve Fund to shore up Medi-Cal and CalWORKs funding during downturns.

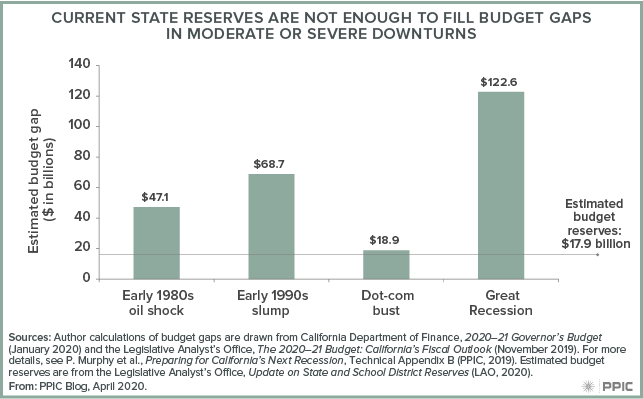
The bad news is that a severe recession is likely to pose significant budgetary challenges. Drawing from the state’s experience during several recent recessions, PPIC estimated the budget ramifications of mild, moderate, and severe recessions and the capacity of state reserves to fill gaps. We found that the state’s reserve balance—estimated to be $17.9 billion—is large enough to withstand a mild recession such as the dot-com bust in the early 2000s.

However, a long and/or severe recession like the early 1980s oil shock (which lasted four years), or the early 1990s slump and the Great Recession—both of which were much more severe and lasted five years—would create large budget gaps and require policymakers to make difficult decisions. (It is important to note that the estimated reserve balance relies on the 2019–20 enacted budget and that it will change when revenue estimates are updated in May.)

figure - Current State Reserves Are Not Enough To Fill Budget Gaps in Moderate or Severe Downturns

In the meantime, the federal government has stepped in. The Families First Coronavirus Response Act includes an increase in the federal share of Medicaid payments and reimbursements to states that are expanding public assistance programs. The Coronavirus Aid, Relief, and Economic Security (CARES) Act provides about $2.2 trillion; some aid goes directly to families, some goes to schools, and some to state and local governments. Additionally, two federal disaster declarations make many of California’s COVID-19 expenditures eligible for at least partial reimbursement.

Governor Newsom has requested additional federal assistance, including flexible aid to state and local governments, a further extension of unemployment insurance benefits, and expanded support for safety net programs, small businesses, K–12 and higher education systems, childcare, and broadband.

The state is also making significant changes to the 2020 budget process. The Department of Finance is drafting a “workload” budget for the May Revision that will set the baseline for the final budget to be enacted in June. This will limit spending increases while allowing for growth in programs—particularly safety net programs—that expect increased demand. The legislature will revisit the budget for an “August Revision” that reflects changes in the state’s financial condition. As these processes move forward, PPIC will continue to monitor California’s evolving fiscal challenges and steps being taken to address them.

Race, Health, and the Risk of COVID-19 Complications

For adults younger than 65, many underlying health conditions are emerging as risk factors that can lead to severe complications of COVID-19. Within this larger population, certain minority groups are under particular threat due to disproportionate rates of such conditions. While California’s overall share of nonelderly adults at risk is relatively low, disparities in health endanger some more than others during this health crisis.

Governor Newsom cited protecting individuals most at risk of COVID-19 complications as a necessary criterion for restarting California’s economy. Though we cannot yet draw conclusions from incomplete data—about one-third of cases and over a tenth of deaths do not have complete data on race and ethnicity—certain risk factors are more prevalent along racial and ethnic lines.

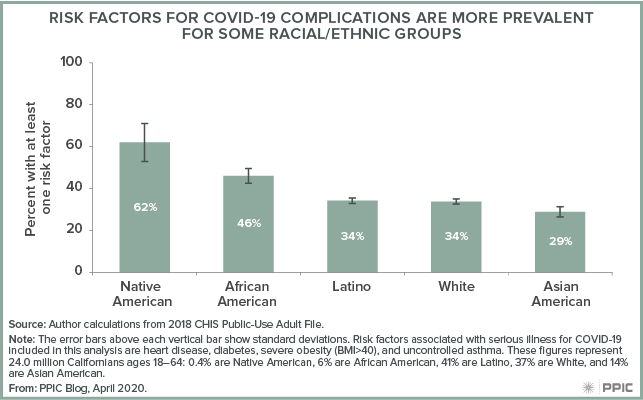
According to the Center for Disease Control, potential risk factors include heart disease, diabetes, severe obesity (BMI greater than 40), and uncontrolled asthma; smoking is also likely to increase risk. In California, over 60% of Native Americans and about 46% of African Americans have at least one of those health concerns. By comparison, roughly one-third of whites, Latinos, and Asian Americans have one or more of these health issues.

Native Americans are diagnosed with heart disease at rates almost four times that of whites (19% to 5%), have higher rates of smoking (51% to 14%), and double the uncontrolled asthma (12% to 6%). African Americans have much higher rates of diabetes (24% to 14%) and severe obesity (12% to 4%) than whites. Asian Americans and Latinos also have higher rates of diabetes (about 19%) compared to whites (14%).

figure - Risk Factors for COVID-19 Complications Are More Prevalent for Some Racial/Ethnic Groups

Due to higher poverty and uninsured rates, minority groups also face more difficulty accessing health care. At the same time, individuals in these populations may frequently hold jobs with a higher risk of exposure to coronavirus.

The California Department of Public Health has begun to publish data on cases and deaths by race/ethnicity. Some counties, such as San Francisco, are doing the same at the local level. While limited testing capacity and incomplete data prevent a true understanding of who is most impacted by the coronavirus, better knowledge of existing health disparities can help California protect and heal its most at-risk members as the state plans its next steps in responding to the public health crisis.

California’s Most Isolated Seniors

Seniors are especially vulnerable during the COVID-19 pandemic. First and foremost, of course, are health concerns. The latest data from the Centers for Disease Control and Prevention show that seniors are twenty times more likely to die of COVID-19 than are people younger than 65 (21 deaths per 100,000 compared to 1 death per 100,000 as of April 15). But seniors also face other significant challenges during this time of shelter-in-place, including social isolation. California’s efforts to support seniors through the pandemic can help counter these challenges.

Studies suggest that social isolation can lead to increased risk of mental and physical health conditions, including depression, cognitive decline, and elevated blood pressure.  Most immediately, isolated seniors might have an especially difficult time taking care of daily living tasks as they shelter at home.

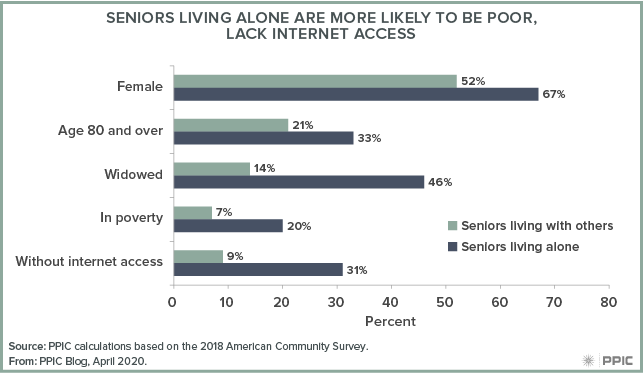
In California, 1.3 million seniors live alone (23% of 5.5 million seniors). They are disproportionately older, female, and widowed. Many have self-care limitations and a relatively large share live in poverty. Regionally, most live in the state’s large metropolitan areas, but many small rural areas of the state have very high shares of seniors living alone.

figure - Seniors Living Alone Are More Likely To Be Poor, Lack Internet Access

Of particular concern are those who do not have internet access. Among seniors who live alone, that’s 400,000 people. Another 40,000 have internet access but no smartphone, laptop, or tablet. They are perhaps the most socially isolated and vulnerable population in the state.

For these seniors, keeping up to date on the pandemic, ordering groceries and medicine from home, and connecting with others are all much more difficult. With libraries physically closed, a common access point to online services for many seniors is now unavailable, compounding the difficulty of overcoming social isolation.

Governor Newsom’s “Stay Home. Save Lives. Check In” campaign “urges all Californians to check in on vulnerable neighbors with a call, text or physically-distanced door knock” and is working with groups like AARP to reach out to older Californians. With many Californians now working from home, the time and opportunity to safely engage with older neighbors have never been greater—or the need more acute.

High School Graduation during the COVID-19 Crisis

With schools closed for in-person instruction in California through the end of the school year, the state has asked districts to implement distance learning. As a result, many students—particularly high school juniors and seniors—are concerned about falling behind or failing to graduate.

Nearly half of students from low-income families do not have broadband access at home. Given this reality, along with the uneven distribution of learning opportunities within and outside of schools across the state, it will be important to address the equity implications of the shift to distance learning during the coronavirus pandemic.

In response to school closures, the California Department of Education is allowing districts to request waivers that exempt individual students from the state’s minimum graduation requirements, which include three years of English, two years of math and two years of science.

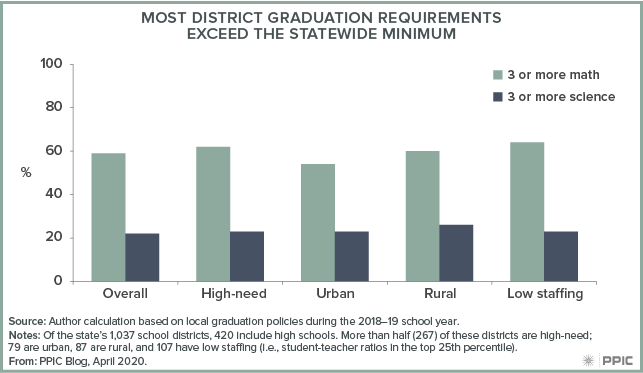
In addition, many districts have graduation requirements that exceed the state minimum. In the 2018–19 school year, 59% of districts required a third year of math, and 22% required a third year of science.

These requirements are prevalent across all types of districts—including high-need districts, in which more than 55% of students are low-income, English Learners, homeless, or foster youth; rural districts; and districts with high student-teacher ratios.

figure - Most District Graduation Requirements Exceed the Statewide Minimum

Moreover, students in six large districts—including Los Angeles Unified, San Diego Unified, San Jose Unified, and San Francisco Unified—must complete the entire A–G sequence required for admission to University of California (UC) or California State University (CSU) schools in order to graduate.

Districts with graduation requirements that exceed the state minimum will need to work with school boards to modify local policies. UC and CSU have already responded to school closures by temporarily suspending letter grade requirements for A–G courses completed in winter, spring, and summer 2020.

However, it will be challenging to help students stay on the A–G pathway. The waiver and temporary suspension of GPA requirements do not necessarily make it easier for students to take more A-G courses. PPIC research has shown that most students exit this pathway in the last two years of high school, and groups that are historically underrepresented in higher education are more likely to drop off at every stage. As districts develop distance learning plans and ways to provide flexibility to high school students, considerations of equity and access should be front and center.