New Reforms at California Community Colleges

California community colleges are reforming to the way they assess their students’ college readiness and place them in remedial courses. A recently passed measure—Assembly Bill (AB) 1805—may increase both the uniformity and transparency of placement policies. PPIC research indicates that AB 1805 has the potential to improve student outcomes and narrow achievement gaps.

Our research finds that clearer and more uniform policies can make assessment results more portable for students. A previous measure, AB 705, established a set of measures a college must use to determine college readiness (e.g., coursework, grades, and/or grade point average). However, colleges continue to have autonomy to set their own rules, as opposed to using the Chancellor’s Office default placement rules. Our latest study finds that varying policies across colleges is a cause for concern. For example, two colleges within the same district might both use high school GPA to place students, but their GPA cutoffs might differ; this could pose problems for students who are assessed at one institution but want to take a transfer-level course at the other college.

AB 1805—which will be implemented systemwide in fall 2019—may help address this concern by mandating that colleges publicize their placement policies. As a result, students will be better informed and may also be more motivated to challenge placement decisions or enroll at colleges with broader access to transfer-level courses.

Variation in placement policies may also contribute to inequitable access to transfer-level courses. Our research indicates that underrepresented students may have more difficulty gaining access to transfer-level courses if they attend colleges with stricter placement rules. AB 1805 requires colleges to report the number of students placed into transfer-level coursework (with or without concurrent support) to the Chancellor’s Office and the public each year, providing racial/ethnic breakdowns. This should make it easier to see whether colleges are implementing placement policies that are fostering inequitable student outcomes.

Over the summer, PPIC engaged in an exhaustive scan of college websites and catalogs to get a sense of how placement policies are being communicated to students. We found that most community colleges do not provide clear and complete information—in fact, only 19 colleges provide placement details (e.g., GPA cutoffs). As we move forward, it will be critical to monitor the implementation of AB 705 and AB 1805 at the college level—including the placement measures being used and levels of access to transfer-level courses. By examining the policies and practices at colleges where underrepresented students experience uneven access to transfer-level courses, progress can be made toward improving outcomes and narrowing achievement gaps.

Election Day Matters

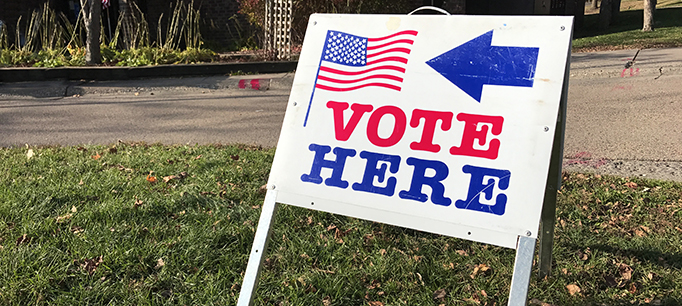
It’s Election Day, and voters across the nation are choosing their leaders at a divided and contentious time. Although Californians are divided on many issues today, majorities of voters across party lines say they are more enthusiastic about voting than usual this year (October PPIC survey: 72% Democrats, 64% Republicans, 53% independents). This is welcome news after a 2014 statewide election that set a new record for the lowest voter turnout. It will be interesting to see how many Californians will actually follow through and cast their ballots for governor, state constitutional officers, and state legislators.

Who will vote in the California election will be closely watched on election night since a handful of House races may well determine the party in control of the next US Congress. Democrats seem more energized than Republicans in voting for Congress this year (October PPIC survey: extremely/very enthusiastic: 57% Democrats, 40% Republicans, 35% independents). However, we also find an “enthusiasm gap” that favors white, older, and more affluent Californians who tend to be conservative voters. This raises questions about whether there will be a “blue wave” or merely a ripple this year.

In addition to electing their leaders, California voters play an outsize role in policymaking in our state. In another striking area of agreement across party lines, most Californians say that they like the initiative process and feel they make good decisions at the ballot box—despite reservations about the number and complexity of ballot measures. Because of the central role the initiative process plays in California policymaking, voters have a special obligation to weigh in on important choices facing the state. This election, Californians will vote on 11 state propositions, in addition to numerous local measures.

Still, many Californians who are eligible do not vote. We’ve found significant gaps between voters and non-voters in the state. Voters are much more likely to be older, white, and own their homes. They have higher education and income levels. And they are more likely to identify as one of the “haves” than the “have nots.” This means that important policy choices that affect the entire population are determined by voters who do not necessarily reflect the state’s social, political, or economic diversity.

The state has implemented several reforms to ease access to registration and voting, many of them quite recently. The jury is still out on the long-term effects of these efforts, but one thing is sure: voting matters. Elections have the power to change the direction of history.

So on this Election Day, it is critical for all eligible Californians to exercise their right to vote. For anyone in need of last-minute help on ballot choices, solid nonpartisan information is available in the state’s voter guide.

PPIC is keeping a close eye not only on the immediate outcome of the vote, but also on long-term trends and implications. Stay tuned to the PPIC blog for post-election thoughts and analysis of this year’s important midterms.

A Water Budget for the Environment

California’s freshwater ecosystems—and many native species that rely on them—are in decline and becoming increasingly vulnerable to drought. Allocating water to these ecosystems is contentious because it often conflicts with urban and agricultural uses. There may be a way to meet environmental needs that reduces conflict.

My recent presentation before the Delta Science Program outlined an alternative approach to managing water for the environment that is detailed in a 2017 PPIC report. 

Currently, state and federal regulators rely heavily on minimum flow and water quality standards to protect the environment. These flows are often set to meet the needs of one or more endangered species. This approach has failed to reverse the decline in native species and their ecosystems for many reasons—simply bumping up minimum flows is unlikely to improve conditions.

Instead, our report recommends establishing ecosystem water budgets. These budgets would specify a volume of water to be made available to support a range of ecosystem functions to which native species are adapted. The amounts would vary in accordance with the type of water year (e.g., wet, average, dry) but each amount would be fixed for a number of years. The volume to start with would be the water currently allocated to meet minimum flow and water quality standards. Mechanisms would be needed to increase this volume where necessary through purchases or leases.

To be effective, the budget should be flexibly managed, much like a water right—preferably by an ecosystem trustee vested with the authority to trade and store water. These budgets would focus on improving overall ecosystem conditions rather than protecting individual species.

Ecosystem water budgets are a better approach for three reasons. First, the flexible allocation of water allows environmental managers to use water more efficiently by responding to changing conditions (such as droughts, storms, and heatwaves) and delivering water to habitat in areas that are likely to have the highest ecological benefit.

Second, having a budget that can be flexibly managed makes the environment a partner in water management, not just a constraint. The ecosystem trustee would sit at the table with water managers and participate in the trading, storage, and planning that goes on in a watershed.

Finally, a budget with a set term makes the amount of water that will be allocated to the environment clear to all water users. This addresses one of the most common complaints about environmental water management: urban and agricultural users face uncertainty over regulatory actions that transfer water from economic to environmental uses.

Ecosystem water budgets would be an advance over traditional minimum flow and water quality standards, but they are unlikely to succeed without major improvements in both ecosystem planning and water accounting. Robust, watershed-scale plans are needed to set budget objectives and priorities for action. We recommend annual watering plans—vetted with local stakeholders—that preview actions to be taken every year, depending on hydrologic conditions. Equally important, California must improve accounting for water use and availability, because it’s not possible to manage what you don’t measure.

The current approach to freshwater ecosystem management is not working for anyone. The three reforms described here—ecosystem water budgets, ecosystem plans, and improved accounting—are likely to produce better outcomes for native species and result in more efficient use of environmental water. They also have the potential to increase certainty about environmental water allocation and reduce controversy. Making the environment a partner in water management is a novel, effective way to address one of the big challenges in California water.

Are K–12 Students Keeping Pace in English?

Last month, we wrote about how newly released 2018 SBAC test score data show that student growth in math has been insufficient to keep pace with grade-level proficiency standards. And though student growth in math proficiency is accelerating, racial disparities are widening as students progress through school.

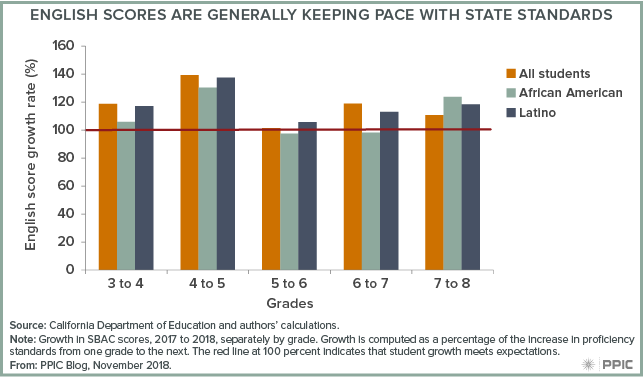
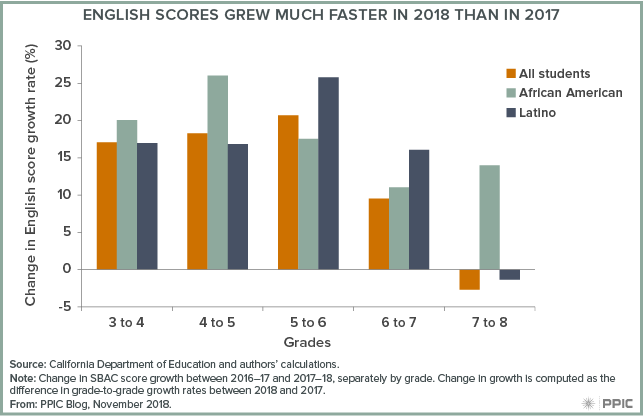
The picture is somewhat more promising for English. Growth in English test scores generally outpaced the state standards—meaning more students were gaining mastery of English than in prior years. Moreover, the growth in 2018 English scores was much higher than in 2017.

The figure below shows the growth in English test scores from grade to grade—how last year’s third graders performed in fourth grade, and so on—relative to the growth in the score required for proficiency in each grade. A growth rate of greater than 100% indicates that average student progress is outpacing what is expected by the standards, while growth of less than 100% suggests progress is not keeping pace with standards.

Across all grades, growth in average student test scores outpaced growth in grade-level proficiency standards. This year’s 5th graders showed particular improvement, with average growth outpacing the standards by 40%. In other words, many more 5th graders are meeting standards in English than they were last year in 4th grade (49.4% vs 45.1% to be exact).

But in most grades, racial disparities in English achievement are still growing with each grade progression: the scores of African American and Latino students grew less than the average student’s scores. However, the pattern is reversed in between grades 7 and 8, where African American and Latino scores grew more than average, reducing these disparities somewhat. In addition, the disparities in English score growth are notably smaller than the disparities in math.

We also see improvements when we compare growth rates between 2017 and 2018. Growth in grades 4 to 7 accelerated considerably in 2018—for example, among Latino sixth graders, English test scores improved a little over 25% more than the scores of their counterparts in 2017—though growth in grade 8 was slightly slower compared to 2017. African American student progress was especially noteworthy, with growth improving more than the average student across four of five grades. While the previous figure shows that achievement gaps still grow slightly as students progress through school, these gaps in growth are small and shrinking.

Looking at the grade-to-grade growth of the same cohorts of students provides a lens to examine whether students are keeping up with grade-level expectations, and whether achievement gaps are shrinking or growing as students advance through school. These findings generate hope that recent reforms are bearing fruit, but there is yet more work to be done. Despite progress in 2018, just under half of our students in grades 3–8 and 11 are proficient at their grade level in English, and less than 40% are in math. Sustaining and improving on this growth will be key to addressing these shortcomings in student achievement.

2020 Census: Counting the Central Coast

The decennial census plays an essential role in American democracy. Our series of blog posts examines what’s at stake for California and the challenges facing the 2020 Census, including communities that are at risk of being undercounted.  

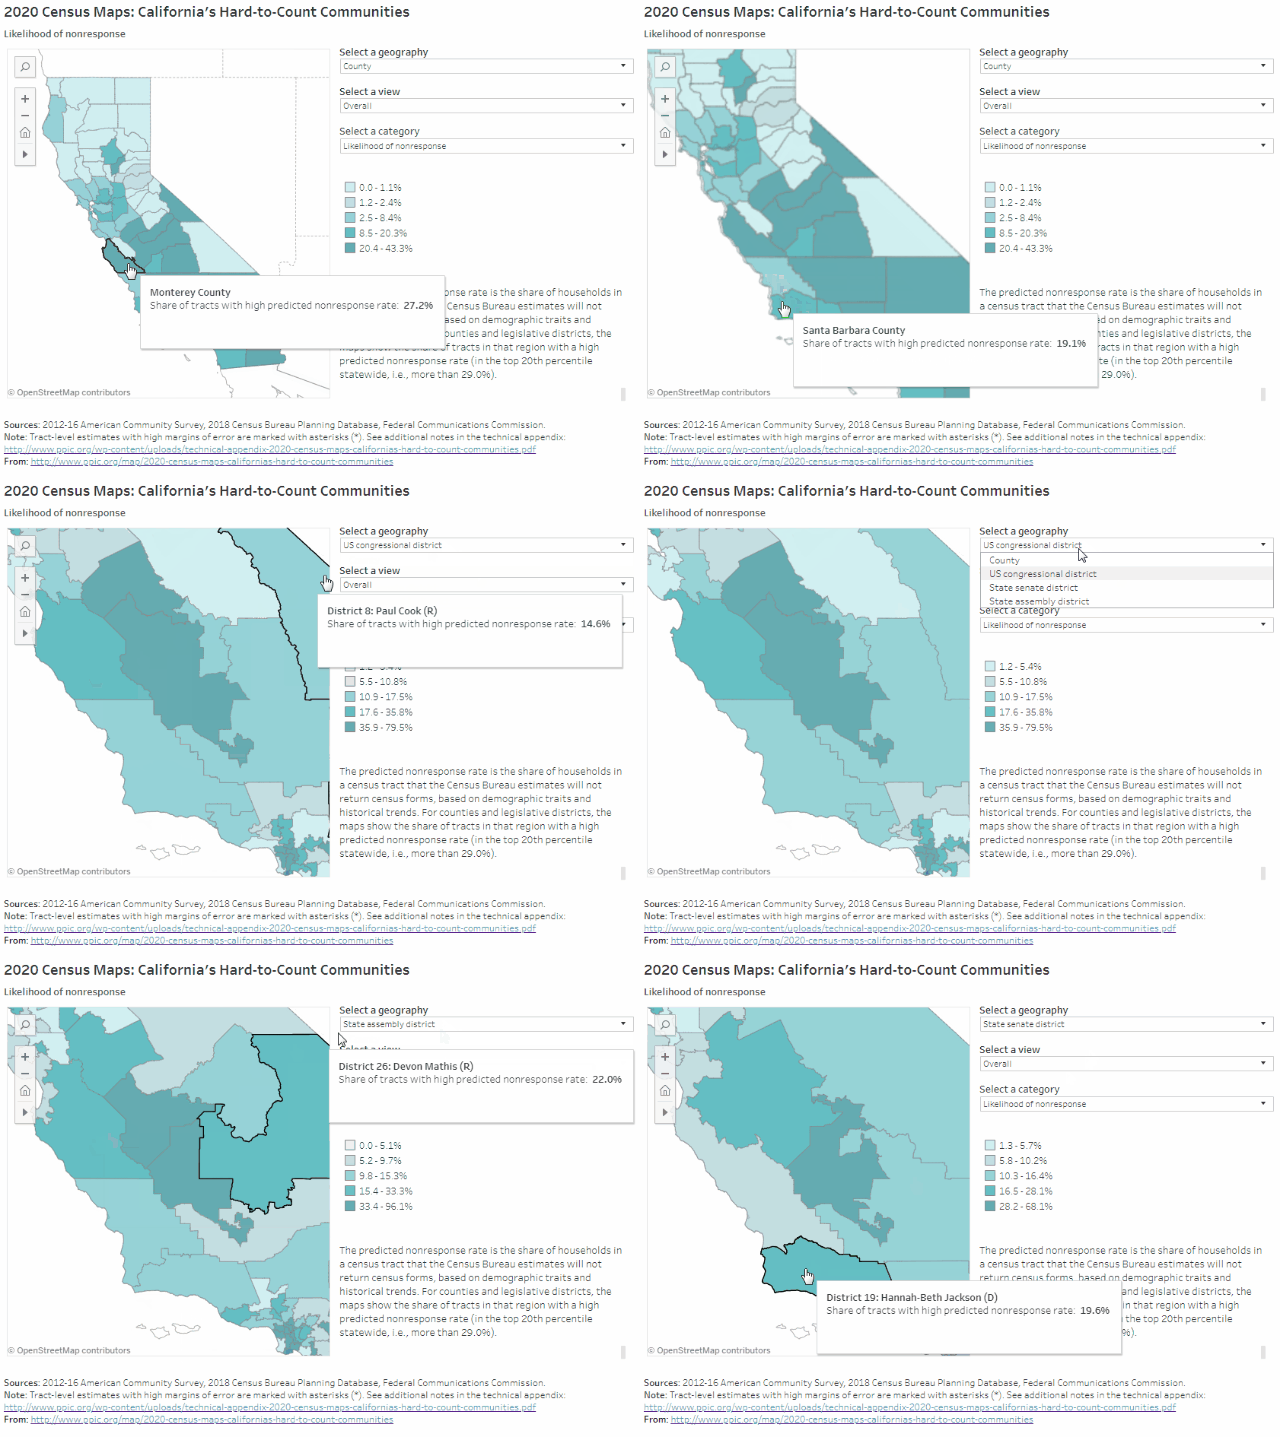
PPIC’s interactive census maps are an important tool for Californians working to ensure an accurate census count. Using estimates from the Census Bureau and the Federal Communications Commission, they highlight hard-to-count communities across the state and pinpoint reasons why certain areas may be hard to reach.

More than 2 million Californians live in the Central Coast counties of Monterey, San Benito, San Luis Obispo, Santa Barbara, and Ventura. Monterey County has by far the region’s highest share of very hard-to-count census tracts (27%), followed by Santa Barbara (19%) and Ventura (12%). Households in these very hard-to-count areas are at risk of being undercounted because they are less likely to respond initially to census forms, according to Census Bureau estimates that draw on historical trends and local demographic characteristics (e.g., race/ethnicity, age, citizenship, and housing conditions).

Census Central Coast

Some highlights:

  • The implications of undercounting very hard-to-reach places differ widely for Central Coast legislators. In two districts representing much of Monterey County—Assembly District 30 (Caballero) and Congressional District 20 (Panetta)—about a fifth or more of census tracts are likely to be very hard to count. The same is true for Senate District 19 (Jackson), covering Santa Barbara and most of Ventura County. Other Central Coast districts have relatively low shares of hard-to-count areas. Given this wide variation, understanding the overlapping factors that can make populations hard to reach will be key to ensuring an accurate count of the Central Coast.
  • There are hard-to-reach areas scattered throughout the region. In Monterey County, areas around Salinas and the Salinas Valley are likely to be the most difficult to count, with 30% or more of households predicted not to respond initially to the census. Other hard-to-reach areas can be found in the city of San Luis Obispo; Santa Maria, Santa Barbara, and Isla Vista in Santa Barbara County; and around Oxnard and Port Hueneme in Ventura County.
  • Monterey and San Benito Counties have relatively high shares of historically undercounted racial/ethnic groups. The census has typically undercounted African Americans, Latinos, and Native Americans. These groups make up about 60% of residents in Monterey and San Benito Counties—but just 24% of San Luis Obispo residents. In Santa Barbara and Ventura Counties, these racial/ethnic groups comprise about 45% of the population, similar to the state overall.
  • Undercounting young children and noncitizens would dramatically misrepresent Monterey County. Young children have been historically undercounted in the census. In addition, noncitizens may be less likely to respond in 2020 due to the planned addition of a citizenship question and fears about privacy and deportation. Almost 22% of Monterey County residents are noncitizens, and about 8% are under five years old—some of the highest concentrations in the state.
  • Outreach to residents in hard-to-count housing will be key to accurately representing the Central Coast. Monterey and Santa Barbara Counties have especially high shares of rental units, overcrowded rentals, and mobile homes. These conditions make it difficult for the Census Bureau to find and count residents. In both counties, nearly 1 in 10 housing units is an overcrowded rental. Northern San Benito County, coastal San Luis Obispo County, Santa Maria, Oxnard, and the Santa Clara River Valley also have hard-to-count housing and will require targeted outreach to fully count residents.
  • Limited internet access may be an issue in rural areas throughout the region. The Census Bureau plans to collect the majority of responses online in 2020—a change from previous practice. Each county along the Central Coast has some census tracts with minimal residential high-speed connectivity, with the lowest access outside cities. In Monterey County, for example, fewer than 400 out of every 1,000 households around Prunedale have high-speed internet connections, compared with 600–800 in neighboring Salinas. While people in these areas may have internet through smartphones or public libraries, in general they may have more trouble responding to the census online.

We hope these maps serve as a starting point to help local, regional, and state leaders think about which activities, resources, and partnerships—including language assistance, awareness raising, and community outreach—might be most effective for accurately counting different parts of California. Stay tuned for future posts that examine hard-to-count communities in other regions of the state.


Groundwater Management is Key to Adapting to Climate Change

California relies heavily on groundwater for its water supply, particularly during drought.  Climate change is increasing drought intensity, making groundwater―with its immense potential for low-cost storage―an ever more important water source. Sustainable groundwater management will be vital to adapting to a warmer future and should be a top policy priority for the next administration.

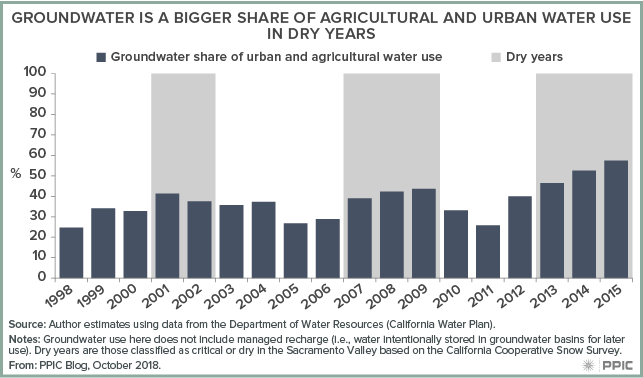
In non-drought years, groundwater supplies approximately one-third of urban and agricultural water use in California, but its share rises during droughts, when snow and surface water are scarce. In severe drought years, it provides more than half of urban and agricultural water use.

A recent report by the PPIC Water Policy Center and a large team of experts highlighted the impacts of climate change on water supply and ecosystem management during drought. As winter precipitation shifts from snow to rain in a warming climate, a key issue will be adapting the management of the state’s water storage system. A more volatile climate and changes in precipitation could shift the use of large multipurpose reservoirs from water storage to protection against flood risk, thus reducing the water available from reservoirs in some years―and making groundwater storage even more important.

In some regions, including the San Joaquin Valley, groundwater overdraft—taking more water out of aquifers than is put back—has been going on for decades. This has increased the cost of groundwater pumping, dried up wells in many rural areas, and caused land to sink, damaging infrastructure.

But the greatest long-term impact of unsustainable groundwater use is the loss of stored water that can be economically pumped during dry periods. This makes the state increasingly vulnerable to drought in a changing climate.

The 2014 Sustainable Groundwater Management Act (SGMA) requires water users and other stakeholders to self-organize into groundwater sustainability agencies (GSAs) and prepare and implement plans to achieve sustainability in the next 20 years. Done well, these efforts will restore the capacity of the state’s groundwater basins to supply water during drought.

GSAs have begun the hard work of developing their sustainability plans—due in January 2020 for critically overdrafted basins and two years later for the rest. The Department of Water Resources is providing technical and planning assistance, and the State Water Board―which has ultimate authority over these plans―is offering policy and legal guidance where it can.

Making SGMA a success will require additional action in the following four areas:

  • Advance planning. At the top of the list is expanding state and regional support for groundwater sustainability plans. Factoring in the predicted effects of climate change and developing robust water accounting and regional strategies for managing scarcity will be key.
  • Modernizing the water grid. A major priority for helping groundwater basins achieve sustainability is to upgrade and modernize the state’s water “grid”―the network of reservoirs, canals, rivers, and groundwater basins that store and convey water. Improving the grid’s capacity to move surface water into groundwater storage during wet periods is essential.
  • Updating water allocation rules. For the improved grid capacity to function well, the state will need to make it easier to recharge, trade, and bank groundwater.
  • Finding the money. Finding the money for groundwater sustainability programs will be crucial. The best solutions focus on expanding funding from local water bills and taxes—which currently fund roughly 85% of water management expenditures—and using state general obligation bonds to fund projects with clearly defined public benefits.

Achieving sustainable groundwater management is one of the most important things California can do to prepare for a warming climate. Getting there will require a suite of actions―including some reforms beyond those called for under SGMA. Better planning, modernizing the grid, streamlining water allocation, and finding program funding can help us manage this critical water supply.

Video: Californians and Their Government

In the last weeks of the fall campaign, Democrat Gavin Newsom remains ahead of Republican John Cox in the race for governor. In the US Senate race, Dianne Feinstein continues to lead fellow Democrat Kevin de León. Two closely watched ballot measures—Proposition 6, which would repeal the recent gas tax increase, and Proposition 10, which would expand local authority to enact rent control—are still trailing. These and other key findings of the latest PPIC Statewide Survey were outlined by PPIC researcher Alyssa Dykman at a Sacramento briefing last week.

Democrats are more likely than Republicans to be very or extremely enthusiastic about voting in congressional races, and a majority of likely voters favor the Democratic candidate in their US House district. However, most likely voters have negative views of both major parties.

Other survey highlights:

  • Approval ratings for Governor Jerry Brown and the state legislature continue to be much higher than those for President Trump and the US Congress.
  • A majority of likely voters disapprove of the Senate vote to confirm Brett Kavanaugh’s appointment to the Supreme Court.
  • A majority of likely voters favor the Affordable Care Act, and a solid majority say the federal government is responsible for making sure all Americans have health care coverage.
  • Two-thirds of likely voters oppose building a wall along the entire border with Mexico; a slim majority favor the state making its own policies to protect the rights of undocumented immigrants.

Video: Stackable Credentials at California Community Colleges

California’s community college system is the state’s primary provider of postsecondary career education and plays a critical role in meeting workforce needs. Stackable credentials are a key component of career education programs—students who “stack” multiple, related awards can build skills and increase their potential to advance in a career over time. As the state continues to invest in career education, it is important to understand how these programs can expand employment opportunities, particularly for students who do not get four-year degrees.

In Sacramento this past Tuesday, PPIC researcher Shannon McConville outlined findings from a new report that identifies stackable credential pathways in several disciplines and looks at whether programs with well-defined pathways facilitate stacking. Building on previous PPIC work on stackable credentials in health care, this new report focuses on several other fields—including business, information technology, and engineering.

Nearly 40% of community college students in career education programs start with short-term certificates, which can be earned relatively quickly. Most return to college after earning a short-term award, but fewer than one in four obtain an additional credential. Making it easier for these students to move along a stackable credential pathway could help them get better jobs and earn higher wages.

PPIC’s analysis of existing programs across the community college system suggests that well-defined pathways with clearly mapped course sequences and multiple exit and reentry points do increase the odds of students stacking credentials. It also indicates that few programs have course and credential sequences that are designed to be stackable. Expanding the number of programs with clearly designated stackable features could go a long way toward strengthening the links between career education and long-term employment opportunities.

Is California Turning Even Bluer?

California is already a fairly Democratic state, but in the last two years many have wondered if it has become even more so. In the 2016 presidential election, California was one of a few states that did not shift away from the Democrats. In most of the country, Hillary Clinton garnered a smaller share of the vote than Obama received in either of his campaigns for president—but in California, Clinton improved on Obama’s 2012 vote share by 1.3%, while Donald Trump fell short of Mitt Romney’s share by 5.6%.

Some areas of the state, such as Orange County, have experienced long-term demographic trends that favor the Democrats, yet the swing to Clinton in these places outpaced these trends. Seven of California’s congressional districts are held by Republicans but were won by Clinton in 2016. Just two years earlier, five of those seats favored Republican Neel Kashkari for governor by at least 10 points—in a race that Democrat Jerry Brown won by 20 points statewide.

The 2016 presidential vote therefore marked a big change of fortune for California Democrats, particularly in some districts. Does this mean that these districts have become more Democratic for good, or was the 2016 result a reaction to the personalities on the ballot?

One way to answer this question is to compare the change in the Democratic presidential vote in each congressional district to the change in party registration. Party registration indicates a more enduring attachment—something closer to a permanent change in allegiance. If party registration changed to match the latest presidential vote, it might indicate that something longer-term is afoot.

The figure below compares the change in the Democratic presidential vote between 2012 and 2016 to the change in party registration in the state’s 53 congressional districts from 2014 to 2018. The blue dots indicate Democratic registration change, and the red dots indicate Republican change.

Statewide, the Democratic Party has mostly held steady in registration while the Republican Party has lost ground. We can see this pattern above: the blue Democratic dots are clustered around zero on the vertical axis, indicating little average change, while all the red dots are below zero, indicating a decline in Republican registration. However, our question is whether a larger 2016 surge led to a larger change in party registration by 2018. If this has happened, the blue dots should be higher toward the right side of the graph and the red dots should be lower. We can see such a pattern, but it is weak. Districts on the left have indeed seen both smaller increases in Democratic registration and smaller decreases in Republican registration. Likewise, those on the right have seen larger Democratic gains and larger Republican losses. But the difference is modest.

The districts with the largest Democratic shifts—seen on the far right of the graph—display the expected pattern more clearly. In fact, most of the competitive congressional races mentioned above are represented here. Of the seven races considered most competitive by the Cook Political Report, four are in districts that shifted more than 6 percent toward the Democrats in the 2016 presidential race. All four districts are in or around Orange County: 39 (outgoing incumbent Ed Royce), 45 (incumbent Mimi Walters), 48 (incumbent Dana Rohrabacher), and 49 (outgoing incumbent Darrell Issa). Each of these districts also saw a Democratic registration gain of at least 1.4% and a Republican registration loss of at least 4.4%. So the districts with the most surprising results in 2016 are generally also the places with the biggest Democratic gains in registration.

Overall, these results do provide some support for the idea that the 2016 election marked a more permanent change in the state’s politics. But party registration tends to change slowly, and the patterns we are seeing suggest there may be years to go before any transition is complete.

Video: 2020 Census: ¿Por qué es tan importante el censo?

El censo decenal juega un papel muy clave en la democracia estadounidense. Es bastante lo que está en juego para Californiay el año 2020 se acerca rápidamente.

En este video grabado en español, Joe Hayes, investigador de PPIC, explica la importancia del censo del año 2020, y comenta sobre la propuesta de incluir una pregunta sobre la ciudadanía.

Vea más videos en esta serie.


The decennial census plays an essential role in American democracy. The stakes are huge for California—and 2020 is fast approaching.

In this Spanish-language video, PPIC researcher Joe Hayes explains the importance of the 2020 Census and discusses the proposed citizenship question.

View more videos in this series.


An English transcript of the video is available here.