Improving the Vote-by-Mail System

For the first time in eight years, there is no incumbent running for California secretary of state. This offers a great opportunity to step back and consider where California’s elections are, and where they ought to go next. (You can hear what the candidates have to say about the future of elections at a PPIC event on Thursday, September 11.)

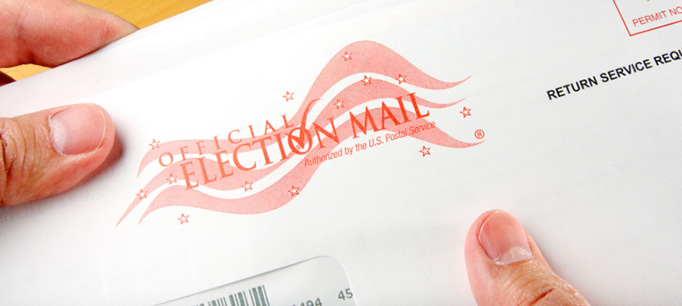
Any such assessment must take a hard look at voting by mail. We see more voters using this option in every passing election, with the growth actually accelerating in recent primaries. If the trend continues, about 57 percent of the ballots in this fall’s election will be cast this way.

The question is no longer whether vote-by-mail is a sensible way to run our elections; it is now how best to manage the vote-by-mail elections we already have. This has put a number of critical issues on the table:

  1. Signature verification. The signature on a vote-by-mail ballot must be compared to the one on file to ensure that the appropriate person cast the ballot. This slows down the process, leaving the outcomes of a few races in doubt for weeks after Election Day. Some counties have been moving to verification by computer to deal with the backlog, but the standards for this sort of verification are murky. The new secretary of state can help clarify which technology is permissible and how this technology should be used.
  2. Late ballots. In a recent PPIC report, we noted that, while the vast majority of vote-by-mail ballots arrive on time, thousands of ballots arrive late and are not counted at all. The legislature has passed a bill (SB 29) that would allow most of these late ballots to be counted. If Governor Brown signs this bill, the next secretary of state will need to monitor the new status quo as it unfolds. In particular, county registrars may face a surge in late ballots as more voters take advantage of the new relaxed standard.
  3. Shrinking postal service. As email and the Internet have grown in popularity, the U.S. Postal Service has been forced to lay off staff and consolidate processing centers. Our PPIC analysis suggests that these changes have not yet created problems for vote–by-mail, but it is a development that deserves constant monitoring.
  4. All vote-by-mail? When 70 percent of the ballots in an election are vote-by-mail, one wonders whether it’s time to abandon the old polling place approach and mandate the vote-by-mail system for everyone. Colorado, Oregon, and Washington use such a system, and it has generally worked well. There are a number of arguments for the change. The persistence of a dual system may add to the complexity of counting ballots, especially with yet another system—same-day registration—coming on-line in the next few years. Moreover, while the evidence for vote-by-mail’s effect on voter turnout is mixed, it generally suggests a small but positive effect. Finally, given the fact that county registrars continue to struggle with small budgets and increasing demands, an all vote-by-mail system would offer a much-needed cost savings.

We will probably never reach a point where every voter voluntarily votes by mail. There will always be some, both young and old, who prefer to show up at a polling place. But we must think carefully about accommodating the new reality of a mostly vote-by-mail system, and how best to make it work for everyone.

Drought Watch: Rethinking Urban Water Pricing

This is part of a continuing series on the impact of the drought.

The California Water Resources Control Board adopted a statewide policy last month requiring local agencies to implement drought plans, including restrictions on outdoor water use. Local agencies have responded in a variety of ways. Some have imposed mandatory cutbacks while others are still only asking their customers to make voluntary cutbacks. Mandatory water use restrictions can be more effective and, according to the July PPIC Statewide Survey, 75 percent of Californians say they strongly favor them. So why aren’t more water agencies enacting mandatory cutbacks during this crisis?

Last month, Jay Lund—a professor of civil and environmental engineering at UC Davis and an adjunct research fellow at PPIC— outlined some of the factors that might cause local agencies to shy away from mandatory restrictions. One important factor is that when conservation measures work, agencies sell less water and their revenues fall. But the costs of providing water services do not decrease as much, so agency balance sheets can end up in the red. As a result, investments in system maintenance and upgrade generally take a hit, and agencies often have to increase rates. This sends a confusing signal to customers, who just did what was asked of them.

There is an alternative: drought pricing. Charging more per gallon during drought years provides an additional conservation incentive and ensures that agencies can cover costs while they are selling less water. According to a June survey by the State Water Resources Control Board, only 4 percent of urban agencies have enacted drought pricing strategies. The city of Roseville is one community using the drought pricing tool, which was adopted—and vetted with customers—before the drought hit. In June, Roseville implemented a temporary 15 percent drought surcharge while also mandating a 20 percent reduction in water use.

Like most things that alter the status quo, drought pricing policies require effective communication with ratepayers. Agencies need to emphasize the need for higher prices alongside increased conservation during droughts to ensure customer buy-in. But a big advantage of a drought pricing policy is that customers understand in advance that prices need to go up to keep their water system solvent, rather than feeling blindsided by a rate increase after the fact. While they require additional effort—and advance planning—by local agencies, drought pricing policies result in better financials and customer relations while contributing to the primary goal of reducing water use during times of scarcity.

Recidivism and Realignment

Early feedback is starting to come in about corrections realignment, the 2011 shift of responsibility for more than 30,000 criminal offenders from the state level to the counties. The issue continues to dominate discussion in the California public safety community. But there are still many questions to be answered about how counties are implementing the changes and what effect realignment is having on criminal behavior.

Last Friday, research fellow Ryken Grattet spoke at a Sacramento briefing about PPIC’s latest research, which looked at recidivism rates for released offenders now being supervised by county probation departments. The study found that offenders released to counties that emphasized reentry services did better than those released to counties that emphasized traditional law enforcement, at least in the first months after realignment. After the briefing, Grattet was joined in the question-and-answer period by his coauthor, research fellow Mia Bird.

Drought Watch: Support for the Water Bond

This is part of a continuing series on the impact of the drought.

With the effects of the drought intensifying, the water bond is at the top of the legislature’s to-do list. Unless an agreement is reached on a new version, the $11.1 billion bond built in 2009 will go before voters this November. This year we have seen a range of proposals for a smaller water bond—including one by Governor Brown and one by Senate Republicans that designates more funding for storage than the governor’s. The debate continues.

Getting approval by two-thirds of both houses of the legislature is just the first step. The next hurdle is voter approval. According to the July PPIC statewide survey, 51 percent of likely voters said they would vote yes on the current $11.1 billion bond, with support increasing to 59 percent if the bond amount were smaller. This is higher than in March 2013, when only 42 percent of likely voters said they would vote yes on the $11.1 billion bond, and 55 percent supporting a smaller bond.

While the size of this bond may be important for voter approval, the central policy debate is about how the money should be allocated. Most funding for California’s water system comes from local water bills and taxes, but a new state water bond could help close critical funding gaps facing some parts of the water sector. The PPIC report Paying for Water in California highlighted the lack of sustainable and reliable funding for drinking water quality in small systems, flood protection, stormwater management, aquatic ecosystem management, and integrated water management.

Even if the legislature and the voting public do come together to approve a new bond, there is still work to be done to ensure sustainable funding for our water system. A bond can be expected to provide about $1 billion per year in new funds, leaving a $1 to $2 billion annual funding gap for critical water services. To close this gap, Californians will need to go beyond bonds and approve a broader mix of revenues, such as water use surcharges or state sales tax increases.

Climate Change, Fracking, and Drought—Oh My!

Last week’s release of the PPIC Statewide Survey: Californians and the Environment prompted a discussion of several major policy issues under consideration in Sacramento. A panel convened by PPIC talked about the survey’s findings on climate change policy, particularly public attitudes toward a potential increase in gas prices when new regulations for transportation fuels begin next year.

PPIC research associate Sonja Petek set the stage for the panel discussion by presenting the survey findings. The panel included Assemblyman Richard Bloom (D-Santa Monica); Anne Baker, a senior advisor at the Center for Energy Efficiency and Renewable Technologies; and Rob Lapsley, president of the California Business Roundtable. The panelists said they supported the goals of the state’s climate change policies. They encouraged a public education effort about the extension of the cap-and-trade program to transportation fuels. The survey found that most Californians also support the policy change, but support drops sharply if it means higher gas prices.

The panel was divided on the state’s approach to fracking, a controversial process for extracting underground oil. Bloom is the author of a bill calling for a moratorium on fracking. Lapsley described the economic benefit of having more in-state oil production. The survey found most Californians opposed to fracking.

The panel also discussed water policies and the drought. In the survey, Californians name water as the number one environmental issue this year, and a narrow majority of likely voters support an $11.1 billion bond that is scheduled for the November ballot. Support is higher for a lower bond amount, something that is under discussion in the Capitol.

Californians and the Carbon Tax

California is leading efforts to address climate change, and public support for state action on this policy has been strong and steadfast. In the July PPIC Survey, six in 10 likely voters say that global warming’s effects have already begun and favor the state’s requirements that greenhouse gas emissions be reduced to 1990 levels by 2020.

The landmark law laying out these efforts—AB 32—relies on a “cap-and-trade” program for companies to reduce their greenhouse gas emissions. The state government currently enforces emissions “caps” by issuing permits that can be “traded” among companies at quarterly auctions. The state is getting ready for the AB 32 legislation to impact transportation fuels in 2015, with costs—which are unknown—likely passed on to Californians at the gas pump. Under these circumstances, some policymakers are having second thoughts about the cap-and trade program and are reconsidering a carbon tax on companies for their greenhouse gas emissions.

In our polling over the past five years, Californians have been more likely to express support for a carbon tax than a cap-and-trade system. In the July PPIC Survey, 54 percent of likely voters favor a carbon tax on companies’ greenhouse gas emissions—identical to the support that we found in July 2009. By comparison, 43 percent of likely voters favor the current cap-and-trade system when read a description in the July PPIC Survey—similar to the 44 percent who supported this proposal in July 2009. This support for a carbon tax doesn’t appear to be a simple reflection of a desire to tax business. A carbon tax on companies is a more popular proposal than raising overall state taxes paid by California corporations, which had a mixed response (48% favor, 47% oppose) in the March PPIC Survey.

What are the attitudes underlying majority support for a carbon tax on companies? Most likely voters are concerned about global warming and want the government to take action. Those who express the most concern and support tend to favor a carbon tax over the cap-and-trade system. For example:

  • Of those who believe the effects of global warming have already begun, 75 percent favor a carbon tax and 56 percent favor the cap-and-trade system.
  • Of those who believe that global warming is a very serious threat to the state’s economy and quality of life, 78 percent favor a carbon tax and 55 percent favor the cap-and-trade system.
  • Of those who favor the state law to reduce greenhouse gas emissions to 1990 levels by 2020, 76 percent favor a carbon tax and 57 percent favor the cap-and-trade system.

There is also a political dimension, reflecting the partisan differences in levels of concern about climate change and support for state action. Democrats are more likely to favor a carbon tax (72%) than a cap-and-trade system (54%), with similar trends for independents (56% carbon tax, 42% cap-and-trade). Republicans show similarly low support for either approach (32% carbon tax, 27% cap- and-trade).

The July PPIC survey also found that potential consumer costs play a striking role in views of climate change policies. Among likely voters, 70 percent, favor requiring oil companies to produce transportation fuels with lower emissions; however, favor for this policy declines to 41 percent if it means an increase in gas prices. What is noteworthy is that most higher-income Californians support lowering emissions—even if gas prices rise. In light of California’s uneven economic recovery, this finding suggests that the state lawmakers should be focusing on ways to limit the financial impacts of new global warming regulations on the state’s less affluent residents, not abandoning current efforts to reduce greenhouse gas emissions that enjoy solid support.

If policymakers are going to debate the pros and cons of these two policy options, it would be worth taking the time to better explain them to the state’s residents—especially since gas prices could increase with either option. Most likely voters have heard only a little or nothing at all about these competing proposals for reducing greenhouse gas emissions. One in four likely voters say they have heard a lot about the cap-and-trade system (24%) and awareness is similarly low for the carbon tax (28%) in the July PPIC Survey. Californians care about climate change and would likely welcome the chance to learn more about the decisions that are being made today to address the challenges of the future.

Realignment: Progress and Challenges

Expectations were high when California rolled out public safety realignment in October 2011; many expressed optimism that the reform would significantly address prison overcrowding and reduce the state’s high recidivism rate.

Now that realignment is approaching the three-year mark, has the reform delivered? In some important ways, yes, it has. But a fundamental issue remains: the state still relies heavily on costly incarceration with limited crime preventive effects.

Realignment shifted responsibility for most lower-level felons from the state to the counties and reduced the state prison population by an impressive 27,000. Although most newly sentenced lower-level felons are serving their sentences in county jail instead of state prison, the majority of the prison population drawdown has been accomplished by essentially halting the practice of sending parole violators back to state prison. The one-year return-to-prison rate for released offenders has dropped by about 33 percentage points (from around 41% to about 8%).

Clearly some parole violators are serving time in county jails (there is no currently available statewide data on county sanctioning of parole or probation violations), but the reform’s stricter limit on how violations can be punished means that offenders now have more “street time.” Also contributing, counties now pay for sanctioning and many have limited jail space.

Importantly, our recent recidivism report shows that decreased reliance on incarceration as a sanction has not been accompanied by an increase in re-offending. In fact one-year re-arrest rates have come down by about 2 percentage points (from 61% to around 59%). In other words, significant reduction in the prison population and halting the use of prison as a sanction for parole violations and minor criminal offenses has moved corrections practices in the right direction in a very meaningful way.

However, the prison population is still above the federal limit, and it has recently started to increase. Furthermore, the reduction in the state prison population has been partially offset by an increase in the county jail population. The shift has put pressure on county jails, where the population has increased by about 11,000 since the October 2011 reform rollout and is continuing to grow.

In other words, the state prison system is still under pressure and now county jails face new challenges. Addressing these challenges solely by building more jails will be fiscally painful and is not likely to be a cost-effective way to prevent crime. Instead, the state needs to identify and implement alternative effective crime prevention strategies. This includes, as intended by the reform, targeted efforts guided by evidence-based practices to reduce re-offending. Among other things, this will require the state to support efforts to gather the data necessary to identify what works in California. But even if these efforts are successful, basic forces like population growth and fiscal stress are likely to force the state to consider sentencing reform and take a closer look at who we incarcerate and for how long.

Six Takeaways from the June Primary

For those of us involved in polling and election analysis at PPIC, the just-released California Secretary of State’s (SOS) Statement of the Vote offers a treasure trove of data about how our democracy is working. The latest SOS report also deserves close scrutiny because the top-two primary, which had its debut in June 2012, operated in statewide contests—such as the governor’s race—for the first time this year. My colleagues Eric McGhee and Daniel Krimm have provided an excellent analysis of the outcomes of legislative district races. Here, I’m going to focus on six election trends—regarding statewide offices, state propositions, and voter participation—that surfaced in my read of the final numbers.

  1. Advantage Incumbents. The big winners in the statewide races were current officeholders: the governor, lieutenant governor, attorney general, insurance commissioner, school superintendent, and controller (now running for treasurer). The number two vote-getters trailed these state officials by wide margins in each race, even while PPIC’s polling indicates that half of likely voters say the state is headed in the wrong direction. These primary results underscore the uphill battle faced by political newcomers in statewide elections. This is best exemplified by first-time GOP candidate Neel Kashkari, who received just 839,767 votes or 19% of the vote—even after spending millions of his own dollars on his gubernatorial campaign. The six Democratic incumbents start out with huge numerical advantages in their statewide races in November.
  2. Major Parties Rule. The top-two primary winners in the eight statewide races are all major party members. The November ballot includes seven statewide races in which Democratic and Republican candidates face off. Only the nonpartisan school superintendent’s race has a Democrat facing a Democrat. The candidates from minor parties—which used to have their own primaries—clearly have a harder time prevailing under top-two primary rules. But the statewide candidates with no party preference—also known as independents—were also shut out, even though they are members of a large voting bloc. The absence of minor party and no party preference candidates could result in a depressed voter turnout in November. In California, 28% of voters belong to a minor party or have declared as no party preference, and PPIC polling indicates that many likely voters have unfavorable views about the Democratic and Republican parties.
  3. Legislature Wins Big. Two measures placed on the ballot by the legislature passed easily: State Proposition 41 (Veterans Housing and Homeless Bond Act), with 65 percent of the vote, and State Proposition 42 (Public Records, Open Meetings, Reimbursements), with 62 percent. These two measures attracted little discussion or media interest. Their success in June is consistent with the high pass rate for legislative ballot measures over time. Still, many likely voters say they disapprove of the legislature, making the easy passage of these measures rather surprising. At the same time, this trend bodes well for the legislature’s propositions on the November ballot, such as a rainy day fund proposal and a possible state water bond.
  4. Knowledge Gaps Loom Large. State Senator Leland Yee, who was embroiled in a political scandal, accused of committing felony crimes, and withdrew his name as a candidate, still placed third in the secretary of state’s race. In fact, he received 380,361 votes or 9% of the vote. His surprising showing raises fundamental questions about the level of voter knowledge and the effectiveness of both the state’s media and the official voter guides in providing election information.
  5. Voters Are Disengaged. The primary turnout this June fell to an all-time low of 25% for registered voters and 18% for eligible adults. Even more troubling: turnout among registered voters in Los Angeles (17%), San Bernardino (19%), Riverside (22%), and Orange (24%) Counties was even lower than the statewide average. Since the top-two candidates are chosen in the primary, low primary turnouts may undermine the legitimacy of November elections over time. Moreover, these numbers raise a larger question: Are low turnouts in four populous Southern California counties symptomatic of a deeper civic malaise?
  6. Results Are Slow. A record 69.4% of primary voters mailed in their ballots this year. While this method is growing in popularity, we are learning that it results in a slow vote count that leaves the outcome of tight races in limbo for weeks. This year, the controller’s race was one of the closest in state history, with a 481-vote margin of victory, and the top-two winners were not known until the last day of June. In the future, we could be waiting for weeks to learn the winner in a tight governor’s race, or California’s outdated voting system could be exposed in a close presidential election. The 58 county registrars will need prodding and assistance by the SOS office to apply modern technology to speed up their vote-by-mail counts. Moreover, given the popularity of voting by mail, we should be looking for ways to make it easier for voters to do so—in part to increase voter participation.

Every election occurs in a unique political context. The 2014 primary results could be an anomaly rather than indicative of some flaws with the top-two primary system. The 2016 presidential year and the 2018 gubernatorial year may feature competitive statewide primary races that lead to different outcomes. Still, the six issues that surfaced in this primary also reflect longer-term trends that are worthy of serious consideration.

PPIC has invited California’s two secretary of state candidates to participate in a conversation with me about the future of California’s elections on September 11 in Sacramento. Stay tuned for more information about how you can attend or watch this PPIC event.

Big Policy Shift Leads to Small Change in Recidivism

A recent briefing in Sacramento focused on PPIC’s new report on recidivism rates since public safety realignment policy began. This policy—which took effect in 2011—shifted responsibility for more than 30,000 offenders from the state to the local level.

The report—Is Public Safety Realignment Reducing Recidivism in California?—found a mixed result. Arrest rates overall are down slightly from the period before realignment. But the proportion of offenders who are convicted after arrest is up about 3 percent. The proportion of those arrested multiple times is up noticeably, probably reflecting the increased time released offenders spend on the streets because of county jails’ limited capacity.

The number of released offenders who return to prison was down more than 30 percent. PPIC research fellow Magnus Lofstrom presented the findings. He was joined on the dais by his two co-authors—PPIC research fellow Ryken Grattet and UC Berkeley policy professor Steven Raphael—for audience questions.

Allow Water Rights Trading

This commentary was published by the New York Times on June 29, 2014, in a discussion of The Water Crisis in the West.


We have an outdated water rights system in the American West: Water goes to those who claimed it first, whether or not they are putting it to the best use.

This system originated out of practicality. The climate in the West is dry for much of the year, and with Western rivers few and far between, it’s often necessary to invest in storage and conveyance to get water to where it is needed. But the rights to use water were allocated many decades ago, when the region had far fewer people, and before it was widely recognized that the system often short-changed the environment. …

Continue reading on nytimes.com.