The Vanishing Line-Item Veto

California officially has a budget for the coming fiscal year. The state plans to spend $156 billion, about 7.5% more than last year.

As in most other states, in California the governor has line-item veto power. After the budget passes, he can remove or reduce individual provisions without the legislature’s approval. That’s a lot of potential authority over the budget.

What did Jerry Brown do with such tremendous power? Not much. He removed or reduced only 10 budget items, cutting a total of $37.9 million. In the context of a $156 billion budget, that’s a rounding error.

And that’s par for the course with this governor. Brown made his highest number of vetoes (42) in the first budget after his election in 2011; these cuts amounted to one-fifth of one percent of the $267.4 million ultimately spent that year. Last year, he vetoed 30 items that added up to only $40.7 million—that’s like a typical California household reducing its annual spending by about $17.

Many governors have gone light on line-item vetoes, but Brown’s veto numbers are low even in historical context. His vetoes have averaged about a tenth of one percent of each year’s final budget. By contrast, Schwarzenegger (2004–2010) averaged two-thirds of a percent, Davis (1999–2003) and Wilson (1991–1998) about three-quarters of a percent, and Deukmejian (1983–1990) a whopping 2.5 percent. Brown himself, when he was governor in the late 1970s and early 1980s, averaged about three-quarters of a percent in line-item vetoes (we do not have data for 1975, his first year).

There are a number of reasons for the recent harmony between the governor and the legislature. But an important one is likely the new threshold for passing the budget. It used to take a two-thirds vote in each chamber, which required at least some members from each party to sign on. As of 2011, only a simple majority of each chamber is required, so Brown has been able to conduct all the negotiations within his own party. In today’s polarized political environment, that simplifies the process enormously—it also helps explain why each of Brown’s budgets has been approved roughly on time, ending a decades-long trend of budgets passing later and later.

Of course, this streamlining of the process entails sidelining Republicans from budget negotiations. Whether that is too high a price to pay depends very much on one’s perspective. But for better or worse, we may be settling into a new budget status quo.
Local Water Funding in the June Primaries

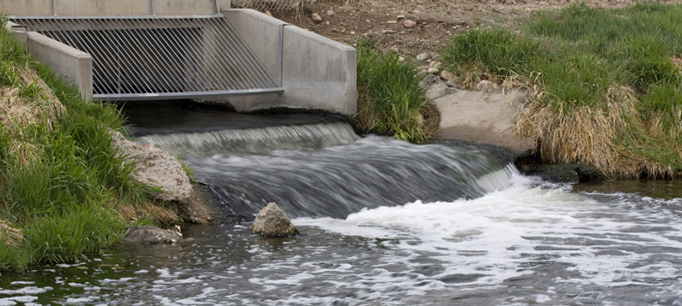
Much of the current water talk in Sacramento surrounds a new state water bond for the November ballot. Yet as we show in our study Paying for Water in California, most water spending—84 percent—is actually raised locally. While passage rates on local water measures have been fairly high since 1995 (72 percent passing), few make it on the ballot (on average only six per year). This is largely because funding for many critical water services—including stormwater management, flood protection, and ecosystem and watershed improvements—often requires two-thirds of voters to approve, and local officials are reluctant to put such measures on the ballot unless they think they can win. In the June 3 primary election, only two local water measures were proposed. The results illustrate the challenges of funding water services that require direct voter approval.

In Contra Costa County, Orinda’s Road and Storm Drain Repair Bond passed with 75 percent approval. It authorizes the city to issue $20 million in general obligation bonds to fund the restoration and repair of roads and storm drains, plus a property tax increase to pay for the bonds. Broader funding measures like this—which include a water service along with something else—have generally been more successful than exclusively water-focused measures. Local governments seem to have recognized this reality and have increased these kinds of measures in recent years. Unfortunately, measures that fund multiple activities may generate less funding than is needed to fill water service gaps.

The second local water measure, the Lake County Healthy Lake Tax, failed with 64 percent approval (repeating an earlier failed attempt in 2012 that had 63 percent approval). It would have increased the local sales tax by one-half cent for 10 years to pay for the eradication of weeds, algae, and invasive mussels from Clear Lake, the restoration of wetlands, and the improvement of water quality.

As the Lake County example suggests, the two-thirds voter threshold for local special taxes and bonds is a significant obstacle. Orinda twice failed to pass measures in the mid-2000s, despite 64 percent approval. Since 1995, 65 percent of the measures requiring two-thirds approval passed, but 84 percent would have passed at the 50 percent threshold that is required for local general taxes and statewide fiscal measures. We can’t know how many more measures would have been put on the ballot had the voter threshold been lower.

Funding these essential water services through local tax and bond measures is a marked contrast to funding for water supply and sewer services, which are paid for with revenues from monthly customer bills. These services are generally in good fiscal shape because when new funds are needed, providers are required only to give customers the opportunity to protest rate increases.

To help address water funding gaps, California should consider treating flood and stormwater services like water and wastewater. It would also be helpful to treat local special taxes like local general taxes and statewide fiscal ballot measures—requiring a simple majority vote. Of course, this would require constitutional reforms. But without these changes, the state will need to provide much more support to local governments to pay for services that are essential to all Californians.

How Can California Increase Voter Turnout?

Days after a California primary that may set a record for low voter turnout, election experts gathered to take stock: What happened last week and how can the state engage more Californians in elections?

PPIC research fellow Eric McGhee first provided a brief overview of how California’s electoral reforms have worked so far. He noted that the top-two primary probably did not worsen voter turnout but did nothing to reverse the decline either. In the absence of an exciting race or issue, it’s unlikely that a primary reform alone will draw more voters to the polls, he said.

The consensus among panelists is that there is no single reform that will reverse declining primary turnout. Improving outreach, educating voters, making registration and voting easier—all are needed to increase engagement.

Jill LaVine, Sacramento County voter registrar, highlighted the importance of voter education. Because there were no high-profile candidates or issues in the June primary, there wasn’t much advertising on television—where many voters get information. She noted the efforts that election officials have made to make voting easier—for example, an app to help voters find polling places, and phone banks to help answer questions. But many Californians are confused by the number of changes in the state’s primary, from the date to the process of voting itself. Along with other panelists, she stressed the importance of fully funding election programs that are mandated by the state. For example, the state no longer provides funding to counties to carry out the permanent vote-by-mail program, which is used by a majority of the state’s voters.

Ethan Jones, chief consultant of the Assembly Elections and Redistricting Committee, said the legislature is addressing structural barriers to voting, such as allowing residents to register and vote on the same day. This reform, which will go into effect in future elections, will allow Californians who become engaged in an issue or candidate at the last minute to participate. There have also been efforts to address attitudinal barriers, to allow 16- and 17-year-olds who are taking civics classes to “pre-register” to vote and be added to the voter rolls when they are 18, for example.

Astrid Garcia, deputy director of the nonpartisan Future of California Elections, noted that in a state as large and diverse as California, it’s crucial to address all the steps that lead up to voting and make the experience positive, so that voters turn out again in the next election. She noted that beginning this year, legal permanent residents can be poll workers, which will educate these Californians about the process and train a cadre of bilingual poll workers for the future. She also noted the importance of “meeting voters where they are,” by allowing residents to register to vote when they seek government services. She also said that it will take time to realize the results of these reforms.

Is the Top-Two Primary to Blame for Low Turnout?

Turnout in California’s recent primary election was abysmal: the secretary of state is reporting that 21.5 percent of registered voters participated. This report doesn’t include many ballots yet to be counted but, according to educated guesses, those ballots won’t push turnout over 23 percent. This would be a record low for California.

Should we blame California’s new “top two” primary for this sad state of affairs? After all, turnout has been pretty low in both of the top-two primary elections California has had so far. Surely it’s part of the story?

This is an explanation in search of a theory. There is no clear reason why California’s new system would discourage people from voting. Many voters probably don’t even remember that we have a top-two system until they look at their ballot. When I examined this issue in a recent PPIC report, I found little evidence that open primaries affect turnout one way or the other. We can’t credit the top-two, but we can’t blame it, either.

The ups and downs of statewide turnout are driven by top-of-the-ticket competition: president, U.S. Senate, governor, and initiatives. An interesting race in one U.S. House, state assembly, or state senate district is going to engage only the voters in that district—often only a fraction of them.

For better or worse, top-of-the-ticket competition has been in short supply of late. In 2012, the presidential primary season was basically over by the time California had its primary, and Dianne Feinstein’s reelection to the U.S. Senate that year was all but a foregone conclusion. This time around, there is no presidential contest and no U.S. Senate race, and the gubernatorial contest has yet to catch fire. On top of all that, statewide citizen initiatives are now banned from the primary ballot. The legislature can place its own measures on the primary ballot (and did so in 2014), but these often lack the hot-button excitement of a citizen initiative campaign.

California does need to think seriously about how to improve primary turnout, which has been declining for decades. But we can’t pin this primary’s low participate rate on the top-two system. It was a predictable result of the statewide campaigns offered to voters. We had one of the highest primary turnouts on record in February 2008, when both the Republicans and Democrats had competitive presidential primaries and California had a say in deciding the outcome. If we get more competition in 2016 or 2018, we’ll probably see a different outcome than we did last week.

Quirks of the Top-Two Primary

This week, California voted for the second time under its new top-two primary system. The boldest innovation of this system is that it allows the top two primary winners to be from any party, even the same one. There will 25 such same-party races this fall, out of 160 total.

In an earlier blog post, I pointed out key differences between the primary and the general electorates: primary voters are typically older and less diverse—and often tilt Republican. These differences can end up producing same-party contests in places where they probably would not have occurred if primary and general election voters weren’t so different.

These same-party contests do not raise questions unless they occur in a district in which either party would typically have a legitimate shot at winning. And so far, the vast majority of same-party contests have been for seats that would have gone to somebody of that party no matter what.

But in 2012, Congressional District 31 in San Bernardino County hosted a same-party Republican runoff—although this district would likely be competitive between the two parties under most circumstances. The complexion of the primary electorate partly explained this outcome, but it also occurred because more Democrats than Republicans competed for the seat. This caused the Democratic candidates to split the loyal Democratic vote too many ways—none of them gained enough support and two Republicans advanced.

The pattern has continued in 2014. Congressional District 31 is again in the mix, avoiding a same-party Republican runoff by just 390 votes (out of more than 42,000). Meanwhile, in Los Angeles and Ventura Counties, Congressional District 25 will host a runoff between two Republicans—although this district slightly preferred Obama in 2012. That doesn’t necessarily mean that CD 25 would have been competitive this year, but all the same, it’s worth thinking about whether a same-party contest is really the match-up voters there would like to see.

The most surprising contest to come close to same-party status this cycle is the statewide race for California controller. The Democrats ran three candidates and the Republicans ran two. At the time of this writing, a same-party Republican race in the fall has been avoided by just 1,924 votes out of almost 3 million cast, a difference of less than one-tenth of one percent. This outcome may well hold, but races this close occasionally flip as more ballots are counted.

These sorts of outcomes are never going to be common under the top two. But in two election cycles they have been common enough that we ought to think about ways to address them. As part of the top-two reform, the legislature banned write-in and independent candidacies in the fall election. I have suggested we revisit that decision, and allow for such candidacies if there is demand. The bar could be set high enough to ensure that the option was rarely used, but low enough to make the option realistic, just in case.

The question is not whether same-party competition is a good idea. In uncompetitive seats, one can make a solid case that it offers choices that voters would not otherwise have—choices about which faction of the party ought to represent the district. But in places where the real conflict is between Democrats and Republicans, a same party contest closes off the very choice the top two is meant to promote.

Drought Watch: Lessons from Kansas

This is part of a continuing series on the impact of the drought.

As summer approaches, signs of the drought are intensifying, with early season wildfires, new reductions in supplies from California’s depleted rivers, and many farmers scrambling for appointments with well drillers to access more groundwater. In Sacramento, there is also a heightened sense of urgency regarding money for the water system, as the June 26th deadline looms for legislative action on a new bond for the November 2014 ballot. The drought has drawn policymaker attention to water system investments, and it has raised hopes that the public will be willing to support new borrowing. While this is good news for California’s water system, the focus on bonds is a missed opportunity to go bigger.

As we showed in our March 2014 study, Paying for Water in California, a new bond can at best provide about $1 billion per year in new funds for water. So even if a bond passes in November, California will still be facing an annual funding gap of $1– $2 billion to meet critical needs. Bonds alone can’t do the job, and now’s the time—during, not after the drought—to consider a broader package of solutions.

One important place to look for additional funds is new state fees and taxes dedicated to underfunded areas like safe drinking water, flood protection, and healthy watersheds. And here’s where Kansas comes in: Since 1989, Kansas has had a small surcharge on urban water use (6 cents/1,000 gallons) to help fund projects of statewide importance. A small surcharge on agricultural chemicals also goes into this fund, as do fines charged to water polluters. And Kansas is not alone. Missouri and New Jersey both have surcharges on urban water use (1 cent/1,000 gallons) to support safe drinking water programs. Maryland, whose environmental problems in the Chesapeake Bay rival those of California’s Delta, has small parcel taxes to fund stormwater control. Minnesota uses a small increment on the state sales tax (0.12 cents/dollar) to support healthy watersheds.

For perspective, the typical price of tap water in California is $2.67/1,000 gallons, so a 6 cent surcharge (as in Kansas) would raise this to $2.73/1,000 gallons, an increase of just 2.2 percent. And the typical California sales tax is 8.5 cents/dollar, so a 0.12 cents/dollar surcharge (as in Minnesota) would raise this to 8.62 cents/dollar, an increase of just 1.4 percent. And these small surcharges would bring in some badly needed cash: About $175 million/year for a Kansas-style urban water fee, and about $575 million/year for a Minnesota-style sales tax increment.

These surcharges could be passed by California’s legislature (by a simple majority or two-thirds vote of both houses, depending on whether they qualify as regulatory fees or taxes) and then signed into law by the governor. Or they could be put before voters alongside a new bond. Of course, the politics of new fees and taxes are trickier than those of new state bonds, for which the bill comes later, when most current officeholders will be termed out. But for the sake of a healthy and secure economy, society, and environment, the time for bold action is now. California will have plenty of company.

Who Likes Proposition 13?

One of the most remarkably stable trends in California public opinion is the strong majority support for Proposition 13, even as the state’s demographics and politics have changed dramatically. This historic citizens’ initiative had the immediate fiscal impact of lowering property tax rates, restricting annual property tax increases, and raising the bar for local special taxes to a two-thirds majority vote. It also fundamentally changed the state-local relationship in California and ushered in the national tax revolt. Its supporters are shaping our fiscal choices today—even though many were not old enough to vote when the measure passed 36 years ago.

Proposition 13 passed in June 1978—toward the end of Jerry Brown’s first term as governor—with a 65 percent yes vote. Our most recent poll finds that 63 percent of likely voters today say that Proposition 13 has been mostly a good thing—as majorities have said since we began asking this question in 2003.
Among Proposition 13’s supporters today, about half were not old enough to vote, and 14 percent were not even born in 1978. As a group, they are mostly whites and homeowners, with annual household incomes of $60,000 or more. But they are also politically diverse. Supporters are evenly divided along party lines, with four in 10 Democrats, four in 10 Republicans, and two in 10 independents or other party members in this camp. More than half describe themselves politically as middle-of-the-road or liberals, while 45 percent say they are conservatives. About half live in the San Francisco Bay Area or Los Angeles.

What unites Proposition 13 supporters? One of their signature features is their higher level of distrust in state government. Large majorities say that the state government wastes a lot of the taxpayer’s money, believe that the state government is run by a few big interests looking out for themselves, and say that they trust the state government to do what is right only some time or none of the time. Six in 10 say that the state is headed in the wrong direction, disapprove of the way that the state legislature is handling its job, and rate the state budget situation in California as a big problem. Most say they would prefer to use the budget surplus to pay down the debt rather than restore social services. They are evenly divided when asked if they approve or disapprove of Governor Jerry Brown’s job performance—however, seven in 10 are in favor of his budget plans and approve of a rainy day fund plan that is going to the voters in November.

Proposition 13 supporters register the most consensus when asked about who should make choices for the state budget today: 83 percent want the California voters to make some of the decisions about spending and taxes at the ballot box, while only 13 percent want the governor and legislature to make all of the decisions.

Perhaps the most enduring contribution of Proposition 13 is that it has given the voters a significant and growing role in fiscal policymaking. Voters will decide the fate of the rainy day fund proposal, as well as a multibillion-dollar state water bond also scheduled for the November ballot.

When voters cast their ballots this year, it is important to be aware of the mindset of the sizable and politically diverse coalition of Proposition 13 supporters: a suspicious view of state government and a cautious approach to spending—even in the context of a strengthening fiscal and economic recovery in California.

May Survey Looks at Views on Budget, Drought

The May edition of the PPIC Statewide Survey, Californians and their Government, explores attitudes toward the governor’s latest proposed budget and gauges preferences in the gubernatorial primary. It also examines opinions on health care reform, the drought, poverty, and climate change.

PPIC research associate Dean Bonner presented the results of this wide-ranging survey at a lunch briefing in Sacramento last week.

Electoral Reforms Face New Test

California’s political reforms—redistricting and the top-two primary—were meant to shake up the status quo through radically redrawn voting districts and a primary system that let voters choose any candidate of any party, and advanced the top two candidates (also regardless of party) to the fall election.

The first time out the gate, in 2012, the reforms didn’t disappoint: numerous incumbents retired, many seats were open, and a lot more candidates threw their hats in the ring. It was the shot across the establishment’s bow that supporters had been looking for.

Things are calmer in this year’s legislative and congressional races. The most obvious sign: an unusually large number of candidates facing no formal opposition. There were eight such races in 2012 and an average of 7 under the previous primary system. Today there are 20.

These candidates may not remain completely uncontested, since there are reasons to think we may see more write-in candidates this time around. The deadline for filing as a write-in—at least one whose votes are actually counted—comes after the normal candidate filing deadline. Under the top two, potential write-ins can wait to see whether a heavyweight ends up uncontested and then jump into the race for less money and effort. As the only other candidate, these write-ins will be guaranteed a spot in the fall campaign. This was not a popular approach in 2012, but candidates are still learning the system, so we may be seeing this strategy coming into its own. We will know more once the official write-in list is announced later this month.

In 2012, there were also a number of incumbents who faced challengers from within their own party. This was a sign, in part, of the better odds facing those challengers under the top two system: so long as they finished at least in second place, they would get another chance to topple the incumbent in the fall campaign. Nonetheless, only a handful of these challenged incumbents lost. Perhaps as a result, fewer incumbents overall face an intra-party challenge this time: 28% this year compared to 42% in 2012. And with only a couple exceptions, even those incumbents facing an intra-party contest are in a dominant financial position.

Finally, there are fewer open seats this year. In 2012, an extraordinarily large number of incumbents chose to retire or run for another office, leaving nine seats open for the U.S. House and 35 open for the state assembly (open seats for the state senate were more in line with past experience). This year, there are six open seats for the U.S. House—still high by historical standards, but less so. And the 23 open seats for the assembly aren’t all that many, at least in the era of term limits.

However, the seats that have come open are hotly contested, as open seats usually are. The great majority of these races feature at least three candidates, and a few have far more than that—with the prize going to Congressional District 33, where no fewer than 18 candidates are vying to replace retiring incumbent Henry Waxman. Moreover, fundraising in these races is much more evenly distributed across a range of candidates.

We are still early in the election cycle, and between the primary and the general there are still plenty of opportunities for surprises. But so far, it looks like the revolution, such as it was, is coming to a close, and a new status quo may be settling into place.

Governor Proposes Minor Changes to K-12 Funding Levels

The governor released the May revision of his 2014-15 budget yesterday. All told, the news was good. Revenues were modestly better than forecast in January—up about $850 million in the coming fiscal year. But due to the complexities of Proposition 98—the constitutional funding guarantee for schools and community colleges—the amount proposed for K-12 education fell slightly.

The governor’s plan for schools is mostly unchanged, however. The chart below illustrates per-pupil funding levels proposed in the May revision. Schools would receive about $8,800 for each student—an increase of $780 from 2013–14. The current estimate of per-pupil funding in 2013-14 is up slightly from the level estimated in January, providing a healthy $430 per student more than in 2012–13.

Most of the new funding in 2014–15 goes to pay for the new Local Control Funding Formula. As in the January budget proposal, the budget includes $4.5 billion, or about $750 per student, for the new funding formula. The three-part formula distributes funding using a base grant (that differs by grade span), a supplemental grant for disadvantaged students (low-income, English Learner, and foster care students), and a concentration grant for districts that serve above-average proportions of disadvantaged students.

The budget also provides $27 million to help districts administer new state tests. With the transition to the Common Core State Standards, new computer-based assessments are currently being field tested in California. Students take the new tests on computers linked to the internet, and the additional funding would help schools develop higher speed internet connections.

One final note: Governor Brown proposes to establish a Proposition 98 reserve in the future to protect against volatility in General Fund revenues. His proposed constitutional amendment creates a rainy day fund that would help buffer schools from the extreme boom and bust cycle of state revenues.

In addition, the governor appears to have established an approach to K-12 budgeting that helps protect state and school district finances from uncertainties in the estimating process. Because revenues—and school funding levels—are estimated a year in advance, the amount of resources available to schools changes throughout the year as the revenue picture becomes clear. To reduce risks to state and district budgets, the administration: ·

  • Makes relatively conservative revenue forecasts. Moderating the administration’s revenue estimates helps prevent the state from spending more than Proposition 98 requires. If actual revenues are higher than assumed, it makes the additional Proposition 98 funds available on a one-time basis to retire debts or pay for other one-time costs. ·
  • Builds more flexibility into annual K-12 budgets. The administration, for instance, proposes to spend about $1.5 billion in ongoing 2014–15 funds to retire one-time K–12 debts that were created during the recession. These one-time expenditures help protect district budgets, because debt repayment can be downsized if Proposition 98 funding does not reach its expected level, while district base budgets are left intact.

This approach requires restraint on the part of state policymakers and local educators. But the dividends—repaid debts and one-time funding for things like computer infrastructure—are also becoming more evident.