Health Care and California’s Undocumented Immigrants

Despite California’s embrace of federal health care reform, millions of Californians are expected to remain uninsured even five years from now. Undocumented immigrants are likely to be a large share of this uninsured group because they are excluded from coverage under the Affordable Care Act. At the state level, legislation has been introduced (SB 1005) to provide subsidized insurance options for all low-income Californians, regardless of immigration status.

California is home to an estimated 2.5 million undocumented immigrants. This population is distributed unevenly around the state, but undocumented immigrants reside in nearly every county. Los Angeles and other Southern California counties have the largest number of undocumented immigrants—nearly a million are estimated to reside in Los Angeles County alone—and this region is projected to have more than 60 percent of uninsured Californians in 2019.

What do we know about how undocumented immigrants use health care today? The limited body of research on health care use among undocumented immigrants finds lower levels of utilization and spending relative to the native born. Despite their limited access to other health care settings, noncitizens are less likely to have recently visited the emergency room than citizens, even when demographic and health factors are taken into account. In part, this is because undocumented immigrants are relatively young and likely to be working, which suggests that they may be healthier than the general population. However, some of these immigrants—particularly farm workers—face heightened health risks.

Without changes in state or federal law, we can expect that undocumented immigrants will continue to rely on the health care safety net—particularly health clinics and hospital emergency departments. Some counties provide services to undocumented immigrants under their indigent care programs—particularly counties that operate public hospital systems— but the majority do not and are not required to do so. Recent PPIC research suggests that California’s network of clinics is well positioned to serve low-income communities, including those with large numbers of undocumented immigrants. About 75 percent of California’s undocumented immigrants live within two miles of a health clinic, although proximity and access varies across counties.

Comprehensive immigration reform at the federal level could improve insurance coverage and access to care in the long-run, but recent proposals have specifically excluded undocumented immigrants on a path to citizenship from federally subsidized coverage. It’s hard to imagine that changing anytime soon. That leaves it up to the state to grapple with health care access for this sizeable group of residents.

The Flip Side of High Housing Prices

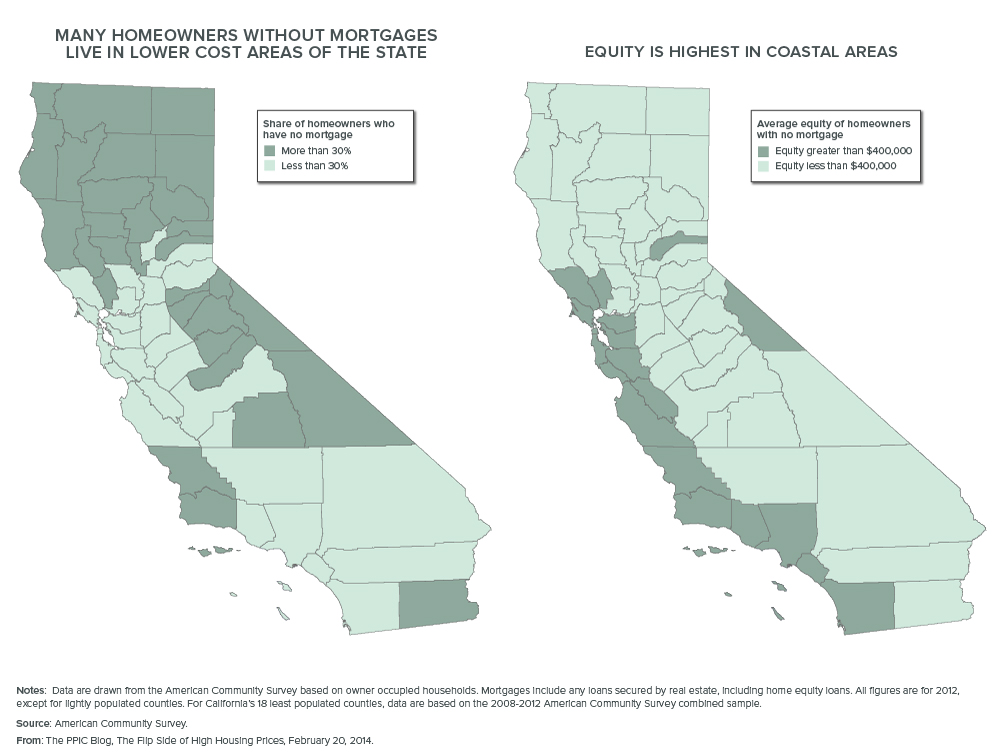
California is notorious for having some of the highest housing prices in the country. Californians pay a greater share of their incomes on housing costs than residents of any other state, meaning that many Californians are “house poor.” But it is less well known that a sizable share of Californians own their own homes free and clear, with no mortgage. When home prices go up, these Californians experience gains in wealth. Because of the high price of housing, these Californians are “house rich.”

According to American Community Survey data, 1.8 million California households owned their homes free and clear in 2012. These households make up 26 percent of owner-occupied housing units and 14 percent of all occupied housing units in the state (compared to 35% and 20% respectively in the rest of the country). Californians who own their homes outright tend to be older—80 percent are over age 55. Those with the most equity live in coastal counties. Some of them are house rich yet cash poor, with 6 percent having incomes below $10,000 per year. But a sizable share—22 percent—are both house rich and cash rich, with household incomes exceeding $100,000 per year. Many have lived in their houses for decades. Because Proposition 13 limits property tax increases for homeowners who don’t move, house rich Californians pay less in property taxes (on average $2,590 per household in 2012) than owners with a mortgage ($4,061 per household), even though their homes are worth about the same amount.

How house rich are they? Total equity for this group of Californians amounted to almost $800 billion in 2012. Average equity was $444,600, far higher than the average of $199,900 in the rest of the country for those who own their homes free and clear. And more than 100,000 house-rich households in California had equity in excess of $1 million, making them millionaires on the basis of housing wealth alone. Clearly, the flip side of California’s high cost of housing is the tremendous wealth generated by housing for those who pay off their homes. Of course, converting that wealth to cash is not always easy or wise, but it is a resource that, used judiciously, can improve the lives of many Californians.

Drought Watch: A Conversation with Business Leaders

This is part of a continuing series on the impact of the drought.

I recently had the opportunity to talk about the economic impact of California’s ongoing drought with two of California’s leading business representatives: Allan Zaremberg, president of the California Chamber of Commerce, and Dave Puglia, senior vice-president of Western Growers—a group that represents the state’s producers of fresh fruits and vegetables, who supply much of the nation and many overseas markets with high-quality, high-value produce. The conversation was wide-ranging, touching on the extent of the drought, its likely economic impact, and the steps that can be taken to help California avoid economic harm from future droughts.

The conversation highlighted several key points:

  • Two types of water uses are being especially hard-hit by this drought: farming—especially in the San Joaquin Valley—and environmental flows that protect fish and other wildlife. Most urban areas are in much better shape, thanks to major investments made over the past two decades to conserve, diversify water sources, and improve local storage systems.
  • The economic impacts of this drought are likely to be concentrated in farming and related sectors, such as industrial processing of farm products and fertilizer and seed sales. The drought will cause severe hardship in some regions, but it will not likely have major repercussions on the state’s economy as a whole, because farming and related activities make up just a small share—1 to 2 percent—of total state gross domestic product.
  • We need to make systematic investments to reduce our vulnerability to future droughts. Urban areas such as Southern California spent significant sums—mostly funded by local ratepayers—to diversify their water supplies. Farming areas have invested considerably in more efficient irrigation techniques, but they have also been drawing down their groundwater reserves. As a result, groundwater—normally an especially valuable resource during dry years—is in short supply in many areas, less able to help farmers weather the drought.

Testimony: Using Cap & Trade Revenues to Bolster Climate Policy

The Senate Budget and Fiscal Review Committee focused Thursday on the governor’s proposal for spending revenue from the quarterly auction of emissions allowances that is part of California’s program to reduce greenhouse gases. The committee took testimony from the Legislative Analyst’s Office, the administration, and a panel of independent experts. Ellen Hanak, PPIC senior fellow, was part of that panel. Here are her prepared remarks:


Thank you for inviting me to address you this morning. I’d like to focus my remarks on ways to think about achieving multiple benefits from the use of cap and trade auction revenues. In addition to a primary goal of reducing greenhouse gas (GHG) emissions, the governor’s budget proposal emphasizes two types of co-benefits: supporting disadvantaged communities (as required by Senate Bill 535) and creating jobs. It’s also important to recognize that the cap and trade revenues have the potential to strengthen an integrated climate policy for California that focuses both on reducing GHG emissions – or “mitigation” – and on helping the state prepare for some of the negative impacts that are anticipated from climate change – or “adaptation.” This approach to using the auction revenues is consistent with the legislative guidance provided by Assembly Bill 1532, which included climate adaptation as one of the desirable co-benefits of a spending plan.

A significant body of research suggests that the impacts from climate change will be significant in California, even if global efforts to reduce GHG emissions are successful. We are already seeing rising temperatures and accelerating sea level rise, and the science points to the likelihood of increased frequency of extreme events, such as more frequent droughts, wildfires, floods, and heat emergencies. Although it is difficult to attribute any specific weather shock to climate change, the current severe drought facing California highlights the importance of making investments to reduce our vulnerability to these types of extreme events.

Some mitigation and adaptation actions are complementary, in the sense that they simultaneously reduce GHG emissions while making us better able to cope with the expected impacts of climate change. Examples include efforts to improve energy efficiency in buildings, to manage energy demand, to conserve water, and to build more transit-oriented “sustainable communities.” All of these efforts reduce energy demand and hence, GHG emissions; they each also make it possible to better handle one or more of the anticipated negative effects of climate change. Energy efficiency and energy demand management lower peak energy needs during extreme heat events. Water conservation helps us cope with water scarcity. And denser, more transit-oriented, and walkable communities reduce the urban footprint, making it possible to lower the water use devoted to landscaping (which helps cope with water scarcity) and to keep more habitat available for California’s plant and animal species that are also being threatened by a changing climate. As another example, forestry management can help store carbon (providing GHG benefits), while also reducing the risks of wildfire and the potentially harmful consequences of such events for the state’s water supplies. (Last year’s Rim Fire, which threatened the water supplies for many Bay Area communities, illustrates this risk.)

The governor’s proposal for spending the cap and trade revenues includes some activities that are clearly complementary in this sense, including weatherization of homes, energy efficiency in state buildings, water use efficiency, and forest fire prevention. Other parts of the governor’s proposal have the potential to be complementary if implemented carefully. For instance, urban forestry can lower energy demand, but it can also raise water demand unless care is taken to plant low-water-using tree species and to design the tree planters in ways that capture stormwater. (This type of approach is known as low-impact development, and it can help increase water supplies and reduce the water pollution associated with storms.) The same is true for the sustainable communities’ grants: They can provide multiple benefits if planning considers other factors besides encouraging transit use, like energy- and water-efficient buildings and landscapes.

In all, as much as a $300 million of the $850 million of proposed spending for next year falls into categories that potentially can contribute to an integrated climate policy addressing both mitigation and adaptation. At a minimum, the state should be attentive to the specifics of how these programs are implemented to ensure that they meet both goals. It could also be valuable to consider some rebalancing of the overall spending proposal to favor measures that contribute to these dual goals. As one example, it could be very beneficial to expand the effort on forest management in California’s upper watersheds.

In closing, I’d like to leave you with a couple of reflections on this idea of using cap and trade revenues to support an integrated climate policy. First is the question of reducing costs of climate change policy for Californians. In contrast to the view that cap and trade revenues should be focused solely on reducing the costs of GHG mitigation, I’d like to suggest that it’s also appropriate to think about using these revenues to reduce the costs of preparing for a changing climate. The cap and trade program itself is designed to help lower the costs of reducing greenhouse gas emissions, because it allows trading of emissions allowances to meet the cap. Preparing for a changing climate will also entail numerous costs for Californians, and using these funds in ways that also support such efforts will help reduce those costs.

Second is the question of what Californians think about the state’s role in climate policy. In PPIC’s most recent survey on this issue eight out of 10 residents said it is important that the state pass regulations and spend money now on efforts to reduce global warming. And eight out of 10 residents said it is important to pass regulations and spend money now on efforts to prepare for the effects of global warming. An integrated approach to using cap and trade revenues will help California meet both goals.

Drought Watch: How Much Do Recent Rains Matter?

This is part of a continuing series on the impact of the drought.

Drought-parched Northern California had a welcome bit of rain during the first week of February. An “atmospheric river”—a meteorological phenomenon that funnels tropical moisture from the west Pacific into California—produced prodigious amounts of rainfall. In the central Sierra Nevada more than 10 inches of rain fell in just three days. More than 20 inches of rain were measured in the Russian River watershed—an amount greater than the annual average rainfall for the City of Sacramento. Some rivers in the North Coast and Sierra Nevada that were at record low levels on February 1 rose to record highs on February 9.

Drought’s over, right?

Not even close.

Still, it is important to acknowledge how helpful this rainfall was. Small towns like Willits, which were facing emergency drought measures to maintain drinking water, got a much-needed boost to their dwindling water supplies. Folsom Reservoir, down to just 160,000 acre-feet of water before the storm (17% of reservoir capacity), added an additional 100,000 acre-feet, which will help cities in the Sacramento area. Several salmon species starting to make their way to the sea got a welcome boost down the rivers. The Delta, which was becoming as salty as it had ever been in any period in recent memory, received a pulse of fresher water. And there was the psychological boost that comes from no longer being the driest year on record.

But this recent rainfall hardly dented the drought. This year is currently the third driest on record, after the two great dry years in California history: 1923-24 and 1976-77. What’s more, this third-driest year follows two fairly dry years. And California is in a statewide drought. The bulk of the rain fell north of San Francisco, offering no relief to the very driest portions of the state and leaving most of the state’s reservoirs unchanged.

In addition, it was a very warm storm, providing little in the way of improved snowpack—normally an important way to store water until spring. And because the rainfall was so intense over such a short period of time, most of it flowed off the hillsides and into streams rather than recharging groundwater.

While impressive in the intensity and amount of precipitation, this storm did little to alter the state’s drought picture. Things may still change, but given that our rainy season has only about six weeks left in it, the odds are against much improvement.

Researchers have noted that when we think about climate, we are influenced by the weather. As John Steinbeck pointed out in East of Eden, if it is wet, Californians tend to think it has always been so and when it is dry, we forget about the wet. Our climate in 2012–2014 has been dry, but our weather, at least in early February in Northern California, has been very wet.

Testimony: Californians and Poverty

A bipartisan legislative caucus, Ending Poverty and Inequality in California, held its inaugural meeting this afternoon. The caucus includes 23 members from both the state assembly and senate, and aims to examine issues related poverty in California, develop policy ideas, and raise awareness. This first meeting provided an overview of poverty and inequality in the state and examined what these issues mean for California’s future. Mark Baldassare, PPIC president and CEO, was invited to speak and prepared these remarks to reflect the contributions of PPIC research fellows Sarah Bohn and Caroline Danielson and the PPIC Statewide Survey team.


Hello, my name is Mark Baldassare and I am the president and CEO of the Public Policy Institute of California. Thank you for the opportunity to speak as you launch this timely, historic, and “EPIC” effort to address poverty in California. For many years, PPIC has provided facts and reports with a range of significant findings on this important topic. For example, our work has shown that California’s poverty rate is higher than the U.S. average, and that one in four California children live in poverty. Recent PPIC studies have raised awareness about the growing income gap between the poor and the wealthy in the wake of the Great Recession. This work found that when we take into account the impact of government programs and the state’s high cost of living, 8.1 million Californians—accounting for 22 percent of our state’s residents—are living in poverty. I would encourage you to go to the PPIC website for our many publications in this area, and ask our staff experts to talk with you about their findings. I will also leave you with copies of the PPIC briefing kit on “California’s Future,” which includes some of our research and information on this topic and demonstrates how important it is to consider long-term challenges facing the state.

To date, PPIC’s research has documented the scale and scope of poverty and inequality in the state, and assessed the impact of programs intended to help those in need. In addition, the PPIC Statewide Survey provides a clear sense of what Californians themselves think about these issues. As the director of the survey, I’d like to focus my brief comments today on the public’s views—on the current economic landscape, the gap between the wealthy and the poor, and the role of government in addressing poverty. Since one goal of this caucus is to raise awareness about poverty and income inequality, results from our polling will help to show what the awareness level about these issues is right now. I’m going to concentrate on findings from our December and January surveys of all adults, and break out the results for those in our surveys with the lowest incomes—under $20,000 in annual household income—and other key groups.

First, let’s look at the broader context for this discussion: How are Californians viewing the state of the state? Our surveys show they are feeling more optimistic about the direction of the state, and more positive about the job performance of the governor and legislature than they were a few years ago. Still, only four in 10 say they personally are in excellent or good financial shape, only two in 10 say they are better off financially than a year ago, and just one in 10 expect their financial situation to improve a lot in the next year. Many also worry that the state could fall into bad economic times in the next 12 months. In other words, personal financial vulnerabilities and economic uncertainties are still widespread. As a result, Californians continue to name jobs and the economy as the most important issue facing people in California today, and many residents say they want the governor and legislature to work on this issue in 2014.

The widening gap between the wealthy and the poor has been a recent theme in federal and state policy discussions. And as the state’s economy is slowly recovering from the Great Recession, public opinion remains firmly in the camp that California is divided into two economic groups—the “haves” and “have nots.” A record-high 66 percent of Californians say that the state is divided into these two groups. A similar proportion, 63 percent, held this view two years ago, but when we first asked this question in January 1999, 56 percent did so. Today, of those with incomes under $20,000 a year, 67 percent view the state as divided into haves and have-nots. Majorities across income levels, political parties, education levels, racial/ethnic groups, age groups, and regions say that the state is divided into these two economic groups.

When asked to place themselves into one of these groups, 45 percent of Californians say they are among the have nots. Two years ago, a similar 48 percent said they were among the have nots, while 35 percent held this view when we first asked this question in January 1999. Today, among those with incomes under $20,000 a year, 69 percent say they are among the have nots. Sixty-seven percent of Latinos and 54 percent of blacks say that they are among the have nots, but just 31 percent of whites and 38 percent of Asians say this.

How do Californians view government’s role in these issues? Importantly, our state’s residents are steadfast in the belief that there is a role for government in providing a social safety net. Sixty-three percent of Californians agree that the government is responsible for taking care of people who can’t take care of themselves. Over the course of five surveys taken between September 1998 and December 2013, more than six in 10 Californians have consistently agreed on this point. Today, 70 percent of those earning less than $20,000 a year believe that it’s the government’s role to take care of those in need. Three in four Democrats view this as the government’s responsibility, and about half of independents agree. Fifty-five percent of Republicans disagree. At 81 percent, blacks are much more likely than other racial and ethnic groups to hold this view. Still, 67 percent of Latinos, 64 percent of Asians, and 59 percent of whites share this belief. And majorities across regions and most demographic groups see a role for government in taking care of people who need help.

When asked about the role of government benefits in the lives of poor people, 51 percent of Californians agree with the view that poor people have hard lives because these benefits don’t go far enough. In the six surveys that included this question, more than half of Californians have held this view. Today, 61 percent of those earning less than $20,000 a year think poor people have hard lives because government benefits don’t go far enough. Sixty-five percent of Democrats agree, compared with 42 percent of independents and 24 percent of Republicans. Seventy-one percent of blacks say that poor people have hard lives, as do 61 percent of Latinos, 53 percent of Asians, and 42 percent of whites.

Given these views, do Californians think government can do more? Today, forty-nine percent say that government should do more to make sure that all Californians have an equal opportunity to get ahead. In December 2011, 54 percent said the government should do more, while 45 percent held this view in January 1999. But Californians are sharply divided over this issue by income level and party affiliation. The belief that government should do more is held by 65 percent of those with incomes under $20,000 a year and 58 percent of Democrats, while four in 10 of higher-income adults and Republicans share this view.

As these findings demonstrate, PPIC’s public opinion polling provides considerable motivation for the work of the “EPIC” Caucus. There are many Californians who are personally financially challenged today, and most residents believe that California is divided into two economic groups—the haves and have nots. Many Californians believe that there is a role for government in taking care of those who need help, that government benefits don’t go far enough in helping the poor, and that the government should do more to make sure that all Californians have an equal opportunity to get ahead. While Californians are divided along party lines when asked about government programs, we found overwhelming support when we asked about raising the federal minimum wage in our March 2013 survey. Since the state recently passed a minimum wage increase, another state policy option that would be worth discussing is the earned income tax credit, or EITC. Although our polling has yet to explore the public’s views on this idea, other PPIC research has noted that the EITC has potential for increasing jobs and stimulating the economy.

In closing, I want to remind you that the poverty rate in our state is high—again, according to PPIC’s calculations, it is 22 percent—and it is higher than the national average. What these numbers tell us, what our survey results tell us, is that many Californians are struggling. If we don’t do something about poverty and income inequality in California today, we won’t have the California we want tomorrow. I hope that you will turn to PPIC as a resource as you grapple with defining the poverty problem in our state and work toward finding solutions to this critical public policy issue for California’s future. Thank you for your time today.

Drought Watch: Size Matters…in a Drought

This is part of a continuing series on the impact of the drought.

The California Department of Public Health has identified 17 community water districts at risk of running out of drinking water this spring. This affects more than 40,000 people, most of them in normally water-rich Mendocino and Sonoma Counties. Although our early February rains have helped, they haven’t significantly changed the outlook for this year. If the drought continues into next year, many more communities will be in trouble.

State and local officials are appropriately focused on providing emergency supplies to meet health and sanitation needs, but it is instructive to examine how these communities ended up in this predicament and how they might avoid it in the next drought.

The 17 at-risk districts have three things in common:

  • They are small (with populations below 11,000—and as low as 39). The limited number of ratepayers makes it difficult to raise the capital necessary to build drought-resilient systems or take advantage of the economies of scale that come with larger water systems.
  • They have just one, or at most two sources of water, which increases their drought vulnerability.
  • They lack physical connections to other water districts. When hard times come they cannot purchase water from urban or agricultural neighbors (a good case study is the town of Lompico, near Santa Cruz).

Compare these small water districts to larger urban counterparts such as the East Bay Metropolitan Utility District, the San Francisco Public Utilities Commission, and the granddaddy of them all, the Metropolitan Water District, which provides water to more than 14 million people in southern California. These large districts have broad-based funding, mixed surface storage and groundwater sources, and connections to multiple water networks. As a result, they are in fairly good shape in this third year of a record-setting drought. (The Metropolitan Water District may be in the best position of all: having learned hard lessons during the 1987–92 drought, ratepayers in this dry region have invested more than $3 billion to improve all facets of water management.)

Many of the more than 2,500 agencies that supply water to California’s cities and towns are at risk of severe drinking water shortages in a prolonged drought. Others could be forced to dramatically curtail water for other domestic uses, such as landscaping. When the drought emergency ends—and it will end, eventually—California policymakers may need to help many small water districts reassess funding strategies. Many districts will need to diversify their supply portfolios, and it should be possible for all but the most remote rural districts to set up water sharing with neighbors in times of scarcity and abundance.

California’s Quietest Reform

California has adopted a lot of high-profile political reforms recently, including a new way of drawing district lines and a radically open primary system. But there’s another reform that is transforming the state legislature without attracting nearly as much national attention.

In June 2012, California voters approved Proposition 28, an important change to the state’s term limits law. Before the reform, a single person could serve a maximum of three two-year terms in the Assembly and two four-year terms in the Senate, a total of 14 years. Under the new law, a person can serve up to 12 years in the Assembly, the Senate, or both. The reform sounds like a tightening of term limits—12 is less than 14—but because legislators no longer face a limit in each chamber, the average length of service will probably increase significantly.

A lot of people have blamed dysfunction in the legislature on the old term limits. Observers have argued that the legislature is short on the kind of relationships and expertise that develop over time, which has led to acrimony and reliance on the expertise of lobbyists. Also, it is often said that members looking to build their records as quickly as possible flood the legislature with unimportant bills, while big problems linger because they take too much time and expertise to address.

When will we know whether the new term limits are helping? Sooner than you might think. Turnover in the legislature has been high since the law took effect. Redistricting helped force a lot of retirements in 2012, a few incumbents lost to newcomers, and there have been several special elections in 2013 to fill vacated seats. As a result, more than half of the Assembly (42 out of 80) is already covered by the new limits.

The new law’s effect on the Senate has been smaller: only two senators, Richard Roth and Andy Vidak, are covered by the new limits. But that’s because termed-out members of the Assembly dominate Senate races and probably will for a while to come. So even though it may take longer for the Senate to switch over, it’s less important if we’re concerned about expertise: since most senators are former members of the Assembly, they already have legislative experience.

Regardless what happens in the Senate, the pace of turnover in the Assembly won’t slow down much. Sixteen assemblymembers will term out this year, and it looks like another seven will be stepping down anyway. When the dust settles this fall, no more than 17 members of the Assembly will be covered under the old limits. The rest will be legally free to serve for at least another 10 years—in some cases 12.

The new California Legislature is coming, ready or not.

Will Uninsured Californians Get Health Care? Most Say Yes

California’s health insurance exchange, Covered California, has enrolled more than 625,000 people under the Affordable Care Act. However, many eligible enrollees have yet to sign up, including a disproportionate share of Latinos. But if residents follow through on the intentions they express in PPIC Statewide Surveys, enrollment should continue to grow for all groups. This is significant because Covered California will need to enroll a broad group of eligible Californians—particularly the young and healthy—to keep premiums low in the future.

In PPIC’s January survey, 72 percent of the uninsured say they will obtain insurance in accordance with the law, up slightly from our December survey (66%). We then combined the two surveys and found that solid majorities of the uninsured in all demographic groups say they plan to sign up, with particularly high numbers in the following groups:

  • Young people: 76 percent of residents ages 18 to 34 plan to enroll in health insurance. Of all the uninsured who say they will do this, 52 percent are in this age group.
  • Latinos: 72 percent say they will enroll. Latinos comprise just 20 percent of current enrollments, but in our survey 61 percent of all those who say they plan to sign up are Latino.
  • Spanish-preferring residents: 70 percent of those who took the survey in Spanish say they will sign up.
  • Lower-income residents: 75 percent of those with annual household incomes under $20,000 say they will obtain insurance. Of those with annual incomes of $20,000 to $40,000, 65 percent plan to enroll.
  • Women: 75 percent plan to enroll.

Chart Sources: PPIC Statewide Surveys, December 2013 and January 2014.

Refundable Tax Credits Ease Poverty in California

Poverty and income inequality have become hot topics in policy circles at the state and national levels. PPIC has been looking at these issues, too—recently analyzing the role that needs-based programs play in helping families make ends meet. In conjunction with researchers at the Stanford Center on Poverty and Inequality we measured poverty in California more comprehensively than the Census official poverty measure does. We found that the federal Earned Income Tax Credit (EITC) and refundable portion of the Child Tax Credit have the biggest impact in moderating poverty rates, relative to other safety net programs.

Both programs are aimed low- and moderate-income families with dependent children. Families must file tax returns to participate in these programs, which are funded by the federal government. (In addition, 25 states and the District of Columbia have their own smaller EITCs, although California does not.) The EITC is fully refundable, meaning that a family with earnings but no net tax obligation (after deductions) receives the full amount of the credit (based on their earnings) in the form of a tax refund. The Child Tax Credit is partially refundable.

Together, the EITC and CTC trimmed the 2011 poverty rate for working age adults from 24.0 percent to 21.4 percent. The child poverty rate dropped even more, from 31.1 percent to 25.1 percent. Put another way, an additional 600,000 California adults and 560,000 children would be considered poor without these programs.

Chart Source: The California Poverty Measure: A New Look at the Social Safety Net.