Good News on the California Economy

Information released today shows that the state’s economy in 2013 was stronger than we thought. According to revised data, California’s economy created 447,400 jobs during 2013, on an annual average basis. This is about 200,000 more jobs than the government initially reported. (Previous estimates understated this number because some jobs were erroneously excluded and because of errors inherent in sampling methodology.)

How are these numbers generated? On a monthly basis, a survey of employers helps to estimate payroll employment for California’s “nonfarm” workers (which excludes proprietors, the self-employed, unpaid family workers, farm workers, domestic workers in private households, and uniformed members of the armed services). In March of each year, these initial estimates are reconciled to actual counts of employment derived from unemployment insurance tax records, and revised estimates are released.

The effect of these revisions on the underlying employment trend is significant, with California adding jobs at an average annual rate of 3.0 percent during 2013. This is nearly double the rate that the government had previously reported (1.7%), and is significantly higher than the national rate. In fact, starting in the last quarter of 2012, California’s employment has grown at an annual rate that is 1.4 percentage points higher, on average, than the national rate. We have not seen a California-U.S. job growth gap of this order since 2009—and this time around, California is outpacing the nation. Relative to other states, the state’s job growth ranked third in 2013, surpassed only by North Dakota and Utah.

Job growth has been revised upward in most industry sectors. Traditionally, the revision process most impacts those industries experiencing unexpected growth. In 2013, those industries included health care, management, and construction. Jobs in health care and management grew 4.9 and 3.2 percentage points faster, respectively, than originally estimated. Previous estimates had not pegged either of these industries with the fastest job growth. Construction jobs grew at an average annual rate of 8 percent during 2013 (2.7 percentage points up from the initial estimate), which points toward a housing recovery that’s even stronger than expected.

In contrast, jobs in the arts, entertainment, and recreation sector grew at a slower pace than previously reported (3.7% instead of 5.5%). But even so, annual average job growth in this sector remained among the highest. The revised data also revealed that government hiring finally picked up in the last five months of the year—adding on average 25,800 jobs more than previously reported, a reversal of the trend reported in the initial estimates.

Upward revisions pushed job growth higher throughout the state. For example, in 2013 the Los Angeles-Long Beach-Santa Ana metro area is now reported to have created 50,900 more jobs than previously thought, for a total of almost 143,000 jobs created. Likewise, the San Francisco-Oakland-Fremont and the Riverside-San Bernardino-Ontario metro areas created 42,400 and 33,600 more jobs, respectively, than originally reported. This means that employment in these two metro areas grew at an annual rate of 4 percent.

Before the revisions, the state government projected that California would continue to add jobs this year at an annual rate of about 2 percent (around 340,000 jobs). In light of 2013’s stronger-than-expected job growth, we are anticipating an upward revision on job growth projections for 2014, too.

Chart source: California Employment Development – Labor Market Information Division and Bureau of Labor Statistics.

Drought Watch: Roadblocks to Efficient Funding

This is part of a continuing series on the impact of the drought.

The drought has prompted California to redirect hundreds of millions of dollars of remaining state bond funds and other revenues to make the state more resilient in the future. These funds are certainly welcome, but it’s important to see this spending in perspective. As we show in a new PPIC report—written with a team of co-authors from other institutions—the contributions of state money are small change when it comes to spending on water. Most of the $30 billion spent annually to support California’s water system is raised by local and regional water agencies.

The good news is that California’s urban water and wastewater utilities are in relatively good fiscal health. Thanks to their significant investments to improve water supply reliability in the two decades since the last major drought, California’s major urban areas—and the state’s economy—will largely be able to weather this one. Crucially, these utilities have been able to make the needed investments by raising local water rates.

However, looming legal challenges may limit the ability of local agencies to make continued investments in modern, integrated water management—investments that would better prepare us for population growth, climate change, and future droughts. Proposition 218, a constitutional amendment adopted by the state’s voters in 1996, requires water bills to reflect the costs of service to each individual parcel. As some recent court cases have shown, a narrow interpretation of this requirement can present roadblocks to several important management tools:

  • Conservation pricing. Tiered pricing—which charges higher per gallon prices for larger amounts of water use—can promote conservation. And, because new water sources often cost more than existing supplies, higher-priced tiers are justified. But it is difficult to establish a precise link between the price paid and the amount of water saved at each property. As a result, these rate structures may be legally vulnerable even though they improve utilities’ ability to maintain reliable water service.
  • Use of new water sources. Non-traditional sources of water, such as recycled wastewater and stormwater, improve overall system reliability for existing customers, even if not all customers use those specific sources. But a recent trial court interpreted Proposition 218 to mean agencies could not charge customers for any part of water service (in this case, recycled water) that was not physically available to them.
  • Sustainable groundwater management. One promising way to stabilize California’s overtaxed groundwater basins is by charging a per gallon fee to limit pumping and to cover the costs of recharging basins with other supplies. But because groundwater overdraft doesn’t affect each parcel in exactly the same way, groundwater agencies have also faced court challenges regarding the legality of these fees.

To enable our water system to respond effectively to future droughts, the courts need to keep the entire water system in mind when responding to rate challenges. And over the longer term, California needs to better align its funding laws to the goals of modern water management. In a state where drought is a fact of life, this alignment will allow us to manage this crucial resource far into the future. Asking our water managers to account for the cost and location of each drop of water when developing their water rate structures will undermine recent momentum toward a more sophisticated and interconnected water system.

No-Stakes Testing

Beginning March 18, California’s schools will pilot a new type of standardized test for students in grades three through eight and grade eleven. (A small sample of students in grades nine and ten will also take some tests.) These tests represent a significant departure from the standardized exams that were administered in school classrooms in the past.

First, the examinations are aligned with the new Common Core State Standards; they will attempt to assess conceptual understanding and problem solving skills in mathematics and English. Second, they will be given on computers, replacing the infamous #2 pencil and bubble sheets. Third, and perhaps most important, this spring’s exercise is really a “testing of the test” that will have no consequences for students, teachers, or schools. In fact, the U.S. Department of Education removed the most significant consequence last week when it issued a letter stating that the pilot testing would satisfy the federal requirement that California test its students as part of the No Child Left Behind law.

California is a member of the Smarter Balanced Assessment Consortium (SBAC), one of two multi-state consortia to get federal funding to develop assessments aligned with the Common Core standards. Since 2011, SBAC has been working with teachers, college professors, testing experts, administrators, and technicians to develop a new generation of tests. Though there will be some multiple-choice elements, these new exams will feature open-ended questions as well as tasks for students to perform that involve showing their work. (Some of the open-ended and task-oriented questions will have to be hand-scored by professional readers.)

In theory, the SBAC tests represent a big jump forward in trying to measure learning. This pilot exercise will put that theory to the test, as students try out the questions and the technology used to deliver the tests.

This past summer, the state legislature made some important decisions regarding the transition to the new testing regime (AB 484) that we will now watch play out. One of the biggest was that the pilot tests would replace the old Standardized Testing and Reporting (STAR) assessments, saving time for teachers and money for the state.

Because the legislators decided that there would be “no consequences” to this pilot, no letters will appear in the mailboxes of parents over the summer with colored bar charts declaring whether or not their children are “proficient.” The results will not be used to develop accountability scores for schools; nor will they be associated with individual teachers. The purpose of this year’s testing is really to determine whether the tests are doing what they were designed to do: assess student learning.

The demise of the STAR tests will probably warm the hearts of more than a few students. There is a downside to this transition, however. First, it is likely that the results will be publicly reported in the broadest terms, which will limit the chances of anyone other than SBAC to learn from the exercise. Second, given that 2014–15 will be the first full year of SBAC testing, we will have to wait at least until the 2015–16 school year to begin measuring our progress.

Rebooting California’s Congressional Delegation

We’ve just passed through retirement season in California politics: the weeks leading up to the candidate filing deadline when incumbents who have decided to step down often make their announcements. Six of California’s 53-member delegation to the U.S. House of Representatives have decided not to run; the latest is Democrat Gloria Negrete McLeod, who is leaving after only one term to run for the San Bernardino County Board of Supervisors. Also retiring are John Campbell, Buck McKeon, Gary Miller, George Miller, and Henry Waxman.

Six retirements might seem like a lot, but California’s rate of open seats this year (11%) is only slightly above the national rate (9%) and in line with the national rate in other recent non-redistricting years. (The disruption caused by redrawn district lines usually increases the number of retirements.)

California had gotten used to low turnover in part because the districts drawn by the legislature in 2001 preserved the status quo. But the new independent redistricting commission and top-two primary have opened the floodgates. Fourteen incumbents either retired or were defeated for reelection in 2012. With this year’s retirements (not all of which can be traced to the reforms), more than a third of the delegation will have turned over by the time the dust settles this fall.

This turnover is having a dramatic impact. At the start of the 112th Congress in 2011, California’s delegation had served an average of 15.1 years, far higher than the national average of 9.8 years (this number comes from the Congressional Research Service). But by the start of the 113th Congress in 2013, California’s average had plummeted to 10.2 years, and with this year’s retirements it will fall to 9.7 (or lower if some incumbents are not reelected). In the context of congressional history, that’s like pressing the reset button.

This rapid change raises questions about what we need from our representatives. On the one hand, we want turnover in Congress. New members can bring new ideas and fresh perspectives. At the very least, we want to feel like we can kick members out of office if we get fed up with them.

On the other hand, experienced representation can be more effective for both the state and the nation as a whole, and even mediocre representatives gain influence over time. Incumbent retirements or losses since 2010 have included the top majority or minority member on eight committees and 10 subcommittees, some of them among the most influential in Congress. The state should expect a diminished profile on Capitol Hill as a result.

Which is better: experience or responsiveness? There’s no simple answer. Without passing judgment on the specific members who have retired, one might argue that the pre-reform delegation had gotten out of whack, with too many members serving too long. But if things shift too far the other direction we could lose all the benefits of experience.

The recent turnover puts California at the national average for the first time in decades. We’ll see what impact that has on both behavior and legislation.

Ready for College?

California needs more college graduates than it is currently producing. Part of the problem has been a lack of college readiness among the state’s high school graduates. Fortunately, recent trends in college preparation provide some good news. By several measures, a large and growing share of the state’s high school graduates are ready for college-level work. Indeed, many of them have successfully completed college-level courses even while still enrolled in high school.

New data on Advanced Placement (AP) exams are especially encouraging. AP courses are college-level courses in more than 30 subjects offered in high schools throughout the country. AP exams determine whether a student has attained college-level proficiency in the course, and AP exam passage rates are a meaningful measure of college preparation. Many colleges accept AP exams for college credit, and research shows that AP students outperform other students in college. Indeed, students who earn AP credits graduate at higher rates overall and often perform better in subsequent courses in the same field.

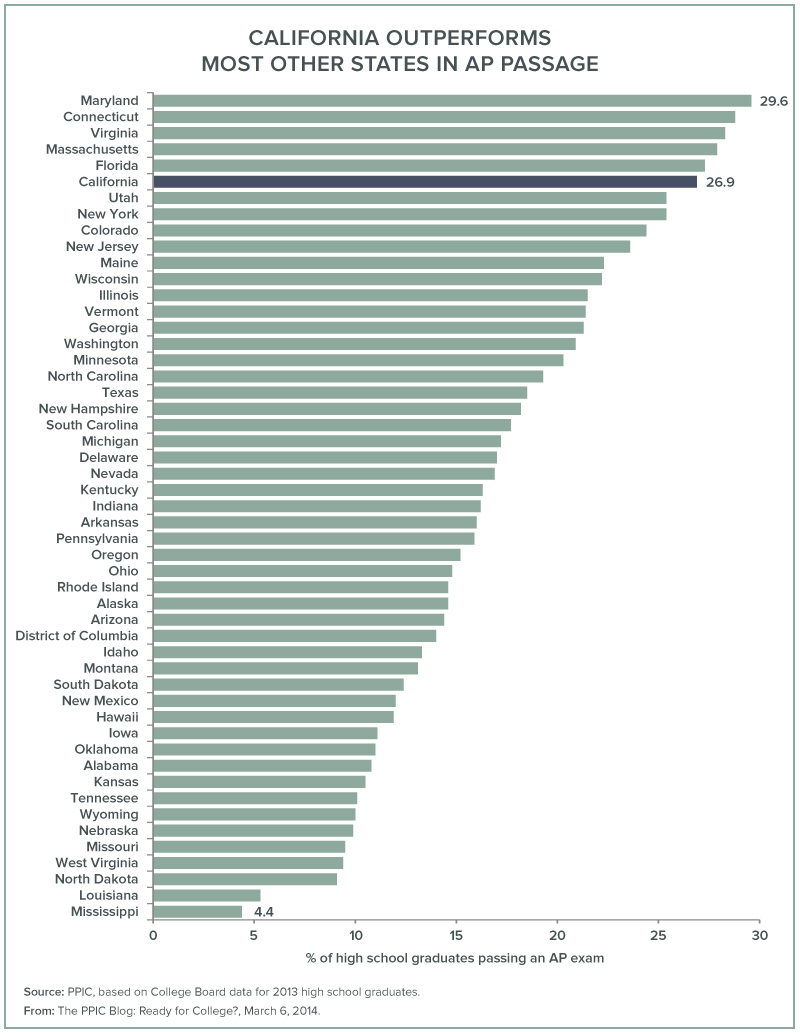
California’s high school graduates outperform their peers in the rest of the country on AP exams. In 2013, more than one in four California high school graduates (26.9%) passed at least one AP exam sometime during high school, compared to one in five in the nation as a whole. Among the 50 states and the District of Columbia, California high school graduates ranked sixth highest. Moreover, the share of graduates successfully completing an AP exam is going up fast in California—higher than in the rest of the nation. Between 2003 and 2013, the share of high school graduates passing at least one AP exam increased 9.6 percentage points in California, compared to 7.9 percentage points for the entire nation. California has a higher share of graduates taking AP exams than does the nation as a whole (45.6% versus 35.0%), with passage rates among AP exam takers slightly higher in California (59.0% versus 57.4%).

Other measures of college readiness also show progress. More students are taking the college preparatory courses (known as the “a–g” courses) required for admission to the University of California (UC) and the California State University (CSU). The latest data from the California Department of Education show that 38.3 percent of public high school graduates in California took the a–g courses in 2011–12, up from 34.6 percent in 2001–02 and from 32.3 percent in 1993–94. Gains in college prep work have been especially impressive among the state’s Latino high school graduates, who now make up almost half of all high school graduates. Among Latino graduates, the share taking a–g courses increased from 21.8 percent in 2001–02 to 28.0 percent in 2011–12. Increases in college readiness would be even better news if our state was responding with policies to meet the growing demand for college. But it’s not. Only the top eighth of high school graduates are eligible for UC and only the top third are eligible for CSU—according to eligibility thresholds that were set more than 50 years ago. Given the increasing shares of high school students who are well prepared for college, some reconsideration of those thresholds is long overdue.

If California is to meet the demand for educated workers, it needs to produce more college graduates. Making room for these highly capable students—by increasing the share of high school graduates eligible for the University of California and the California State University systems—would improve the well-being of our state and the lives of these young Californians.

Chart sources: PPIC calculations based on College Board data.

Drought Watch: Harnessing the Storms

This is part of a continuing series on the impact of the drought.

Southern California got a thorough soaking in late February and early March, with intense storms that caused localized urban and coastal flooding. Northern California also received some much needed rain and snow. As officials pointed out during and after this wet interlude, it helped, but it was not a drought buster.

So where did all that rain go and did we miss an opportunity to improve our water supplies?

In urban Southern California and the San Francisco Bay Area, most of this water was lost to the ocean. This loss comes from both the nature of the storms and our long-standing approaches to stormwater management.

First, like many of California’s winter storms, these storms were very intense. When heavy rains fall on urban landscapes, all those hard surfaces—roads, roofs, gutters—gather and shed water quickly rather than allowing it to soak in to recharge groundwater.

Second, the way we manage most of this runoff in coastal areas ensures that it goes to the ocean. During the post-WWII expansion of urban California, planners and engineers viewed storm runoff as a nuisance to be disposed of as quickly as possible. The iconic California urban stream—straightened, channelized, and lined with concrete—is designed to move water rapidly out of neighborhoods and route it to the ocean. This design has made places like the Los Angeles River better suited to filming car chases than to harnessing local water supplies. Moreover, this fast-moving stormwater is a major source of pollution of California’s bays, beaches, and watersheds. Regulations to limit this pollution have become increasingly strict, making this one of the costliest water management headaches for many California communities.

Fortunately, this antiquated style of stormwater management is now changing. Many of the state’s urbanized areas have begun to capture and store stormwater in groundwater basins for later reuse. Sustainable stormwater management can be accomplished in many ways: installing pavements that soak up rain instead of repelling it, designing landscapes and streetscapes to capture runoff, replacing hard urban landscapes with parks, and routing stormwater into settling basins. These projects achieve multiple benefits: in addition to increasing local water supplies and greening our neighborhoods, they help reduce water pollution.

All of these efforts are still a work in progress. Drought legislation signed by the governor will allocate some additional state funds to stormwater projects. This money is a welcome boost, because funding stormwater projects with local dollars is difficult to accomplish. As a forthcoming PPIC report on water system finance shows, stormwater is a “fiscal orphan” —an area where our current funding rules (including two-thirds majority voting requirements to pass local special taxes) limit the ability of local managers to raise the resources they need to make smart community investments. Reshaping our urban environments to make stormwater an asset, rather than a liability, will take time and money but it will pay off in future droughts.

Evaluating Student Success at the City College of San Francisco

In July 2013, the Accreditation Commission for Community and Junior Colleges reaffirmed its earlier decision to pull accreditation from the City College of San Francisco (CCSF). Citing a “lack of financial accountability as well as institutional deficiencies in the area of leadership and governance” as the “main obstacles to the college’s turnaround,” the commission allowed CCSF 12 months to prepare to cease operation. San Francisco’s city attorney and City College faculty have filed lawsuits against the commission, and in January a court granted an injunction placing the loss of accreditation on hold. The California Community College Chancellor’s Office, which oversees the state’s 72 community college districts, is working closely with City College to address the commission’s concerns and avoid the loss of accreditation. And the state legislature is considering a bill that would stabilize CCSF funding for the next two years. Meanwhile, students are responding to the controversy: City College reports a 16 percent decline in spring enrollment in 2014 compared to 2013.

The fight over CCSF’s accreditation is focused on a number of issues and concerns. But it raises important questions about how colleges should be evaluated. Many states have begun funding higher education institutions based on performance, and California officials are discussing similar performance measures. Most would agree that student outcomes are an important measure of any college’s effectiveness. Of course, good student outcomes for a college might simply reflect the strength and preparation of incoming students.

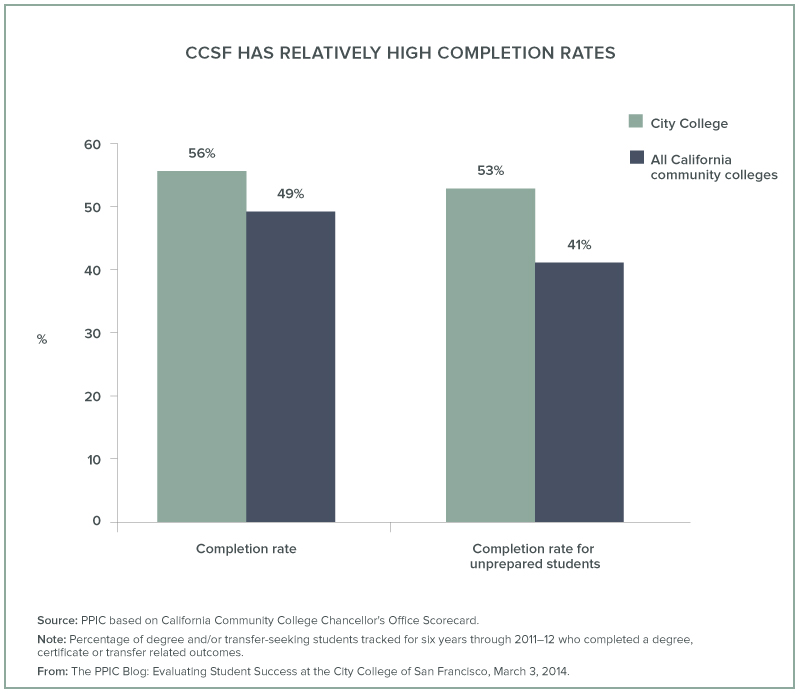
Because the California Community College Chancellor’s Office does an excellent job of providing information on student success, we have a wealth of data to examine student outcomes at CCSF. By most measures, City College fares well relative to other community colleges in the state. The share of students who complete college by earning a degree or certificate, or by transferring to a four-year college, is higher at CCSF than in the rest of the state. This advantage holds even when we limit our analysis to students who are initially unprepared for college-level work, which suggests that it is not simply the mix of students drawn to City College that drives its outcomes. (Although it is possible that CCSF’s unprepared students are closer to college level than unprepared students at other colleges.)

Of particular interest is how effectively a community college prepares students for transfer to four-year colleges or universities—this is arguably the most important mission of community colleges. Among students defined by the chancellor’s office as intending to transfer, City College has a higher success rate than most other college districts, ranking 6th out of the state’s 72 community college districts and 4th among the state’s larger districts—those with at least 2,000 students intending to transfer. The other top districts are a who’s who of the state’s most highly regarded: Foothill-De Anza, South Orange County, San Diego, Pasadena, and Santa Monica. By this important measure, City College is in very good company.

On some outcomes, City College performs below average. For example, its success rates in math remediation are significantly lower than the state average, and the share of career technical, or vocational, students who earn a certificate is slightly lower than the state average. However, City College fares well in most other measures. For example, the share of students who successfully complete remediation in English is higher than the statewide average, as is the share of students who successfully complete ESL courses.

Student outcomes are not the only way to assess a college. But they are an important measure of success. CCSF has provided thousands of students with a pathway toward meeting educational and occupational goals. That is no small feat.

Testimony: Community Colleges’ New Scorecard

The Select Committee on Community Colleges held an oversight hearing, “The State of California Community Colleges,” on February 18. The committee invited PPIC Bren Fellow Hans Johnson to testify on the Community College Chancellor’s Office efforts to provide new information on student outcomes through its Student Success Scorecard. Here are his prepared remarks.


Thank you Chairman Fox and committee members. My name is Hans Johnson. I am a Bren Fellow with the Public Policy Institute of California. PPIC has produced a number of studies on California’s higher education systems. Our focus in those studies is on student outcomes, and how we can improve those outcomes. I appreciate the opportunity to testify today about the Community College Chancellor’s Office efforts to provide more and better information on student outcomes through their “Student Success Scorecard.”

Community colleges play an especially important role in California. They enroll the large majority of undergraduates in our state, far more than UC, CSU, or private institutions. As a state, from a budget and enrollment perspective, we place more emphasis on community colleges than do most other states. Helping more community college students to achieve degrees, certificates, and transfer is key to our state’s wellbeing.

As an independent researcher, I have had the opportunity to work with the Chancellor’s Office, and I have been very impressed with their professionalism and their knowledge. The scorecard is a step in the right direction for several reasons. First, the scorecard offers the right kind of information on the right kinds of student outcomes. For numerous critical measures, such as completion rates, the scorecard provides information on outcomes for each of the state’s community colleges, with breakdowns for key demographic groups.

Second, the scorecard is transparent and accurate. It reflects the impressive data collection efforts and expertise of the Chancellor’s Office. Details about the scorecard measures and how they were created are readily accessible.

Third, the scorecard presents information in a user-friendly format. Graphs and tables are well-presented and easy to follow. This is critical for parents and prospective students as they consider their college choices.

Finally, the scorecard is a useful tool for policymakers, policy researchers, and the colleges themselves. The scorecard makes it easy for colleges to identify where they stand relative to other colleges and to measure their progress over time. For policy researchers, this information is useful in answering questions about student progress. For example, using the scorecard we find that there is a wide range in completion rates across colleges (with completion defined as earning an associate’s degree, a certificate, or transferring to a four year college). Some of this variation can be attributed to differences in the academic preparation of incoming students, as can be shown using scorecard data.

The scorecard is an important tool, but it could be enhanced by incorporating additional measures. This would be easy to do, because the Community College Chancellor’s Office already has very useful data available elsewhere. For example, through its Salary Surfer the Community College Chancellor’s Office provides data on salaries of community college students before and after earning a degree or certificate. Adding this information to the scorecard would provide valuable labor force information for prospective students. The Chancellor’s Office provides even more data on student outcomes through its online Data Mart query tool. Some of that data, such as transfer rates to four year colleges, should also be incorporated into the scorecard.

California’s community colleges are doing a very good job of collecting and sharing important data, and the scorecard is an important example of those efforts. However, the Community College Chancellor’s Office still faces a big challenge in getting the scorecard into the hands of prospective students and parents when they need it most.

Finally, it must be noted that the scorecard is only a tool. The information provided in the scorecard can prompt action, but the real key to increasing student success depends on improving student pathways to transfer, degree completion, and certificate completion.

Testimony: Poverty and the Safety Net

The Assembly Budget Subcommittee for Health and Human Services is considering the level of financial support to CalWORKs, California’s cash assistance program for families with children. The panel held a hearing on Wednesday that began with testimony from PPIC research fellow Sarah Bohn about recent poverty trends and the impact of anti-poverty programs. Here are her prepared remarks.


My name is Sarah Bohn. I am an economist and research fellow at the Public Policy Institute of California. I hope most of you are familiar with PPIC, but for those who are not, we are a nonpartisan, independent research institute focused on major policy issues in the state. I will present the most recent facts on poverty in California and discuss their implications.

In the midst of the slow recovery from the Great Recession, attention has turned to the causes, consequences, and possible solutions to growing poverty in California and the nation as a whole. These have been topics of importance to researchers for a long time. In fact, today’s economic realities are largely the result of long-term trends. But the recession and the 50th anniversary of the War on Poverty have brought these issues into focus for the wider community and offers an opportunity for reassessment. For example, last December, the PPIC Statewide Survey found that a record-high share of Californians—66 percent—believe the state is divided into “the haves and the have nots.” Well below a majority identify themselves as part of the “haves”—a much higher share did so a decade ago.

The latest official poverty estimates suggest that about 16 percent of Californians are poor, and that as many as 22.5 percent of children in the state are poor. These numbers are an improvement over the year before, and are the first sign of a turnaround since the beginning of the Great Recession. But poverty rates today are 50 percent higher than they were five decades ago, when the War on Poverty began. Do today’s high rates of poverty mean that public investments aimed at mitigating poverty have not had their intended effect?

Unfortunately, official poverty statistics don’t give us the information we need to answer this question. The official poverty measure is based on a very simple formula developed in the 1960s. This formula has a number of shortcomings. First, it does not account for many of safety net programs—so it entirely misses the poverty-reducing effect of SNAP (food stamps) and the EITC (Earned Income Tax Credit), for example. Second, the formula has not kept up with sweeping changes in the cost of living since the 1960s. It does not reflect the increase or variation in housing costs across different places. And it doesn’t account for the fact that many families face different sorts of expenses than they did in the 1960s—like higher medical out of pocket expenses and child care costs.

These shortcomings prompted a national effort to develop alternative measures of poverty, which began to coalesce in the 1990s. In 2011, this effort produced the Census Bureau’s Supplemental Poverty Measure, which provides detailed new estimates of poverty for the U.S. In 2013, a collaborative effort between PPIC and Stanford Center on Poverty and Inequality produced the California Poverty Measure, which provides similar detail for California. Both measures use the same underlying methodology to address the shortcomings I just described in the official poverty statistics. And I’d like to note that the creators of both measures are engaged in ongoing efforts to refine and improve the methodology, and for that reason—among others—their measures do not replace the official statistics but supplement them (hence the name of the Census measure).

Both the California Poverty Measure and Census’s Supplemental Measure account for the resources that families actually have to meet very basic needs and the actual costs of doing so. The California Poverty Measure finds that more Californians are poor than we thought, as of 2011. The California Poverty Measure estimate of 22 percent (or 8 million people) is higher than the official rate of 16.2 percent—this translates to an additional 2 million people in poverty. More people of all ages are poor under this new, better measure. Of particular interest is the child poverty rate, which is 25 percent, or 2 points higher in our measure. In other words, a quarter—or more than 2 million—of our children are poor.

These higher poverty rates stem from a combination of factors. Most important, the California Poverty Measure uses higher thresholds than the official poverty measure does—that is, a higher poverty line. This is because housing costs for the vast majority of Californians are significantly higher than what the federal poverty line accounts for. On average, a single parent with two kids needs $24,600 to be considered out of poverty and a four-person family needs $29,000 to be considered out of poverty under the California Poverty Measure. That’s about $6,000 above the federal poverty line, and about $4,000 more than a similar family would need to be above poverty level in other states under the Census Supplemental Measure. These higher costs of living explain in large part why California’s Supplemental Poverty Rate is higher than that of any other state in the country.

Cost of living differences also change the narrative about how poverty varies within California. As you can see from the map I’ve provided, in many ways our measure flips the official measure’s picture of poverty. The California Poverty Measure finds that coastal areas—where housing costs are generally higher—have among the highest poverty rates in the state, much higher than the official estimates. Our measure places inland areas like the Central Valley, where official poverty rates are typically the highest, in the middle to low range statewide. In some counties with relatively low costs of living, the California Poverty Measure estimates are lower than official poverty rates. In these areas, safety net benefits to low-income families more than offset the cost of living, driving down poverty rates. But the vast majority of Californians live in higher-cost counties, where safety net resources, despite playing an important role in family budgets, are not large enough to offset high costs of living.

The California Poverty Measure allows us to look closely at the role safety net programs play in mitigating poverty. And our research suggests that this role is powerful—especially for children. We find that without CalWORKs benefits the child poverty rate jumps 2.5 points—equivalent to about a quarter million more children in poverty. Similarly, without CalFresh benefits, the child poverty rate would jump 4 points—that is an additional 375,000 children. Of course, many families use both of these programs, as well as others that we’ve accounted for—including housing subsidies, SSI, school meals, and the EITC/CTC. When we look at the combined effect of all of these need-based safety net programs, we find that without them a stunningly high 39 percent—or 3.6 million—of California’s children would be poor. That is, the child poverty rate would jump nearly 14 points. This shows that low-income and poor families are making use of the social safety net and that it has a substantial effect on their poverty status.

These poverty-reducing effects could be even larger if changes were made to the safety net. For example, the USDA estimates that slightly more than half of eligible Californians participate in CalFresh—this is one of the lowest statewide participation rates in the nation. Participation also varies across California’s counties. This begs the question of how much lower poverty rates would be—would they still be the highest in the country?—if participation rates were higher. As this example shows, housing costs are not the only area in which California stands out. And, while policy clearly plays an important role in offsetting the higher cost of living in California (it more than offsets cost of living in families with children), it has the potential to move the needle on poverty even further.

As it stands, our estimates suggest that the safety net kept nearly 1.3 million children out of poverty in 2011. This matters a lot because research increasingly links poverty to adverse outcomes in many arenas—nutrition, health, education, even brain development—in addition to long-term economic opportunity and mobility. It’s my hope that our research can be used to inform the important decisions you make on policies that address family economic need and its consequences. Thank you for your time.


Chart source: The California Poverty Measure: A New Look at the Social Safety Net.

Drought Watch: Saving the Fish

This is part of a continuing series on the impact of the drought.

In a recent California WaterBlog post, Peter Moyle of the University of California, Davis—a frequent collaborator on PPIC projects—highlights an issue not much discussed in the context of this drought: we ignore fish and wildlife at our peril. California is home to 122 different species of native fishes, including 32 kinds of salmon and trout. These fishes are part of the unique natural heritage of California and, as Moyle points out, most are on a trajectory toward extinction. A poorly managed drought can hasten this process.

State and federal laws that protect endangered species reflect the high value society places on native biodiversity. The sweeping Delta Reform Act of 2009, passed by bipartisan majorities, went a step further, placing ecosystem health on par with water supply reliability. Above all, history shows that failure to manage fish and wildlife well during a drought can have very expensive long-term consequences for water management once the rains return.

So what, if anything, is being done for fish in this drought?

The short answer is “not much.” Most discussion at both the state and federal levels has focused not on whether to relax environmental standards, but on how much to relax them. In the coming weeks many petitions will be filed with the State Water Resources Control Board for exemptions from water quality and flow standards. The board has already exempted the Central Valley Project and the State Water Project from meeting flow standards for the Sacramento–San Joaquin Delta, which is home to many endangered fishes, including salmon and steelhead. The emergency drought legislation making its way through the state legislature includes significant sums to provide relief to communities hard hit by the drought, but very little to help reduce stress on the environment. On the federal level, the legislation pending in the House would reduce protections for the environment, while the Senate bill—introduced by California’s two U.S. senators—offers little to improve conditions for fish.

Moyle points out that although native fishes adapt well to drought, they are hampered by the many modifications we have made to our rivers, the way we manage water, and our policies regarding fish harvests and hatcheries. He offers some well-known prescriptions for drought management and some novel ideas, including trucking fish to cool water sources and establishing fish triage panels with the authority to allocate water to keep fish alive through a drought. Equally important, his post reminds us that the actions that help the environment most during a drought are those taken long before the drought begins.