Is Momentum Growing to End California’s Death Penalty?

On March 13, Governor Newsom signed an executive order placing a moratorium on the death penalty for the 737 inmates on death row in California’s prisons. The order suspends executions for the remainder of Newsom’s administration but does not allow for the release of any inmates or alter any convictions or sentences. California joins Colorado, Pennsylvania, and Oregon as the only states where governors have taken executive action to halt the legal use of the death penalty.

Permanently abolishing California’s death penalty would require voter approval. When this question was on the ballot in 2012 and 2016, a slight majority of Californians (52% in 2012 and 53% percent in 2016) voted to uphold the death penalty as the maximum punishment for those found guilty of first-degree murder.

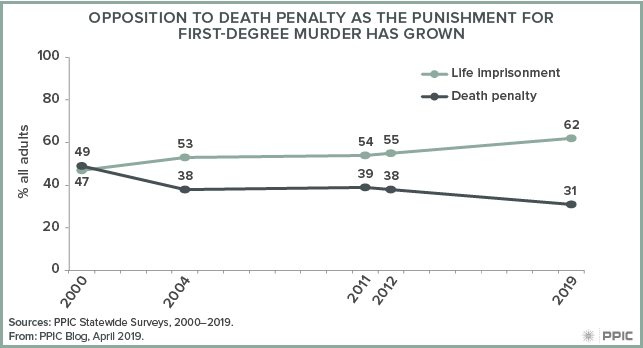
How do Californians view the death penalty today? In our March PPIC survey, a record-high 62% of adults (58% likely voters) prefer life imprisonment with no possibility of parole as the penalty for first-degree murder, compared to 31% of adults (38% likely voters) who prefer the death penalty. The preference for life imprisonment has grown steadily since January 2000, when opinions were divided among Californians (49% death penalty, 47% life imprisonment).

figure - Opposition to Death Penalty as the Punishment for First-Degree Murder Has Grown

The issue is highly partisan: three in four Democrats (76%) and more than half of independents (56%) favor life imprisonment over the death penalty, compared to only one in three Republicans (32%). Since September 2012, when we last asked this question, support for life imprisonment has risen substantially among Democrats (up 9 points) and independents (up 11 points)—but stayed about the same for Republicans (down 1 point).

The preference for life imprisonment has climbed across nearly all age, education, income, and racial/ethnic groups—with the exception of African Americans and Latinos. African Americans are now less likely to favor life imprisonment (67% today versus 75% in 2012), though their support is still high. Among Latinos, 69% prefer life imprisonment, same as in 2012. In contrast, Asian Americans are now much more likely to support life imprisonment (66% today versus 50% in 2012), as are whites (54% today versus 45% in 2012).

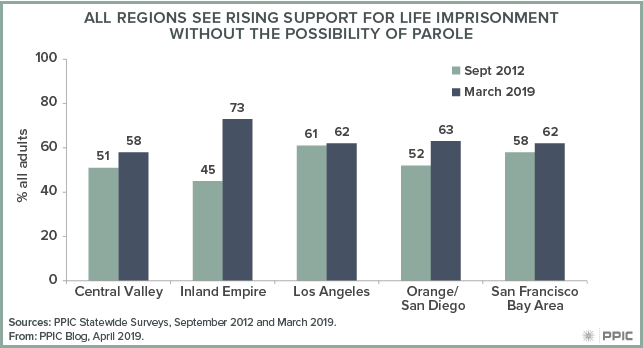
Support has also grown in all major regions of the state, with particularly large shifts in the Inland Empire and Orange/San Diego Counties. In the Inland Empire, 73% of residents favor life imprisonment, up 28 points since 2012. In Orange/San Diego Counties, 63% prefer life imprisonment, up 11 points since 2012.

figure - All Regions See Rising Support for Life Imprisonment Without the Possibility of Parole

Following the governor’s executive order, Assemblymember Marc Levine introduced a constitutional amendment that would abolish the death penalty in California. If approved by a two-thirds vote in the legislature, it will appear before voters on the 2020 ballot. Stay tuned as we continue to monitor Californians’ perceptions and policy preferences on this issue.

Video: State and Federal Experts Discuss San Joaquin Valley’s Water Future

How can state and federal agencies help California’s largest agricultural region address its difficult water management problems? This was the theme of an event last week that brought together PPIC experts with top officials working on issues related to water, agriculture, and natural resources.

Ellen Hanak, director of the PPIC Water Policy Center, launched the event by summarizing findings from a new report on the valley’s water- and land-management challenges and outlining some strategies for addressing them.

Groundwater overdraft is the valley’s key water challenge. A state mandate to bring groundwater use to sustainable levels will have broad effects on valley agriculture and the regional economy—most likely including some permanent idling of farmland to balance water budgets. Hanak noted that only about a quarter of the valley’s groundwater deficit can be filled with new supplies at prices farmers can afford.

According to Hanak, the most promising solutions fall into three buckets: “Ways to increase flexibility in how we manage water and related land resources; ways to provide incentives so that growers, who are some of the key decision makers on the ground, can do this so it makes business sense to them; and ways to stack benefits so you get more than one thing out of it—maybe you get groundwater recharge and wetland habitat, for example.”

The three panelists—Wade Crowfoot of the California Natural Resources Agency, Karen Ross of the California Department of Food and Agriculture, and Thomas Hedt of the Natural Resources Conservation Service’s California office―discussed key issues and ways their agencies can partner with local stakeholders to ease the process of replenishing groundwater in coming years.

Crowfoot highlighted the importance of working with local communities, governments, and water agencies to address water challenges. “State government doesn’t actually have the solutions. We have the resources and the power of making new laws, but the solutions that are going to help limit disruption as it relates to water are going to be found on the ground,” he said. “The question is what can we do at the state level to empower the locals to find those solutions.”

Ross said multi-benefit approaches will be critically important, particularly for reaping environmental benefits when land is fallowed. “New partnerships and unusual allies” are key to achieving such benefits and finding durable solutions, she noted.

For example, she added, “the environmental justice community and agriculture community continue to partner to find drinking water solutions”—a process that “also bodes well for what we can do on the land.”

Hedt described new federal pilot projects to improve wildlife habitat and promote groundwater recharge. He noted that a key federal farm program has been made more flexible to allow broader partnerships that can enable habitat conservation on farmlands and address other challenges more efficiently.

We invite you watch the video from the event.

This was the second public event about this research; the first was held in Fresno in February.

Video: Californians and Their Government

Californians are increasingly concerned about the cost of housing—a record-high share see affordability as a big problem in their region, and a majority support Governor Newsom’s proposal to put $1.8 billion toward increasing housing production. Dean Bonner outlined these and other key findings of the latest PPIC Statewide Survey at a Sacramento briefing last week.

This month’s survey gauges views on statewide challenges and the governor’s proposals for addressing them. For example, in the wake of last year’s historically destructive wildfires, an overwhelming majority of Californians support the governor’s plan to spend $415 million on wildfire preparedness and forest management. About two-thirds say the gap between rich and poor is widening in their part of the state, and a solid majority favor the governor’s proposal to allocate a billion to expand eligibility for the earned income tax credit.

Other survey highlights:

  • Slim majorities support the governor’s plan to scale back two major infrastructure projects: high-speed rail and the Sacramento–San Joaquin tunnels.
  • When asked whether the penalty for first-degree murder should be death or imprisonment for life with no chance of parole, a record-high 62% of Californians choose life imprisonment.
  • An overwhelming majority oppose President Trump’s declaration of a national emergency over the border wall—but support for the declaration is much higher among Republicans.
  • A majority of residents have a favorable view of the Affordable Care Act and most say that Covered California, the state’s health insurance exchange, has been working well.

A Closer Look at Women’s Arrest Rates

Historically, men have been arrested at much higher rates than women in California. However, a recent PPIC report found that while arrest rates declined for both men and women, they dropped significantly more for men than for women (57% and 13%, respectively) between 1980 and 2016. A closer look at gender breakdowns underscores some differences in arrest offenses of men and women—and suggests that they may be differently affected by criminal justice reforms.

Women are still arrested at significantly lower rates than men (1,603 arrests per 100,000 female residents in 2016, compared to 5,270 arrests per 100,000 male residents), but they now represent a larger share of total arrests statewide than they did in 1980, up from about 13% to almost 24%. A closer look reveals they also tend to be arrested for different types of offenses. Relative to their overall share of arrests, women represented a disproportionate share of arrests for property offenses (32%), compared to 23% of arrests for violent offenses and 22% for drug offenses. In stark contrast, women only make up about 7% of felony weapons arrests.

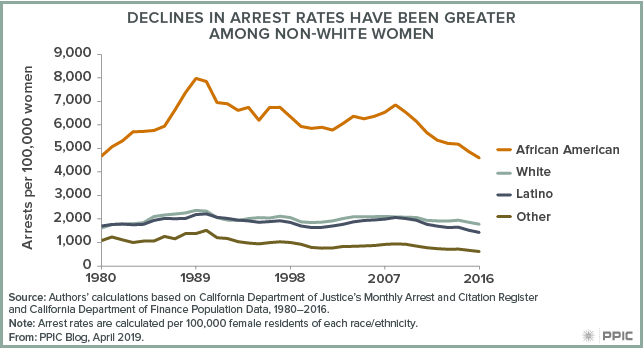
A look at trends in female arrest rates by race/ethnicity shows a decline for women of all races, with greater declines among non-white women. Between 1989—when overall arrest rates peaked—and 2016, arrest rates fell more dramatically for men than for women across all races/ethnicities, but the size of the gender gap varied:

  • Arrest rates for white women fell 25%, while arrest rates for white men fell 55%.
  • Arrest rates among Latino women declined by 35%, while rates for Latino men fell 68%.
  • Rates for African American women fell 42%, while rates for African American men fell 58%.

figure - Declines in Arrest Rates Have Been Greater Among Non-white Women

These differing trends are mostly driven by misdemeanor arrest rates, which have declined much more dramatically among men than among women. In 1980, women represented 14% of misdemeanor arrests, but in 2016 this share jumped to 25%, in part due to an increase in female arrest rates for misdemeanor assault and battery offenses. The female share of felony arrests also increased, up from roughly 12% in 1980 to almost 20% in 2016.

While many factors likely contribute to these trends, California’s criminal justice reforms—which have largely focused on property and drug offenses—are likely to have played a role, with different effects on arrests of men and women. Not surprisingly, given gender differences in arrest offenses, the data supports this. For instance, after Proposition 47 reclassified several drug and property offenses from felonies to misdemeanors in November 2014, the female arrest rate for drug offenses declined by 14% and the rate for property offenses fell by 22%, compared to 7% and 10% declines among men. Policymakers would do well to monitor arrest rates for men and women and keep them in mind when considering the impact of criminal justice reforms.

Testimony: Upgrading California’s Water Grid to Meet 21st Century Needs

Ellen Hanak, director of the PPIC Water Policy Center, testified today (April 2, 2019) before the House Subcommittee on Water, Oceans, and Wildlife, at a hearing on the state of western water infrastructure and innovation. Here are her prepared remarks.

Most western states rely on water “grids”—networks of above- and below-ground water storage and conveyance systems—to manage their water supplies. California’s water grid is unusually extensive and connects most water use in the state. It is also complex, with different elements owned and managed by a wide array of local, state, and federal entities.

California’s water grid provides numerous services: it stores water, reduces flood risk, generates electricity, helps maintain downstream ecosystems, and provides recreation. But various factors are putting stress on this system. As the 2017 Oroville Dam crisis showed, the state’s above-ground infrastructure is aging—much of it is more than 50 years old. And in many areas, groundwater basins are being depleted, making wells go dry, raising pumping costs, harming ecosystems, and causing lands to sink and damage vital infrastructure. The changing climate is compounding these pressures.
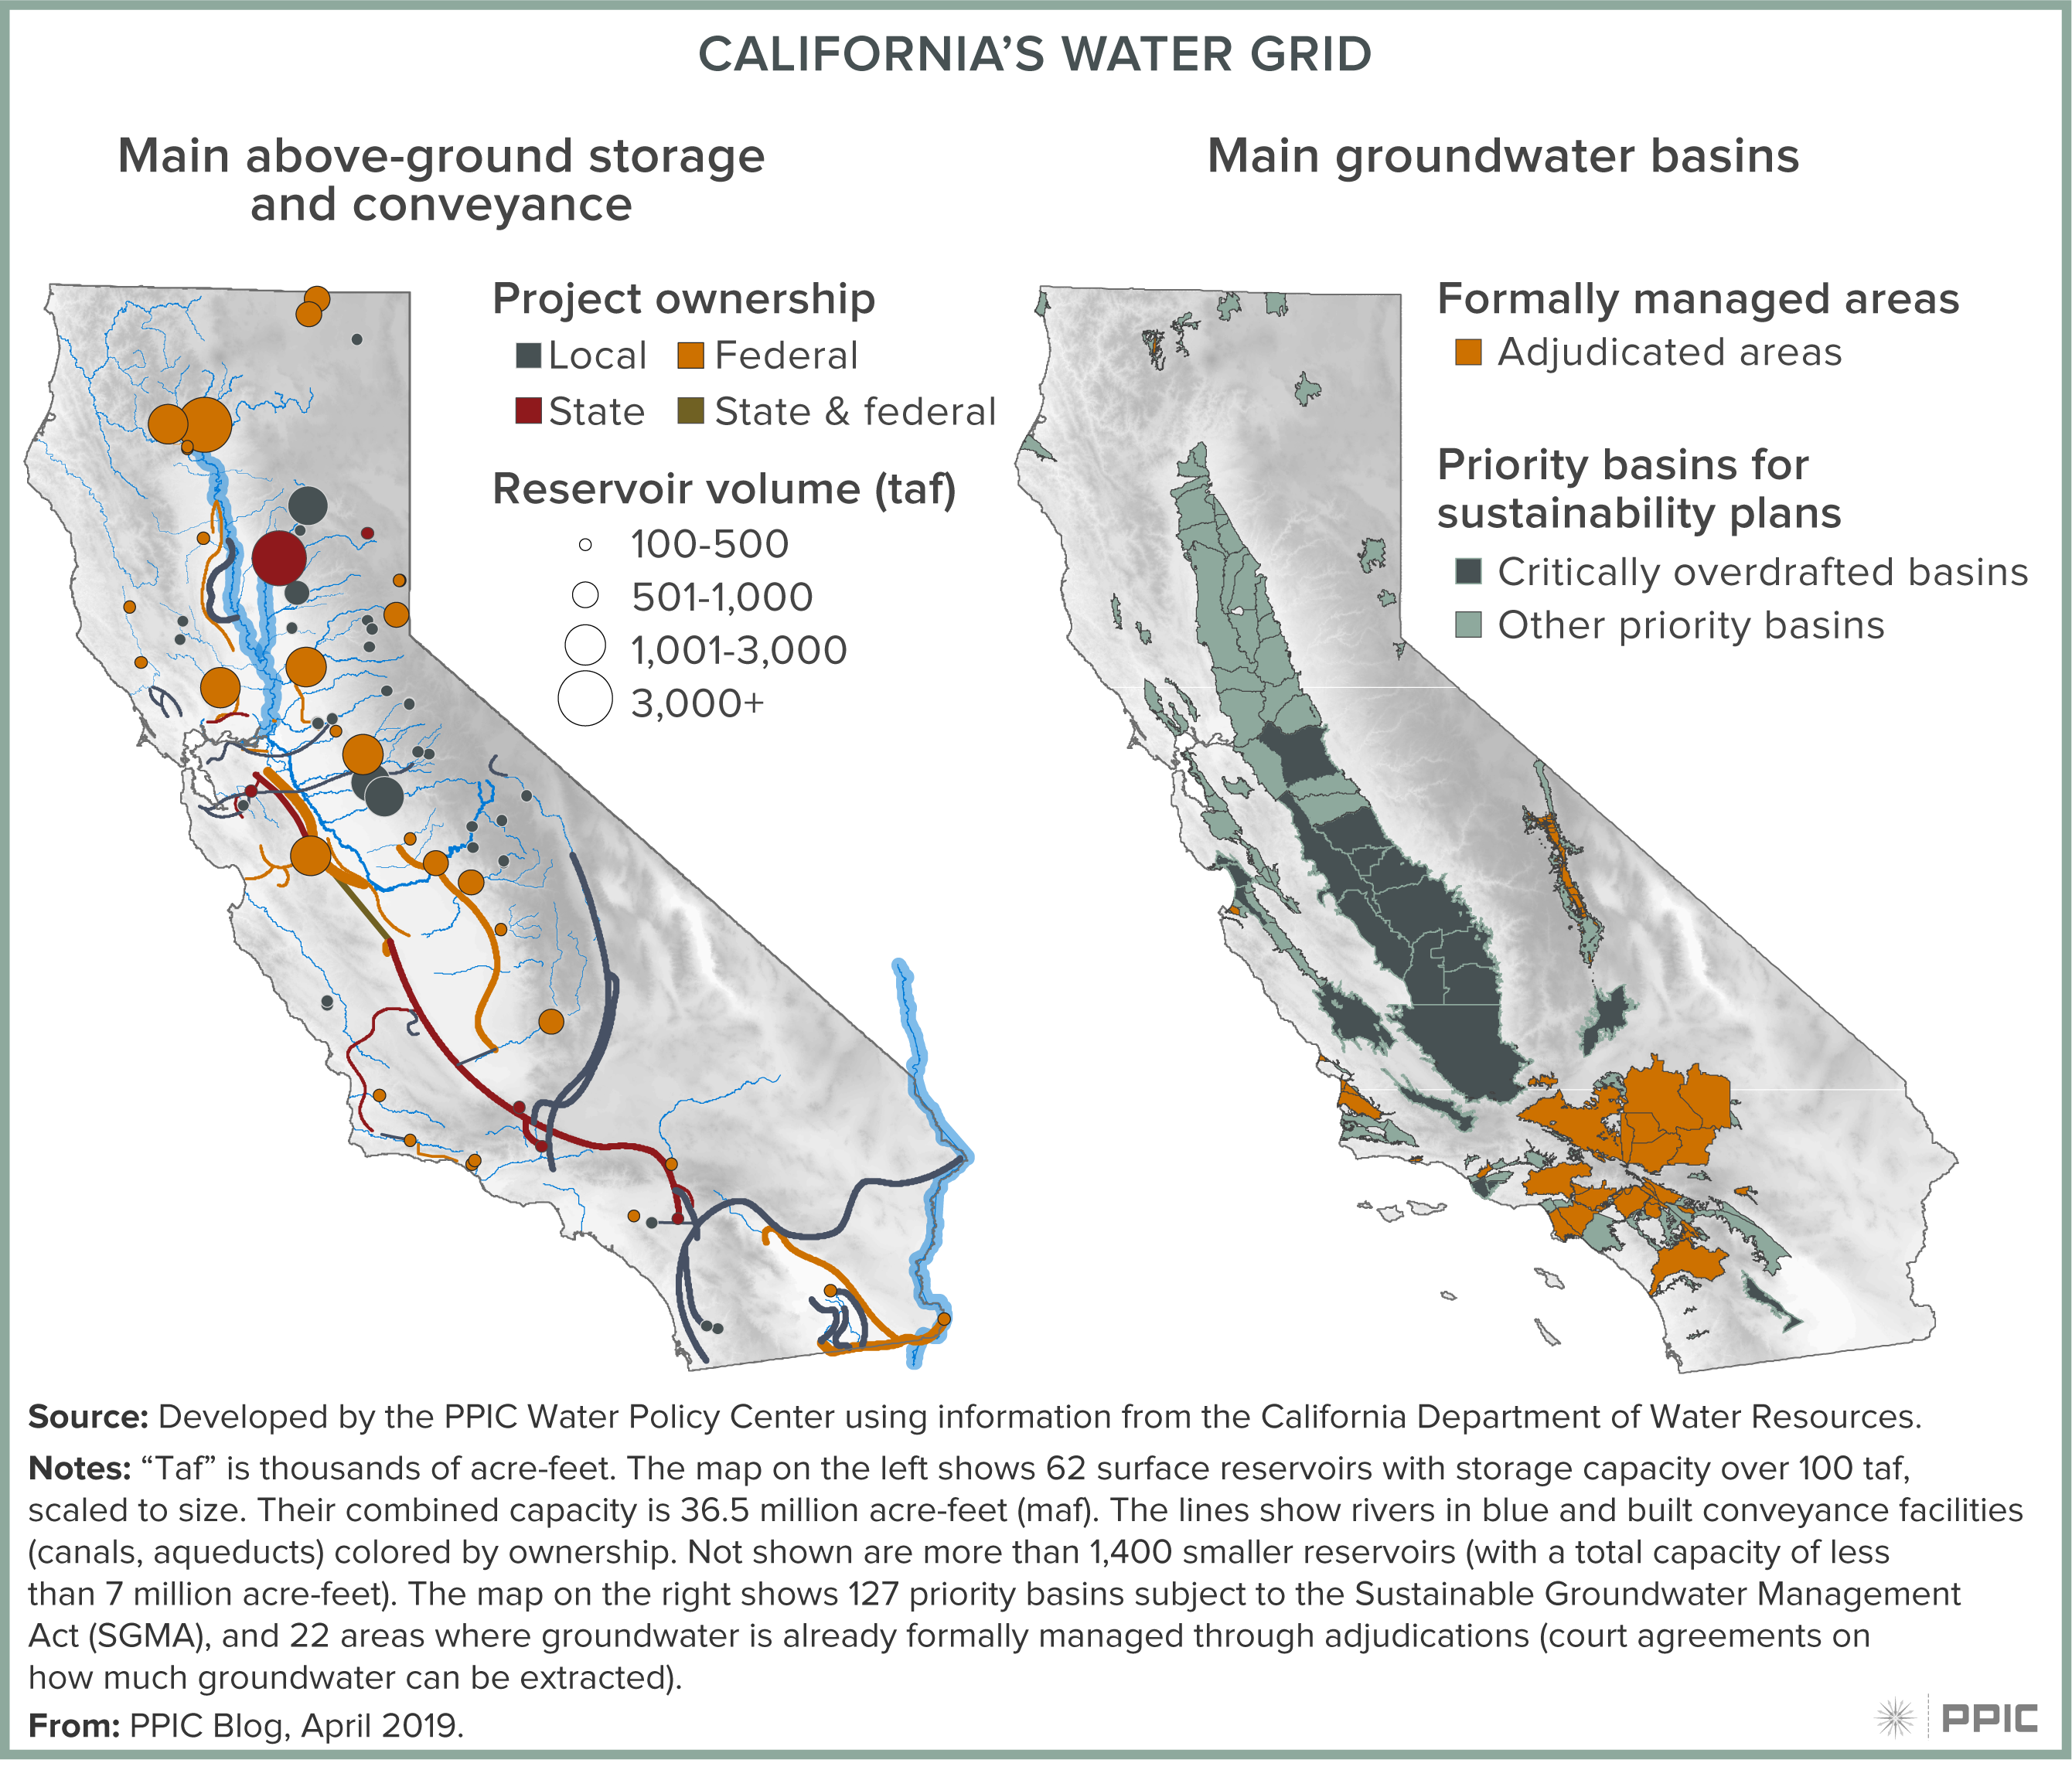
figure - California's Water Grid

The PPIC Water Policy Center put together a team of experts in climate science, hydrology, ecology, engineering, economics, and law to review the weak points in California’s water system and recommend actions to build the system’s climate resilience. Our 2018 report Managing Drought in a Changing Climate found that five climate pressures—warming temperatures, shrinking snowpack, shorter and more intense wet seasons, more frequent extreme wet and dry years, and rising seas—will greatly challenge water management in coming decades.

Indeed, many of these effects are already occurring. Warmer, more intense droughts—such as the one California experienced from 2012–16—increase pressures to draw down groundwater reserves. Warmer, more intense storms add stress to surface reservoirs, making it harder to meet sometimes competing objectives of supplying water and protecting people and property from harmful floods.

California’s water grid is not prepared to handle these mounting pressures. Yet it is also the state’s most valuable asset for adapting to the changes in store. What’s needed is a more robust, better-integrated water grid. This will require investments to modernize not only the infrastructure, but also the way the system is managed. Here are some top priorities:

  • Enhancing groundwater storage. Groundwater is a vital drought reserve, and many California basins have considerable potential to affordably store more water. But the lack of active management—including tracking groundwater use—has been an obstacle to these investments. One very positive outcome of the latest drought was the enactment in 2014 of the Sustainable Groundwater Management Act, which requires local water users to develop and implement sustainability plans. The first plans are due in early 2020, and many will focus on new recharge efforts. In addition to expanding dedicated recharge ponds, some farmers and irrigation districts are experimenting with new methods, such as flooding suitable cropland during the winter months.
  • Repairing and upgrading dams, canals, and aqueducts. Addressing infrastructure weaknesses and gaps is essential for both flood protection and water supply. Expanding conveyance capacity will be key for getting water from winter and spring storms to where it’s needed for replenishing groundwater storage. This can also facilitate water trading—an important way to increase the flexibility of water supply and reduce the costs of water scarcity during droughts.
  • Rethinking infrastructure operations. California will be able to store more water if it manages surface and groundwater as a system to increase their combined potential. For instance, moving more water out of surface reservoirs and into aquifers in the fall can free up room in reservoirs to capture winter and spring storms. As another example, promising efforts are underway in some watersheds—including the Russian River, the American River, and the Santa Ana River—to update dam operations using advanced weather forecasting technology. More accurate forecasts can help managers decide whether they need to release water to protect downstream areas from flooding, transfer water to groundwater basins, or keep water in storage for later use.

There are many ways the federal government can help update the grid to meet 21st century needs in California and throughout the West. Here are a few priorities:

  • Assessing and improving system capacity. As owners and operators of major surface water infrastructure, federal agencies—especially the US Bureau of Reclamation and the Army Corps of Engineers—will be essential partners in assessing system capacity issues and the potential for new investments and operational changes to improve the grid’s performance and resilience.
  • Providing essential data. A variety of federal agencies—including the US Geological Survey and the National Oceanic and Atmospheric Administration—are key providers of data needed to better manage the grid under changing conditions. This includes essential metrics such as stream flows, weather forecasts, groundwater models, and space-based imagery to measure water use. These agencies also provide crucial biological data to help manage the grid sustainably. Some of these efforts have faced budget cuts in recent years, dampening their usefulness.
  • Supporting groundwater reform. To date, the federal government has been less engaged on the key issue of groundwater management—an underappreciated part of the grid whose importance will grow as the climate warms and water stored in the mountain snowpack diminishes. California is in the midst of a major, locally driven groundwater reform that will provide valuable lessons for improving the management of this vital resource across the western US and beyond. As owner and operator of the Central Valley Project, the US Bureau of Reclamation can support this effort by making it easier for its local water customers and others to recharge groundwater in suitable areas. As the regulator and manager of flood control systems throughout California, the Army Corps of Engineers can help local flood control agencies capture storm runoff and increase groundwater recharge. And as a major source of funding and technical assistance to farmers, USDA’s Natural Resource Conservation Service could help spur innovation by recognizing groundwater depletion as a resource concern, making it eligible for support.

California, like all western states, is facing major water management challenges as the climate warms and population grows. Weather extremes over the past decade have given us a glimpse of what the future holds. The best way to adapt to these changes is to modernize water grids. The federal government has been an essential partner in developing and operating these grids for more than 100 years. Given the challenges ahead, it is time to modernize this partnership, not just the grid itself.  This includes integrating federal support, operations, and technical expertise into all phases of water management, particularly groundwater.  From our many conversations here at PPIC with state and local water managers, California appears ready for an improved state-federal partnership.  I encourage members of this subcommittee to engage in finding ways to help modernize this relationship.

Video: Preparing California for Census 2020

Is California ready for the 2020 Census? PPIC convened a group of experts last week for a progress report on preparations for the decennial population count, which begins next April 1. PPIC president Mark Baldassare started off by asking California secretary of state Alex Padilla to outline what is at stake.

Padilla offered a “quick civics lesson,” explaining that the census helps determine the amount of federal funding that goes to each state, as well as each state’s overall number of congressional seats and its configuration of legislative districts. If there’s an undercount in California, the state could lose billions of dollars over the next decade.

Are we ready? “Not yet,” Padilla answered. But he added that California is “a little ahead of the curve,” with the highest level of state investment in outreach and preparation in the nation. In addition to longstanding challenges—for example, California has 30% of the recognized “hard to count” communities nationwide—the state faces some new issues, such as inadequate federal funding, cybersecurity issues, a rule that bars legal permanent residents from working as canvassers, and the possible inclusion of a question about citizenship.

How is the state preparing? Marc Berman, a state assemblymember and chair of the Assembly Select Committee on the Census, outlined three major areas of focus: adequate funding, coordination of efforts, and collaboration by state and local government as well as community-based, philanthropic, and business organizations. “We are better prepared than we ever have been before,” he added.

Ditas Katague, director of California Complete Count, offered a wealth of detail on the progress her office has made—opening five field offices, dividing the state into ten regions based on hard-to-count populations, and working with community groups and media in these regions.

Non-governmental groups are playing a key role. Melina Sanchez, the program officer for civic participation initiatives at the James Irvine Foundation, outlined the two overarching goals of a recently convened statewide philanthropic roundtable: to help California reach its hardest-to-count populations and to use the census as a movement-building opportunity for historically underrepresented groups. For Sanchez, it is important to “flip the narrative” so that it’s not about people’s fear of participating in the census but is instead a story about “folks feeling the empowerment of standing up despite all the barriers.”

Sarah Bohn, PPIC’s director of research, highlighted the need to counteract widespread mistrust of government, concerns about privacy and misuse of data, and mistaken ideas about the purpose of the census. A key way to motivate most people, she added, is to make sure they know that their community benefits from an accurate count: “Understanding the funding that goes to your community . . . really seems to encourage participation.”

What would a successful census look like? Katague summed it up: “No undercount, no loss of a congressional seat, no disinformation snafus”—and, on the positive side, increased civic engagement.

Helping Community College Students Succeed

California’s community colleges are implementing new policies in developmental (or remedial) education that could improve completion of transfer-level courses for tens of thousands of students every year. Recently passed legislation should result in the vast majority of entering community college students bypassing developmental education and enrolling directly into transfer-level courses in English and math. Many of these students will be provided with concurrent remedial support to help them succeed—namely, co-requisite courses, which feature group work to reinforce difficult concepts, just-in-time remediation, and other activities.

These reforms mark a dramatic change from the traditional approach, which required most students to complete developmental English and math before they could take transfer-level courses. In fact, as of the 2017–18 academic year only half of students enrolling in an English course for the first time and about one-third of first-time math students were able enroll in a transfer-level course. Previous PPIC research shows that students who start college in developmental education are significantly less likely to successfully complete transfer-level courses.

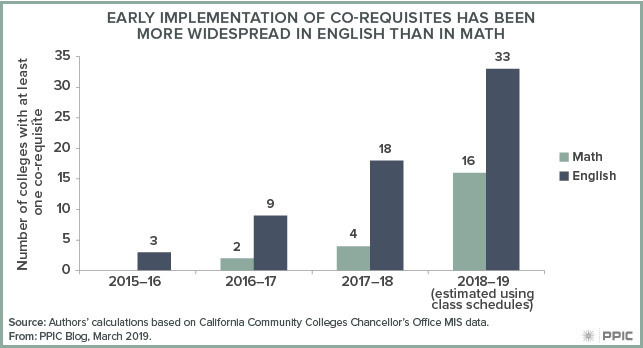
The new policies will be implemented systemwide by fall of 2019, but some colleges began offering co-requisite courses ahead of schedule—as early as 2015–16. Implementation has been faster in English than math: as of 2017–18, 33 of the state’s 115 community colleges were offering English co-requisites, while only 16 offered math co-requisites. This is not surprising, considering that co-requisite support in math must be tailored to the transfer-level courses required for different majors (e.g., statistics, business calculus, pre-calculus, college algebra, math for liberal arts). Between 2016–17 and 2017–18, enrollment in English co-requisites more than doubled (to 8,200), while enrollment in math co-requisites increased 36% (to 1,300).

figure - Early Implementation of Co-requisites Has Been More Widespread in English than in Math

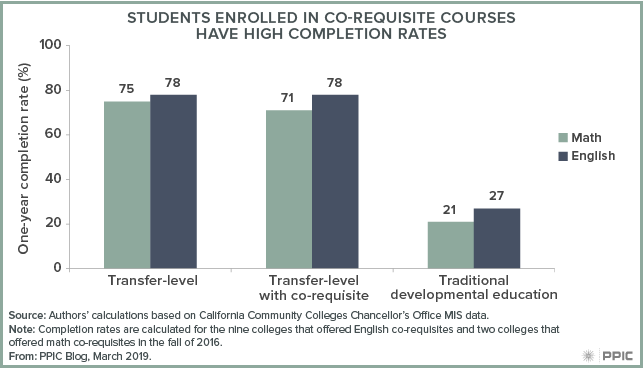
A recent PPIC report found that students enrolled in co-requisite courses are significantly more likely to successfully complete transfer-level courses in math and English than students who started in traditional prerequisite developmental education courses. And they are as likely as those who do not receive co-requisite support to complete transfer-level courses within a year. This is notable because students who take transfer-level courses without co-requisites have been identified as college ready.

figure - Students Enrolled in Co-requisite Courses Have High Completion Rates

The early evidence on co-requisites is promising. As colleges move into the full implementation phase, ongoing research can help them understand what happens as they broaden access to transfer-level courses to a diverse group of students, what types of concurrent support work best, and how co-requisite students perform in subsequent college-level courses.

Testimony: Special Education Finance in California

Paul Warren, research associate at PPIC, testified today (March 28, 2019) before the Senate Education Budget Subcommittee, as part of a hearing on district financial conditions. Here are his prepared remarks.

The committee asked PPIC to help them understand why district special education costs are rising so quickly.

First, some background. The AB 602 formula provides about $500–600 in state special education funds per student in each district, based on average daily attendance (ADA). The number of students with disabilities in a district does not affect state funding amounts. Each year, that amount is increased by the change in ADA and by a cost-of-living adjustment.

In the PPIC report, Special Education Finance in California, my colleagues and I identified several reasons why AB 602 funding has not kept pace with district costs:

  • Changes in the rate and type of disabilities. We estimated that these changes increased annual district costs by around $1.1 billion. The state formula is currently based on average district costs from the late 1990s.
    • The share of students identified with disabilities increased by 5.7 percent from 2010–11 to 2015–16.
    • Disabilities that are, on average, expensive to address have increased. Autism, in particular, continues to increase as a share of students with disabilities.
  • Growth in preschool for children with disabilities under the age of 5. This population grew about 10 percent from 2005 to 2015. The AB 602 formula does not adjust district funding for changes in this group, as pre-school children with disabilities do not count toward ADA.
  • Higher district salaries since the Great Recession. The large LCFF increases during the economic recovery shaped salary negotiations. But AB 602 did not adjust to the higher costs for special education teachers and administrators.

In a report from last year, Revisiting Finance and Governance Issues in Special Education, we provide two options for modifying the AB 602 formula:

  • Increase AB 602 by the same percentage amount as LCFF funding. This makes sure that state funding for special education increases at the same rate as LCFF.
  • Increase AB 602 by the actual increase in special education costs. This would hold the state share of special education costs constant over time.

We also recommend caution when considering proposals to base state special education funding on counts of students with disabilities. Differences in district identification practices affect the share of students identified for special education services. We found that the county with the lowest rate of students with disabilities reported that about 8.8 percent of students were in special education. In contrast, the county with the highest rate reported that about 17.6 percent of students were in the program. This disparity strongly suggests that district practices affect district caseloads, and basing state funding on the number of students with disabilities could create financial incentives to identify more students.

Our two options would avoid this identification problem while better aligning state funding for special education with LCFF and district costs.

Thank you for the opportunity to discuss these important issues.

Can Pretrial Decisions Be Improved?

Controversy over the cash bail system in California has led to a number of recent legal and legislative actions that may spell the end of cash bail in the state. If that happens, risk assessment systems would take on heightened importance in decisions about pretrial detention. At stake are concerns about equity, consistency, and transparency in the pretrial process.

Californians who have been arrested but not yet convicted are 84% more likely to be detained than defendants in other states. California’s high bail amounts contribute to this high rate. Of the defendants who are released on bail, nearly all secure their release via bail bondsmen, who require a nonrefundable deposit equal to 10% of the bail amount. The average bail amount in California in 2015 was $50,000—five times higher than the national average. Many poor and middle class individuals lack the means to secure pretrial release through bail—one study found that 40% of Americans do not even have $400 on hand to cope with an emergency.

State and federal courts have begun to address this inequity. Last year, a state appellate court ruled that defendants should not be held before trial solely because they cannot afford bail. More recently, a federal judge ruled against San Francisco’s use of bail schedules, which set bail amounts. The judge found that although bail schedules seem scientific and transparent, bail amounts are set inconsistently, their origins are unclear, and they do little to ensure public safety.

Additionally, judges can override recommended bail amounts based on their assessment of a defendant’s likelihood of misconduct—arrest or failure to appear in court—if he or she is released during the pretrial period. And they can do so without reporting why. The result has been inconsistency in pretrial detention decisions for defendants who committed similar crimes.

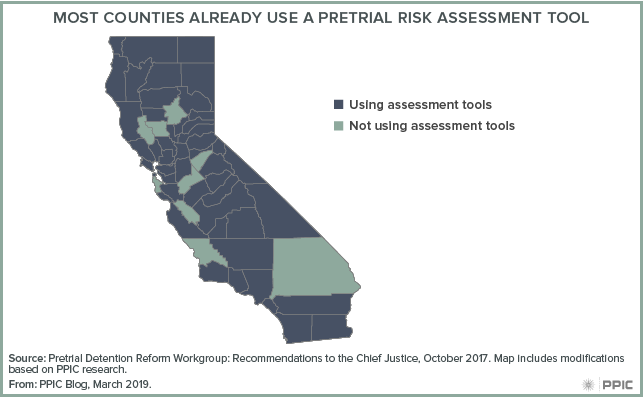
Concerns about inconsistency and lack of transparency motivated the recent passage of Senate Bill 10, which eliminates cash bail and mandates the use of risk assessment tools. These tools use mathematical models to predict pretrial misconduct. Pretrial detention recommendations based on these predictions are supposed to guide judges’ pretrial detention decisions. SB 10 will be subject to a November 2020 referendum—but it’s worth noting that 49 of California’s 58 counties already use some type of risk assessment tool.

figure - Most Counties Already Use a Pretrial Risk Assessment Tool

Risk assessment tools are not without controversy. They have been challenged as unfair and can only surmount this challenge if they are used within transparent and consistent risk assessment systems. Importantly, judges will still be able to override recommendations from those systems.

To ensure more transparency, it will be critical to collect information about why judges override such recommendations. Only with court data that comprehensively records information used to make pretrial detention decisions can the essential work of ongoing evaluation take place. These evaluations are key to determining how well risk assessment systems protect individuals’ liberty while also ensuring public safety—and how potential sources of unfairness in them can be identified and addressed.

Rising Seas Bring Rising Water Management Challenges

Sea level rise—driven principally by melting continental ice and expansion of the oceans as they warm—is a significant threat for those living along the coast. Adapting to increases in coastal erosion and flooding—and managing the broad impacts of sea level rise on the state’s water systems—will be expensive and disruptive for millions of Californians.

A recent study by the US Geological Survey took a sobering look at future risks from rising seas. The authors describe how storm surge, very high tides (popularly known as king tides), and large waves during storms can amplify the effects of sea level rise. They simulated coastal erosion and flooding over the next two centuries and found there could be dramatic increases in damages during modest storms, and catastrophic flooding during rare, large storms. These impacts are projected to appear by the middle of the 21st century, at a scale likely to significantly affect the state’s economy.

Beyond costly efforts to protect against coastal erosion and ocean flooding, coastal areas will also need to manage increased inland flooding. Large storms can amplify the effect of rising seas by bringing greater storm surge, particularly if these coincide with king tides. Storm runoff flowing down coastal creeks will meet rising waters caused by storm surge and tides, exacerbating flooding. This issue is particularly acute in parts of the Bay Area (including much of Silicon Valley) and low-lying areas in Southern California. Major new efforts to manage runoff and protect existing homes and businesses will be needed.

Sea level rise will also affect water management in other ways. One area is wastewater treatment. Throughout coastal California and particularly in the San Francisco Bay Area, wastewater and stormwater treatment takes place in facilities that are currently at or near sea level. The Bay Area alone is home to 30 such facilities that are vulnerable to damage by rising seas and storms.

Water supply will also be affected. Many coastal aquifers will see increases in salinity as sea levels rise and storms push saltwater farther inland. But the most significant impact on supply is likely to be associated with changes in the Sacramento‒San Joaquin Delta.

The Delta lies at the head of the San Francisco Bay estuary and the confluence of the Sacramento and San Joaquin Rivers. More than 25 million Californians and 3 million acres of farmland rely on the Delta for a portion of their water supplies. These exports are managed by large state and federal projects that pump water from the southern Delta.

Sea level rise affects the Delta in two ways. First, to keep its waters fresh enough so that cities and farms can use it, a certain amount of fresh water has to flow out of the Delta and into the San Francisco Bay. If the outflow is insufficient—whether due to drought, reduced inflows from upstream water use, or high export pumping—tides push saltwater into the Delta, making its water unusable.

The second way sea level rise will affect the Delta concerns the 1,100 miles of levees that line its channels. Levees hold water back from Delta islands, whose lands are now well below sea level due to sinking soils. Failure of these levees—particularly in the western Delta—can lead to changes in the way tides circulate water in the Delta. These changes amplify the increases in salinity from sea level rise alone; together, they put additional pressure on water supplies.

Addressing the many effects of sea level rise on California water management requires extensive planning and costly investments in infrastructure. The US Geological Survey study shows that these impacts are not in some distant future, but are likely to become significant in just a few decades. The good news is that state and local officials are starting to work on this problem, which will take many years to address.