Voters Favor New Water Bond. What Are They Missing?

One of the most surprising findings in the July PPIC survey is the strong support for an $8.9 billion state water bond among California likely voters (58%). Support for the bond―Proposition 3 on the November ballot―comes close on the heels of California voters passing a $4.1 billion state water and parks bond in June. What’s going on?

Majorities of California likely voters across partisan and demographic groups and the state’s regions say that water supply is a big problem in their part of California. Water supply and drought were the number one environmental problem named by likely voters in the survey (24%). Since Governor Brown took office in 2011, water supply and drought have been among the top environmental issues named by likely voters, and since 2014, together they have been named the most important environmental issue facing the state.

Majorities of likely voters across demographic groups and regions―including most Democrats (72%), nearly half of independents (48%), and four in ten Republicans (43%) and self-described conservatives (46%)―support Proposition 3.

PPIC surveys in the past five years show that support for state water bonds has remained high since the severe drought of 2012–16; voters are anxious about its return in light of other signs of climate change. Since 2014, at least half of California likely voters have said they would vote yes on various state water bonds. Moreover, an earlier PPIC survey found that most likely voters prefer bonds (44%) over fees (25%) and taxes (13%) as the means to fund water infrastructure projects.

What are the voters missing?

State bonds are important, but they actually play a relatively minor role in funding California’s water. Bonds provide at most $1 billion of the more than $30 billion in annual water-related spending. Local revenue—from water and sewer bills to taxes—provides the lion’s share. In addition, bonds are not a reliable long-term funding source, and they generally don’t cover operating and maintenance costs. State bonds don’t directly raise fees or taxes—which may make them more popular with voters than these alternatives. But they are not free. Every year bonds are repaid with significant interest from the state General Fund, which can reduce funding available for other important budget areas, such as education and health and human services.

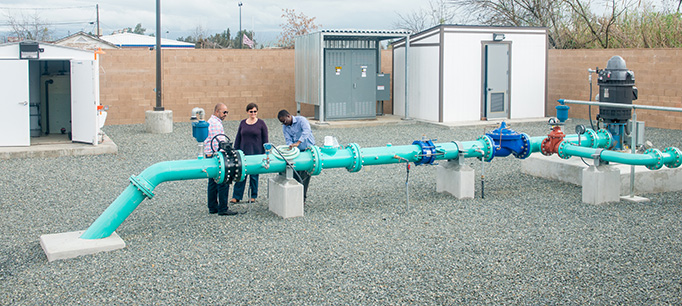
California faces critical water funding gaps—totaling about $2–$3 billion annually—across several essential areas: safe drinking water in small, disadvantaged communities; flood protection; control of stormwater and other polluted runoff; and management of freshwater ecosystems and headwater forests. Limited financial capacity of low-income communities, legal constraints on local funding, a shrinking federal contribution, and unreliable state support contribute to the shortfall. There have been efforts to fill the gaps in other ways—especially for safe drinking water—but new sources of funding such as a surcharge on water bills haven’t enjoyed the same broad support as state bonds.

In California’s $2.7 trillion economy, filling the gaps for water’s “fiscal orphans” should be manageable. But this will require a focused effort and leadership at all levels. Bonds can help, but they can’t do it alone. Looking beyond bonds to find more durable ways to pay for essential water services—including with new fees and taxes―must be a top priority going forward.

Environmental Priorities and the Midterm Election

Just three months ahead of a consequential midterm election, California and the federal government continue to move in very different directions on environmental policy. Last week, the Trump administration’s efforts to roll back strict automobile emission standards were strongly criticized by the Brown administration. State officials have also pushed back on federal efforts to increase offshore oil drilling and the president’s decision to exit the Paris Agreement on climate change. Meanwhile, personal experiences with a prolonged drought and recent severe wildfires are raising Californians’ awareness about the impacts of climate change. Where do California voters stand on environmental issues and what are the implications for November?

Californians’ support for environmental protection runs deep. Consider emissions standards. In the July PPIC survey, 60% of California registered voters say that they are in favor of setting higher emissions standards for automobiles. Majorities of voters across age, education, gender, income, and racial/ethnic groups support this environmental policy. Majorities of Democrats (74%) and independents (62%) and 34% of Republicans are in favor. Notably, 52% of registered voters living in the nine competitive House districts—as rated by the Cook Political Report—favor higher auto emission standards.

Or take another area of state-federal policy conflict over the environment, offshore oil drilling. Sixty-six percent of California registered voters are opposed to more drilling off the California coast. Opposition is high among Democrats (82%) and independents (66%), and reaches 40% among Republicans. Majorities oppose it in both the coastal and inland regions of the state and across age, education, gender, income, and racial/ethnic groups. As for the registered voters living in the nine competitive House districts, 56% are opposed to allowing more offshore drilling off the California coast.

These views on particular environmental policy issues are similar to larger concerns related to global warming. About two in three California registered voters believe that global warming has already begun (67%), say that they are very concerned about its possible impact on more severe wildfires (64%), and favor the state law that requires California to reduce its greenhouse gas emissions (67%). Majorities of Democrats and independents share these views, along with substantial proportions of Republicans and majorities of voters across regions and age, education, gender, income, and racial/ethnic groups. In the nine competitive House districts, majorities of registered voters believe that global warming has already begun (59%), say they are very concerned about the impact of global warming on more severe wildfires (56%), and favor the state law that requires greenhouse gas emission reductions (62%).

Personal views about global warming could shape the size and profile of the electorate this year. Majorities of California voters say that the issue of global warming is extremely or very important to them personally (62%). If this high level of personal concern motivates voter turnout, it will provide a partisan advantage (80% Democrats, 61% independents, 29% Republicans). It could also serve as a catalyst in several Democratic-leaning groups with a low propensity to vote (64% under age 35; 68% earning less than $40,000; 69% renters; 70% Latinos). Moreover, in the nine competitive House districts, majorities of registered voters (55%) say that global warming is extremely or very important to them personally.

In the midterm election context, Californians are indicating strong opinions on environmental matters. A record-high number of registered voters say that the gubernatorial candidates’ positions on the environment are very important in determining their vote (39% 2002, 46% 2006, 42% 2010, 40% 2014, 53% 2018).

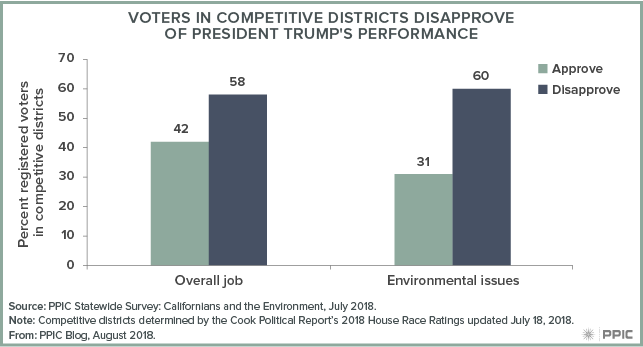
California voters say that they want statewide candidates to push back rather than work with the Trump administration on environmental issues (53% to 40%), and a majority disapprove of the way that President Trump is handling environmental issues (67%). Since the midterm elections are in part a referendum on the president, it is perhaps most significant that a majority of registered voters living in the nine competitive House districts disapprove of President Trump’s handling of environmental issues (60%)—similar to their disapproval of his overall job performance (58%).

Californians’ environmental priorities are high on our list of political wildcards in this important midterm election. Stay tuned as the PPIC Statewide Survey monitors this trend and other topics in our pre-election polling.

Video: 2020 Census: Why Is the Citizenship Question Such a Big Deal?

The decennial census plays an essential role in American democracy. The stakes are huge for California—and 2020 is fast approaching.

In this video, PPIC research fellow Eric McGhee discusses the controversial addition of a citizenship question to the 2020 Census. View more videos in this series.


Four Ways to Foster Cooperation over Groundwater

Last summer, some 250 local groundwater sustainability agencies (GSAs) were formed―the first step in meeting the requirements of California’s historic Sustainable Groundwater Management Act (SGMA).  Now these agencies face the difficult task of developing and implementing plans to bring their groundwater basins into balance over the next 20 years.

A recent event by the Groundwater Resources Association of California explored groundwater governance, and laid out ways that locals will need to cooperate to manage groundwater for long-term sustainability. Here are four key takeaways.

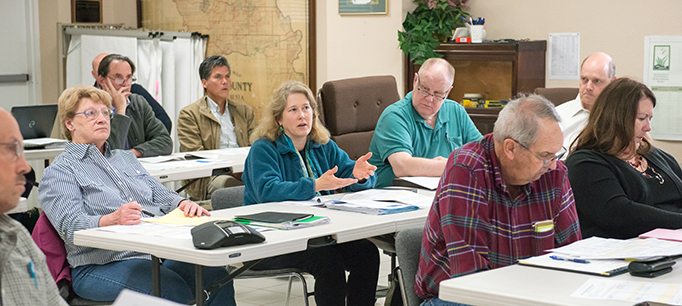
Coordination within GSA boundaries: GSAs must have strong internal cooperation to be effective. Many GSAs are composed of multiple public agencies (water districts, cities, and counties). Those agencies have to set up a new governance structure—agreeing on how to make joint decisions, and deciding how to split up the costs of management. And all GSAs must seek to involve a broad spectrum of stakeholders in the sustainability planning process—for example, domestic well users in disadvantaged communities, who have historically been left out of water planning processes.

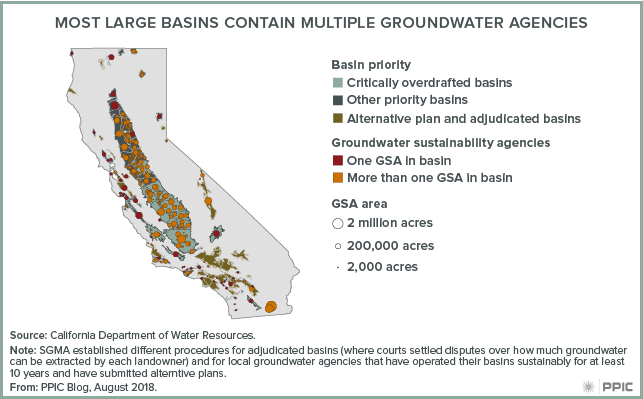
Coordination within basins: Equally important will be collaboration across GSAs within the same basin. SGMA authorized the creation of more than one GSA per basin—and most of the larger basins have multiple GSAs (see map). But SGMA requires them to work together—either to develop a single sustainability plan, or to ensure consistency if there is more than one plan. GSAs will have to make sure that they speak a common language—including common metrics for their groundwater budgets and indicators of sustainability.

Coordination across basins: GSAs will need to collaborate across basins as well. GSAs in adjacent basins should be able to understand how their plans work regionally, and how their management actions affect their neighbors. This is important hydrologically—because groundwater often moves across the basin boundaries established by SGMA. But it is also important for developing projects and actions to attain sustainability.  For instance, one of the most promising ways to augment supplies in depleted basins is by capturing high flow water and recharging it into aquifers. In the San Joaquin Valley, conveying that water to the best recharge locations could generate benefits for multiple basins—but this can’t happen without regional cooperation.

Coordination with counties: Both within and across basins, GSAs will also need to involve relevant agencies that may not be part of the GSA. In particular, county officials have responsibilities and policy instruments that can help in groundwater management. For example, Stanislaus County—which overlies four basins—used its authority to adopt a well moratorium that limits unmanaged expansion of groundwater use. Kern County’s land use planning office implemented a new land use management plan—including updated zoning—to help the community of Indian Wells Valley reduce water use to bring its groundwater resources into balance.

SGMA gives local agencies and water users tremendous responsibility and unique opportunities to manage shared groundwater resources for the long term. It will take time to get the groundwater governance right. Developing strong lines of cooperation early in the planning process will set GSAs up for success.

2020 Census: Where Are California’s Hard-to-Count Communities?

The decennial census plays an essential role in American democracy. The stakes are huge for California, and 2020 is fast approaching. This series of blog posts takes a detailed look at California communities that may be at risk of being undercounted.

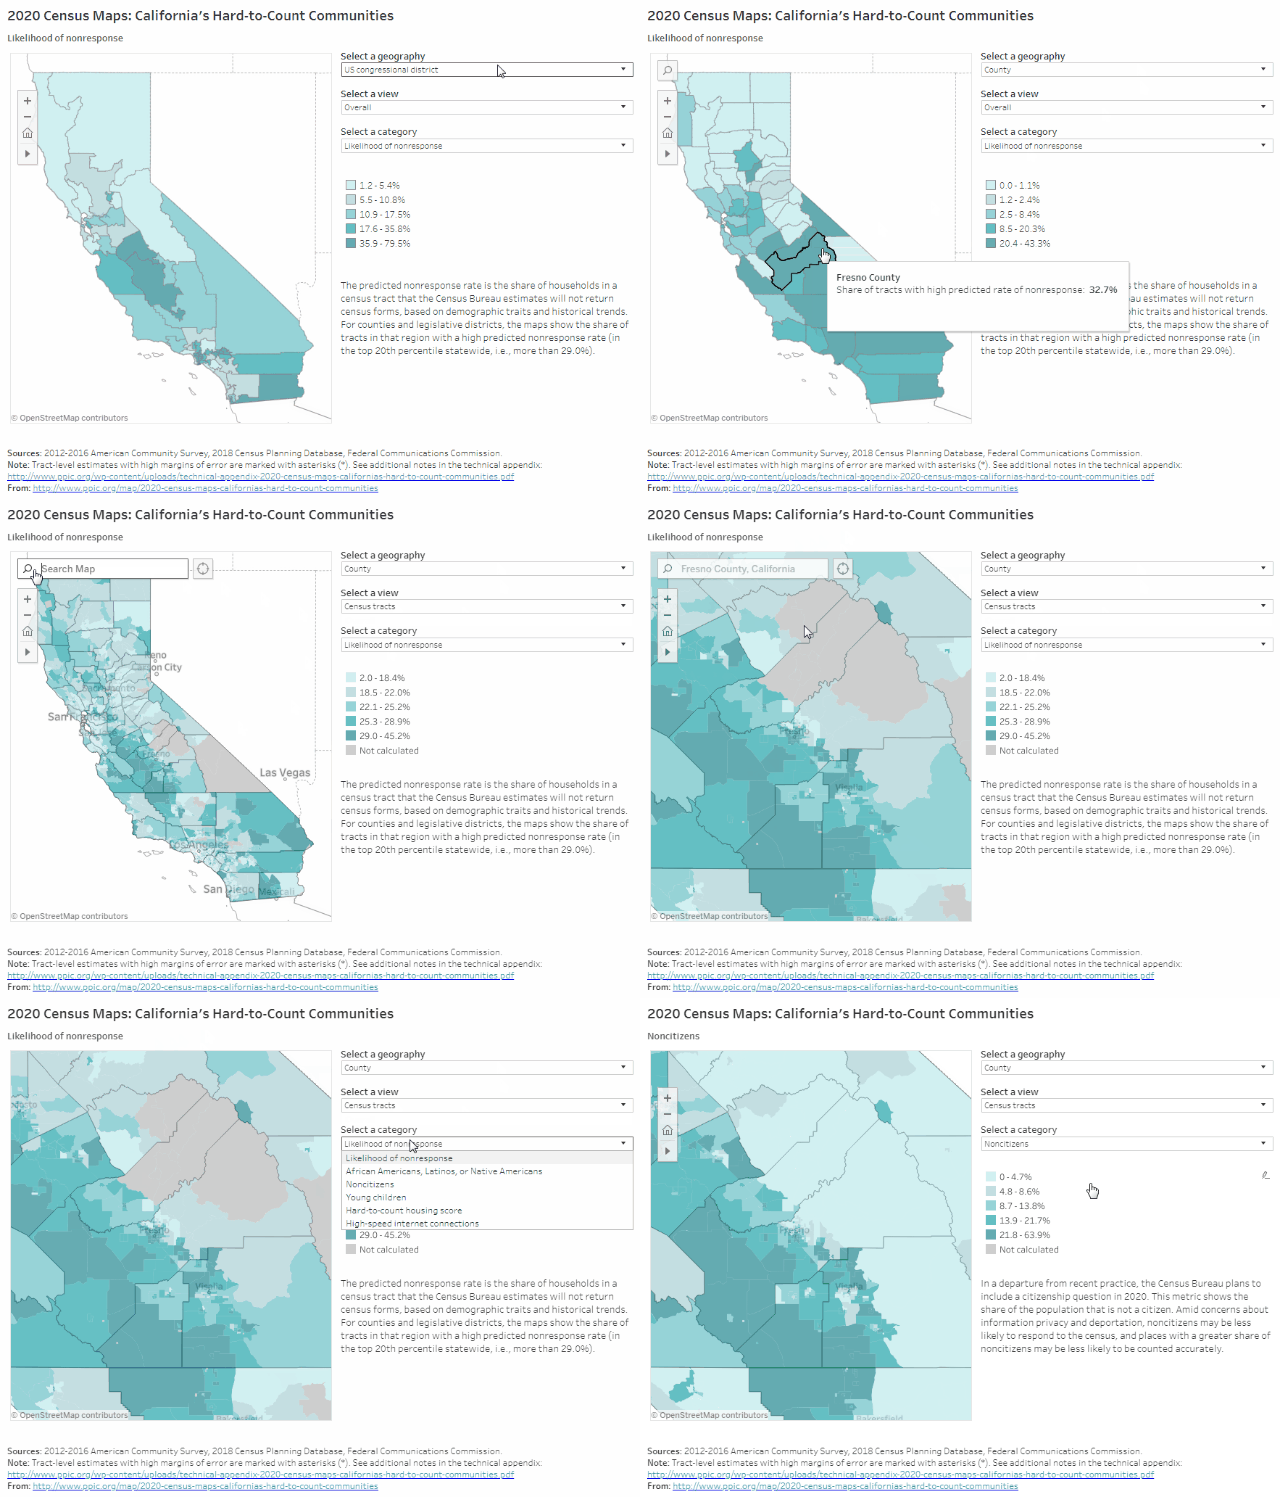
PPIC’s new interactive maps are an important tool for Californians working to ensure an accurate census count. They highlight hard-to-count communities across the state, providing an overall assessment of how hard an area will be to count and pinpointing reasons why certain areas may be hard to reach.

The overall assessment is based on an area’s “low response score,” a measure developed by the Census Bureau using historical trends. This score (what we call the “predicted nonresponse rate”) helps visualize a community’s vulnerability to being omitted from the census. However, it doesn’t capture all areas that will be hard to count in 2020, and it doesn’t indicate the underlying reasons why a community might be hard to count. PPIC’s new maps expand our understanding of hard-to-count communities in several ways.

As shown in the graphic below, the maps provide information for multiple geographies. First, you can select whether you want to see data by county, congressional district, state assembly district, or state senate district. Then, you can examine data for those broad regions or for individual census tracts. Zooming in allows you to identify which census tracts have the highest predicted nonresponse rates in a particular region.

In addition, by selecting different categories, you can get a sense of why these areas might be hard to count:

  • Does the area have high shares of people that are typically undercounted? Certain racial/ethnic groups—African Americans, Latinos, and Native Americans—and young children are historically undercounted in the census. Counties in the San Joaquin Valley and southern parts of California tend to have higher shares of these vulnerable populations.
  • Does the area have many noncitizens? The census is supposed to count all residents, but noncitizens may be less likely to respond in 2020 due to the planned addition of a citizenship question and concerns about privacy and deportation. Monterey County on the central coast has the highest share of noncitizens (22%), followed by Santa Clara County (18%) and Los Angeles County (17%).
  • Does the area have a lot of renters, overcrowded housing, and other factors that can make it hard for the Census Bureau to locate residents? To examine this issue, we created a housing score using data on renters and mobile homes. Seventeen counties in various regions of the state have scores indicating they may face particular challenges counting residents due to their housing conditions.
  • Does the area seem to have adequate internet access? The Census Bureau plans to collect the majority of responses online in 2020—a departure from its usual practice. We provide data on residential high-speed internet connections—a measure created by the Federal Communications Commission that does not include mobile data plans—as a proxy for service coverage. Rural areas are less likely to have residential high-speed internet access.

Overall, the maps show there are hard-to-count communities across the entire state—and regions have different risk factors for being undercounted. In addition, communities may be hard to count for multiple reasons: for example, low-income populations are more likely to live in hard-to-find housing like garages and trailers, and they are also less likely to have reliable internet access.

We hope these maps help local leaders determine the likelihood that their communities might not be accurately counted and provide guidance on targeting outreach efforts. Stay tuned for future posts that examine hard-to-count communities in specific regions of the state.

More Students Are Earning STEM Degrees

The number of students graduating with a bachelor’s degree in science, technology, engineering, or math (STEM) has risen dramatically in California. Both students and colleges are responding to changes in our economy, which increasingly rewards highly educated workers, especially those with STEM degrees.

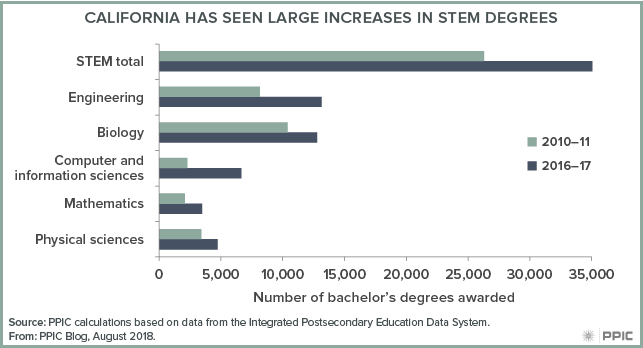
Between 2010–11 and 2016–17, the number of STEM bachelor’s degrees awarded by colleges and universities in California increased 55%, more than triple the rate of growth in other degrees (17%). By 2016–17, 20% of all bachelor’s degrees awarded were in a STEM field, up from 16% in 2010–11.

These increases occurred across the board for all STEM fields and for all higher education sectors in the state. Increases were especially sharp in engineering, which surpassed biology as the most common STEM degree. Computer and information sciences also saw big gains, with almost three times as many bachelor’s degrees awarded in 2016–17 as in 2010–11. The increase in computer science is particularly notable, as its popularity had declined after the “dot com” bust of the early 2000s.

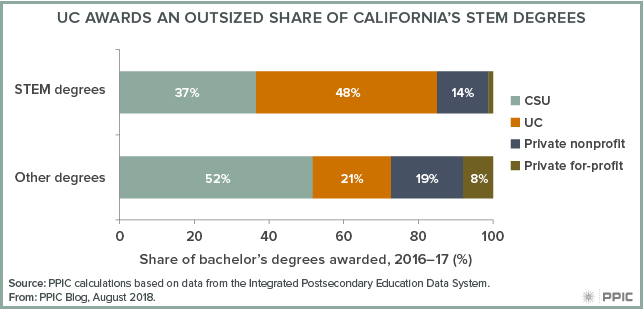
STEM fields are especially popular at the University of California (UC), which awards almost half of the state’s STEM degrees (compared to only 21% of other bachelor’s degrees). In contrast, California State University (CSU) awards 37% of the state’s bachelor’s degrees in STEM, compared to more than half (52%) in other majors. STEM is also less common at private colleges, especially for-profit institutions.

But there is wide variation across colleges. At UC San Diego (56%) and UC Merced (48%), about half of bachelor’s degrees awarded in 2016–17 were in a STEM field, compared to only 27% at UC Santa Barbara. In the CSU system, 37% of bachelor’s degrees at Cal Poly San Luis Obispo were in STEM, compared to only 8% at Cal State Dominguez Hills. And among the state’s larger private nonprofit colleges (those with at least 1,500 bachelor’s degrees awarded), half of Stanford University’s bachelor’s degrees were in STEM, compared to only 8% at Azusa Pacific.

The rapid growth in STEM majors is a testament to changing interests among students. Those interests are academic, but also economic. Strong labor market outcomes for STEM graduates—especially for those with degrees in engineering and computer science—almost certainly contribute to the increasing demand for those majors.

Colleges have responded, at least in part, by building more capacity for STEM majors. Moreover, public colleges have led the way, with UC and CSU experiencing the largest shifts toward STEM degrees. Between 2010–11 and 2016–17, the share of bachelor’s degrees awarded in STEM fields increased 6.8 percentage points at UC (from 30.0% to 36.8%) and 4.4 percentage points at CSU (from 10.7% to 15.1%), compared to only 2.7 percentage points at private nonprofit colleges (from 12.4% to 15.1%).

While more could be done to fully meet student demand—at many campuses, engineering and computer science majors have more applicants than can be accommodated—the evidence to date shows that California’s higher education system has been able to substantially increase capacity in STEM fields.

Video: Californians and the Environment

With the November election less than four months away, Democrat Gavin Newsom leads Republican John Cox by 24 points in the governor’s race—and nearly all likely voters see the candidates’ positions on environmental issues as important. In the US Senate race, Dianne Feinstein continues to lead fellow Democrat Kevin de León by double digits. These and other key findings in the July PPIC Statewide Survey were presented by researcher Alyssa Dykman at a Sacramento briefing last week.

Californians are much more likely than adults nationwide to say that global warming is extremely or very important to them personally. A majority of likely voters see global warming as a very serious threat to California’s economy and quality of life, and a solid majority say that the effects of global warming have already begun. This may help explain why most Californians are in favor of the state making its own policies to address climate change.

Other survey highlights:

  • Approval ratings for the president and Congress—both overall and on environmental issues—remain far lower than those for the governor and state legislature.
  • There are wide partisan differences in views on climate change and what the state should do about it.
  • Likely voters see drought and water supply as the top environmental issue facing the state; a majority support a water bond on the November ballot.
  • A majority of likely voters favor higher emissions standards for automobiles as well as state laws that aim to reduce greenhouse gas emissions in other areas.

Higher Education Finance: How Does California Stack Up?

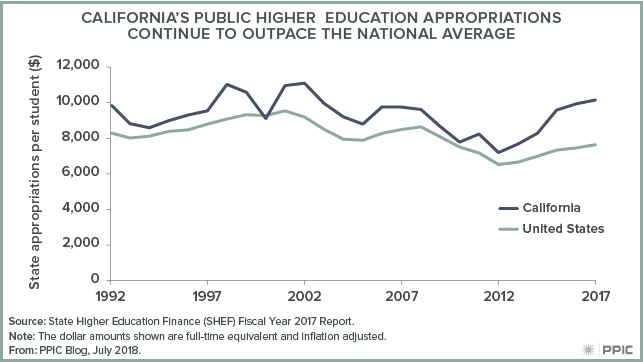
California’s public higher education spending per student has increased significantly since the end of the Great Recession—it is now higher than at any time since 2002. According to a recent report by the State Higher Education Executive Officers Association (SHEEO), spending increased 41% per student (based on full-time equivalents and adjusted for inflation) between 2012 and 2017 in California, compared to 17% across the rest of the nation. California’s percentage change was third highest in the nation, after Oregon and New Hampshire (both with an increase of 47%). However, both of those states provide much less support per student: in 2017, New Hampshire appropriated $2,959 per student and Oregon allocated $6,514, compared to California’s $10,157. California also ranked third in terms of absolute increases ($2,960 in California, compared to $3,781 in Hawaii and $3,608 in Illinois).

California’s funding increases have not been evenly distributed across the three public systems. Since 1988, the community colleges have benefited from the Proposition 98 funding guarantee for K–14 education. As a result, per student funding for the community colleges is now at an all-time high, but is still below peak UC and CSU funding levels.

Governor Brown recently signed the state budget for 2018–19, which includes $19.2 billion General Fund and local property tax funds for all public higher education systems—about 8% more than the 2017–18 allocation. This continues the recession recovery trajectory and prevents tuition increases at UC and CSU. Moreover, the governor and legislature have made investments in the Rainy Day Fund—increasing reserves to $13.8 billion—that will help protect higher education from recession-related cuts during the next economic downturn.

Nearly Half of the Working Poor Are Working Full Time and Year Round

Roughly 2 million out of 16 million working Californians (ages 25‒64) live in poverty, according to California Poverty Measure (CPM) estimates—and nearly half (45%) of these workers are employed full time and year round.

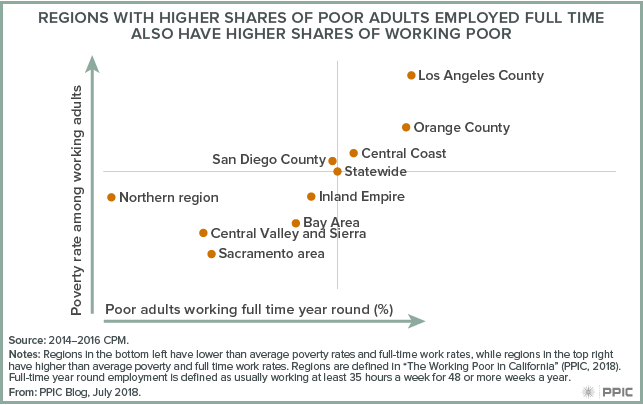
We see a positive association between poverty rates and rates of full-time, year-round employment across regions. In other words, in areas of the state with higher shares of poor adults working full time—including Los Angeles and Orange Counties—the rates of poverty among working adults are also higher.

In those regions, working poverty is clearly not mainly attributable to working insufficient hours. It is driven by wage rates and other factors—measured in the CPM—like the cost of living, necessary expenses, and access to safety net resources (or lack thereof). For many of the working poor, the most promising strategies for improving wages require access to high-quality education and training.

How Wildfires Affect California’s Water Supply

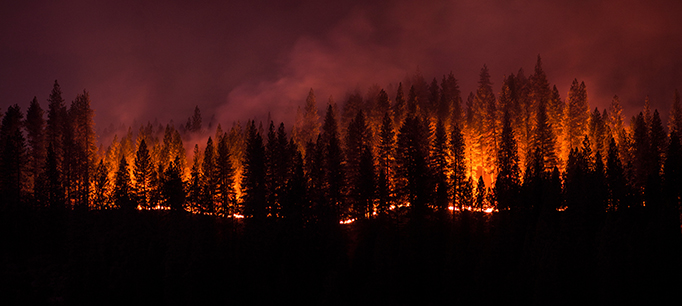
Summer marks the traditional beginning of California’s fire season, although the warming climate has stretched the season considerably. Until the winter rains arrive, wildfires will burn forests and grasslands throughout the state. Since January 1, about 3,700 fires have consumed more than 111,000 acres of land—outpacing 2017, the most destructive and deadly fire season in state history.

While public safety and economic costs deserve and receive a great deal of attention, wildfires also have consequences for the management of water—including the amount and quality of supply, and the potential for flooding.

Fire can bring short-term water supply benefits by increasing runoff for downstream use. Most precipitation that falls on hillsides is captured by plants and soils and sent back into the atmosphere. By removing vegetation and reducing the ability of soils to hold water, most burns lead to an increase in runoff. The amount of increase depends on the type of vegetation that is burned. In Sierra conifer forests, reducing tree cover by about 40% may result in a 9% increase in water yield. Conversely, burning grasslands leads to negligible increases in water supply.

Managing forests with mechanical thinning and prescribed burning simulates the effects of low- and moderate-severity wildfire—creating opportunities to improve forest health while increasing water supply. But before concluding that forest fires and active management can reliably increase water supply, it’s worth noting that increases in water can be short-lived as vegetation rapidly grows back. And in drier forests like those of the southern Sierra Nevada, most downstream users are unlikely to see increased yields.

Wildfire can also bring some serious water management challenges.

Intense fires remove vegetation that prevents excessive erosion. Soils burned at high severity can also lose the ability to absorb water for a few years after a burn. When rain falls on these fire-ravaged slopes, the fast-moving runoff can erode soils and ash, transporting them into rivers. These flows threaten drinking-water quality and fill water supply and hydropower reservoirs with sediment. Following a series of severe wildfires in the American River headwaters, Placer County Water Agency experienced significant damage to its water supply and hydropower infrastructure, including costly impacts from increasing sediment and debris. The agency is now working with multiple partners to reduce wildfire risk above two reservoirs using prescribed burning and mechanical thinning.

The damaged soils and loss of vegetation following a severe burn can also increase the threat of downstream flooding and landslides. In some cases, these slides can become “debris flows”—fast-moving rivers of mud, rock, and other materials that can take out everything in their path. These are one of the most dangerous types of flash floods in California. The most recent and deadly example of this was in Montecito following the December 2017 Thomas Fire (the largest fire by area in state history). In early January 2018, record-high rainfall fell on the fire-scarred slopes above Montecito. The resulting debris flows killed 23 people and damaged or destroyed 400 homes.

Experts are predicting another year of intense wildfire activity. Water managers in affected regions will need to address the impacts of fire on local water supply and flood hazards, and must also account for such impacts in future planning.