2020 Census: Counting the San Joaquin Valley

The decennial census plays an essential role in American democracy. The stakes are huge for California, and 2020 is fast approaching. This series of blog posts takes a detailed look at California communities that may be at risk of being undercounted.

PPIC’s new interactive census maps are an important tool for Californians working to ensure an accurate census count. Using estimates from the Census Bureau and the Federal Communications Commission, they highlight hard-to-count communities across the state and pinpoint reasons why certain areas may be hard to reach.

Home to 4.3 million people, the San Joaquin Valley may be one of California’s hardest-to-count regions in 2020. Encompassing about 11% of the state’s population, the valley runs south from San Joaquin County through Stanislaus, Merced, Madera, Fresno, Tulare, Kings, and Kern Counties. Most of the communities at risk of being undercounted in the region live south of Stanislaus County through Kern County. For example, 33% of census tracts in Fresno County are likely to be very hard to count, according to Census Bureau estimates that draw on demographic characteristics and historical trends. But only 7% of tracts in Stanislaus are very hard to count. Households in these very hard-to-count areas are less likely to respond initially to census forms and are therefore at risk of being undercounted.

Some highlights:

  • An undercount could reshape the legislative landscape of the San Joaquin Valley. Since legislative district lines will be redrawn based on the census, disproportionately undercounting parts of the San Joaquin Valley could reshape the region’s political representation. And while hard-to-count communities are distributed across several counties in the region, they are concentrated in fewer legislative districts. In Congressional Districts 16 (Costa) and 21 (Valadao), for example, about 42% of census tracts are likely to be very hard to count. Undercounting could also affect the northern San Joaquin Valley, which has hard-to-reach areas despite having fewer historically undercounted populations.
  • Undercounting people of color and noncitizens could disproportionately affect legislative districts in the central and southern San Joaquin Valley. This area has particularly high shares of groups that tend to be undercounted in the census—African Americans, Latinos, and Native Americans, as well as noncitizens, who may be even less likely to respond in 2020 due to the planned addition of a citizenship question. A total of six legislative districts have populations that are at least 65% African American, Latino, or Native American and at least 15% noncitizen: Congressional Districts 16 and 21; State Senate Districts 12 (Cannella) and 14 (Vidak); and State Assembly Districts 31 (Arambula) and 32 (Salas).
  • Another factor driving the San Joaquin Valley’s overall risk of being undercounted is the high share of young children. Young children are historically underrepresented in the census. There are particularly high concentrations of families with young children in the central and southern San Joaquin Valley: children under 5 years old make up 8% or more of the population in Fresno, Kern, Kings, Merced, and Tulare Counties—among the highest concentration in the state.
  • Housing conditions may make an accurate count especially challenging in the western San Joaquin Valley. In this area, relatively large shares of housing units are rentals, overcrowded rentals, and/or mobile homes—all of which can make residents harder to find and count accurately. For example, more than 20% of households live in mobile homes in some northwestern parts of San Joaquin County and some southwestern parts of Tulare County.
  • Limited internet access may be an issue in certain areas throughout the region. The Census Bureau plans to collect the majority of responses online in 2020—a change from previous practice. Each county in the San Joaquin Valley has some census tracts with minimal residential high-speed connectivity, with the lowest access outside cities. While people in these areas may have internet access through smartphones or public libraries, in general they may have more trouble accessing the census online.

We hope these maps serve as a starting point to help local, regional, and state leaders think about which activities, resources, and partnerships—including language assistance, awareness raising, and community outreach—might be most effective for accurately counting different parts of California. Stay tuned for future posts that examine hard-to-count communities in other regions of the state.
Video: A Conversation with Congresswoman Nancy Pelosi

As part of our Speaker Series on California’s Future, PPIC is inviting elected leaders across the political spectrum to participate in public conversations. The purpose is to give Californians a better understanding of how our leaders are addressing the challenges facing our state.

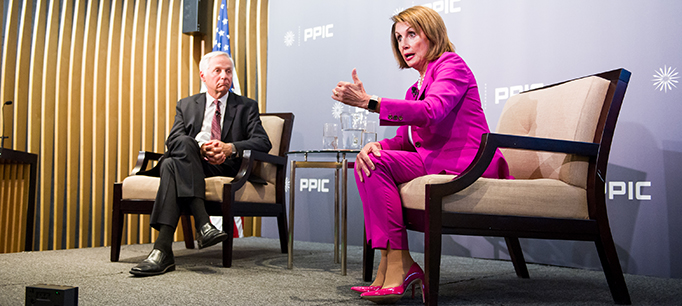
House Democratic Leader Nancy Pelosi and PPIC president Mark Baldassare had a wide-ranging conversation in San Francisco on Wednesday. They focused on the relationship between California and the federal government in a number of areas, including economic and tax policy, immigration, health care, and environmental issues.

Not surprisingly, Pelosi’s take on the state-federal relationship differs from that of her Republican counterpart, Kevin McCarthy, who fielded virtually the same questions from Baldassare in mid-August. In her view, this is an unusual time: “We haven’t had a time where the president has so targeted a state, in tax policy, environmental policy, trade policy.” Californians need to know about the statewide impact of these policies, and their elected leaders need to “try to work as much as possible in a bipartisan way to withstand that.”

She criticized the new federal tax law for significantly increasing the national debt without promoting growth. In fact, she continued, one of the best ways to promote economic growth is to enact comprehensive immigration reform. Asked what this would look like, she cited the bipartisan immigration bill that the Senate passed several years ago as one possible model. She deplored the current “uncivilized, inhumane” policy of separating families at the border. But she argued that while Trump-era ICE policies need to be changed, abolishing ICE is “not the answer.”

Pelosi, who played a major role in the passage of the Affordable Care Act, described health care reform as a “pillar of health and economic security for America’s working families.” She also characterized health care as a major issue in the November midterm elections. “The cost of health care is a very major issue in people’s lives, so we want to work in a bipartisan way, wherever possible, to reduce those costs.”

While she is concerned that Congress is not doing enough to ensure the integrity of the midterm elections, Pelosi is excited about the number of women who are running. “When I went to Congress, there were 12 Democratic and 11 Republican women.” Now, she added, “the majority of the people in our caucus are women, people of color, LGBTQ [. . .] and we want more!”

Why does she want to be Speaker? The short answer: “None of us is indispensable, but I think I’m probably the best person for the job.”


Video: A Conversation with Congressman Kevin McCarthy

As part of our Speaker Series on California’s Future, PPIC is inviting elected leaders across the political spectrum to participate in public conversations. The purpose is to give Californians a better understanding of how our leaders are addressing the challenges facing our state.

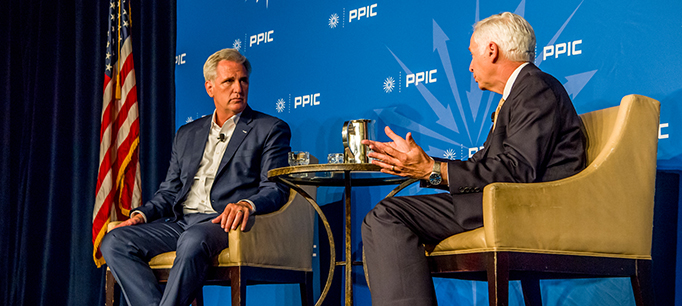
House Majority Leader Kevin McCarthy and PPIC president Mark Baldassare had a wide-ranging conversation in Sacramento last week. They focused on the relationship between California and the federal government in several areas, including tax reform, immigration, health care, water policy, wildfire management, and fuel emissions standards.

When asked about the impact of the recently passed federal tax law on Californians, he emphasized the bigger economic picture. The focus, he said, should be on the overall Republican agenda and whether it inspires optimism about the future: “Do you feel better off? How many quarters of economic growth have you had?”

McCarthy criticized the state’s leadership for its “backwards thinking” on the gas tax and other issues, and its oppositional stance to the Trump administration. He also talked about the need for bipartisan compromise in Congress. “I try to work with everybody,” he said, citing the work he did with Senator Feinstein to pass “the first major piece of water legislation in quite some time.” He returned to this theme after the conversation was briefly interrupted by a pro-DACA demonstration, asking why we can’t “sit down and communicate with one another” and decrying “elected officials who stand up and say ‘Divide us, not unite us’.”

Nonetheless, he seemed confident about finding ways to address major issues. About immigration policy, he said “I think we’re going to solve this problem” in the next congressional session. Asked about the 2020 Census, he said that Congress is making sure there will be an accurate count. “It is a big job,” he added, “and this is always the big fear before a census—are we prepared for it?”

Finally, when asked why he wants to become Speaker of the House, he said, “I want to make sure a Republican can be Speaker,” so that the party can continue to enact its agenda. He went on to describe the electoral landscape leading up to the November midterms, offering up a key takeaway: “This will be the year of the woman.”

Geographic Variation in Poverty across California

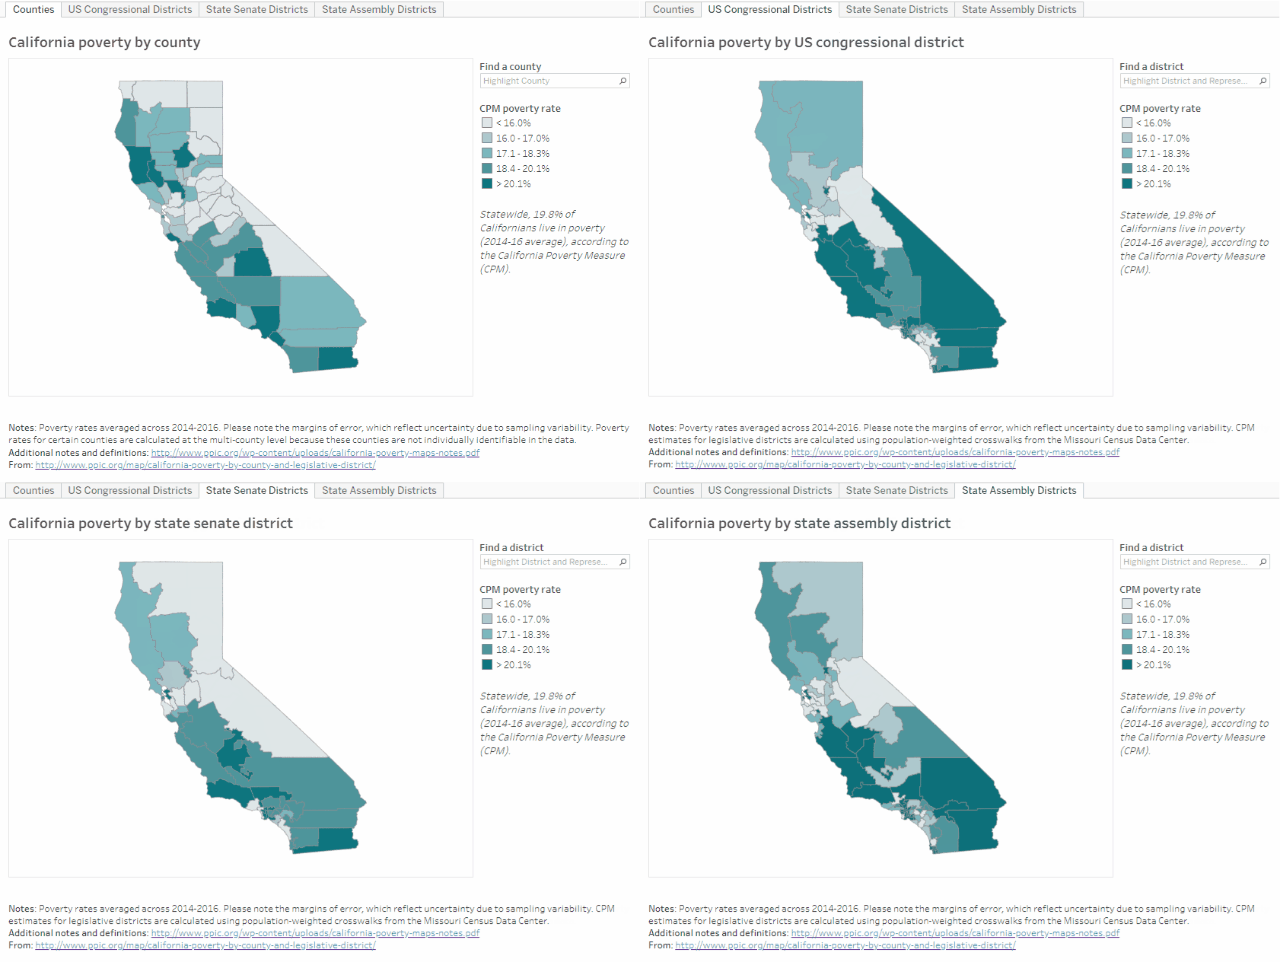
Each year, when we update the data on poverty in California, we remark on how widely poverty rates vary across counties. In Los Angeles County, 24.3% of residents are poor, compared with just 11.8% of those in El Dorado County, according to the California Poverty Measure (CPM). The CPM is a collaboration between PPIC and the Stanford Center on Poverty and Inequality that adjusts for regional housing costs and incorporates resources from major social safety net programs.

Our new interactive maps highlight the dramatic variation in poverty across counties and US congressional, state senate, and state assembly districts. Overall, the maps show high rates of poverty in coastal and southern California, and lower rates in the northern and Sierra regions. This pattern is driven by a variety of factors: poor families in coastal, urban regions can earn relatively higher incomes, but this is often outweighed by high costs of living and reduced eligibility for safety net programs. In contrast, high poverty rates inland and along the north coast are driven by low incomes and limited employment—despite substantial poverty reduction by the social safety net.

These maps allow leaders from counties—where social safety net programs are often implemented—and legislative bodies—where program funding is allocated—to learn more about poverty and the impact of the safety net in their region.

Legislative districts see even greater disparities in poverty than counties do. Across assembly districts, for example, poverty rates differ by more than 30 percentage points, ranging from 7.8% in Assembly District 16 (Baker, R) in eastern Contra Costa County to 40.7% in Assembly District 59 (Jones-Sawyer, D) in central Los Angeles. This range reflects differences in the number of counties and assembly districts, as well as the size of their populations. California has 80 assembly districts with roughly equal populations, so they represent more slices of the state—especially in urban, densely populated counties.

Comparing counties and legislative districts draws attention to the ways that boundaries can bring forth or obscure populations. In the Inland Empire (San Bernardino and Riverside) in southeastern California, county and state senate district lines show poverty rates below the state average of 19.8% from 2014–16, ranging from 18.2% to 18.9%. But state assembly and US congressional districts in that area have high poverty rates, ranging from 20.5% to 22.7%—and are adjacent to districts with much less poverty.

The maps provide a rich resource for learning about the geographic variation of poverty in California. Since the factors driving poverty vary across the state, effective approaches for reducing poverty may vary too, as our previous research on child poverty has shown. For additional detail, the maps allow users to download estimates on the impact of major social safety net programs on poverty in different regions.

Voters Favor New Water Bond. What Are They Missing?

One of the most surprising findings in the July PPIC survey is the strong support for an $8.9 billion state water bond among California likely voters (58%). Support for the bond―Proposition 3 on the November ballot―comes close on the heels of California voters passing a $4.1 billion state water and parks bond in June. What’s going on?

Majorities of California likely voters across partisan and demographic groups and the state’s regions say that water supply is a big problem in their part of California. Water supply and drought were the number one environmental problem named by likely voters in the survey (24%). Since Governor Brown took office in 2011, water supply and drought have been among the top environmental issues named by likely voters, and since 2014, together they have been named the most important environmental issue facing the state.

Majorities of likely voters across demographic groups and regions―including most Democrats (72%), nearly half of independents (48%), and four in ten Republicans (43%) and self-described conservatives (46%)―support Proposition 3.

PPIC surveys in the past five years show that support for state water bonds has remained high since the severe drought of 2012–16; voters are anxious about its return in light of other signs of climate change. Since 2014, at least half of California likely voters have said they would vote yes on various state water bonds. Moreover, an earlier PPIC survey found that most likely voters prefer bonds (44%) over fees (25%) and taxes (13%) as the means to fund water infrastructure projects.

What are the voters missing?

State bonds are important, but they actually play a relatively minor role in funding California’s water. Bonds provide at most $1 billion of the more than $30 billion in annual water-related spending. Local revenue—from water and sewer bills to taxes—provides the lion’s share. In addition, bonds are not a reliable long-term funding source, and they generally don’t cover operating and maintenance costs. State bonds don’t directly raise fees or taxes—which may make them more popular with voters than these alternatives. But they are not free. Every year bonds are repaid with significant interest from the state General Fund, which can reduce funding available for other important budget areas, such as education and health and human services.

California faces critical water funding gaps—totaling about $2–$3 billion annually—across several essential areas: safe drinking water in small, disadvantaged communities; flood protection; control of stormwater and other polluted runoff; and management of freshwater ecosystems and headwater forests. Limited financial capacity of low-income communities, legal constraints on local funding, a shrinking federal contribution, and unreliable state support contribute to the shortfall. There have been efforts to fill the gaps in other ways—especially for safe drinking water—but new sources of funding such as a surcharge on water bills haven’t enjoyed the same broad support as state bonds.

In California’s $2.7 trillion economy, filling the gaps for water’s “fiscal orphans” should be manageable. But this will require a focused effort and leadership at all levels. Bonds can help, but they can’t do it alone. Looking beyond bonds to find more durable ways to pay for essential water services—including with new fees and taxes―must be a top priority going forward.

Environmental Priorities and the Midterm Election

Just three months ahead of a consequential midterm election, California and the federal government continue to move in very different directions on environmental policy. Last week, the Trump administration’s efforts to roll back strict automobile emission standards were strongly criticized by the Brown administration. State officials have also pushed back on federal efforts to increase offshore oil drilling and the president’s decision to exit the Paris Agreement on climate change. Meanwhile, personal experiences with a prolonged drought and recent severe wildfires are raising Californians’ awareness about the impacts of climate change. Where do California voters stand on environmental issues and what are the implications for November?

Californians’ support for environmental protection runs deep. Consider emissions standards. In the July PPIC survey, 60% of California registered voters say that they are in favor of setting higher emissions standards for automobiles. Majorities of voters across age, education, gender, income, and racial/ethnic groups support this environmental policy. Majorities of Democrats (74%) and independents (62%) and 34% of Republicans are in favor. Notably, 52% of registered voters living in the nine competitive House districts—as rated by the Cook Political Report—favor higher auto emission standards.

Or take another area of state-federal policy conflict over the environment, offshore oil drilling. Sixty-six percent of California registered voters are opposed to more drilling off the California coast. Opposition is high among Democrats (82%) and independents (66%), and reaches 40% among Republicans. Majorities oppose it in both the coastal and inland regions of the state and across age, education, gender, income, and racial/ethnic groups. As for the registered voters living in the nine competitive House districts, 56% are opposed to allowing more offshore drilling off the California coast.

These views on particular environmental policy issues are similar to larger concerns related to global warming. About two in three California registered voters believe that global warming has already begun (67%), say that they are very concerned about its possible impact on more severe wildfires (64%), and favor the state law that requires California to reduce its greenhouse gas emissions (67%). Majorities of Democrats and independents share these views, along with substantial proportions of Republicans and majorities of voters across regions and age, education, gender, income, and racial/ethnic groups. In the nine competitive House districts, majorities of registered voters believe that global warming has already begun (59%), say they are very concerned about the impact of global warming on more severe wildfires (56%), and favor the state law that requires greenhouse gas emission reductions (62%).

Personal views about global warming could shape the size and profile of the electorate this year. Majorities of California voters say that the issue of global warming is extremely or very important to them personally (62%). If this high level of personal concern motivates voter turnout, it will provide a partisan advantage (80% Democrats, 61% independents, 29% Republicans). It could also serve as a catalyst in several Democratic-leaning groups with a low propensity to vote (64% under age 35; 68% earning less than $40,000; 69% renters; 70% Latinos). Moreover, in the nine competitive House districts, majorities of registered voters (55%) say that global warming is extremely or very important to them personally.

In the midterm election context, Californians are indicating strong opinions on environmental matters. A record-high number of registered voters say that the gubernatorial candidates’ positions on the environment are very important in determining their vote (39% 2002, 46% 2006, 42% 2010, 40% 2014, 53% 2018).

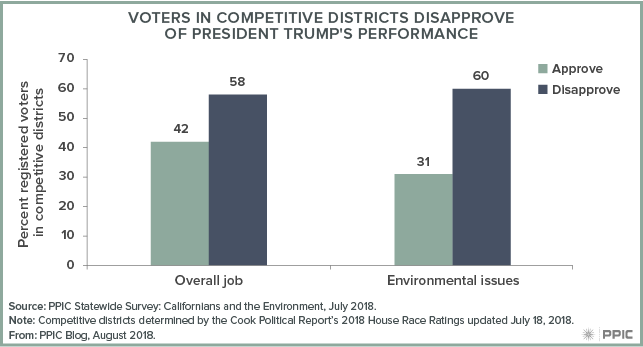
California voters say that they want statewide candidates to push back rather than work with the Trump administration on environmental issues (53% to 40%), and a majority disapprove of the way that President Trump is handling environmental issues (67%). Since the midterm elections are in part a referendum on the president, it is perhaps most significant that a majority of registered voters living in the nine competitive House districts disapprove of President Trump’s handling of environmental issues (60%)—similar to their disapproval of his overall job performance (58%).

Californians’ environmental priorities are high on our list of political wildcards in this important midterm election. Stay tuned as the PPIC Statewide Survey monitors this trend and other topics in our pre-election polling.

Video: 2020 Census: Why Is the Citizenship Question Such a Big Deal?

The decennial census plays an essential role in American democracy. The stakes are huge for California—and 2020 is fast approaching.

In this video, PPIC research fellow Eric McGhee discusses the controversial addition of a citizenship question to the 2020 Census. View more videos in this series.


Video: Californians and the Environment

With the November election less than four months away, Democrat Gavin Newsom leads Republican John Cox by 24 points in the governor’s race—and nearly all likely voters see the candidates’ positions on environmental issues as important. In the US Senate race, Dianne Feinstein continues to lead fellow Democrat Kevin de León by double digits. These and other key findings in the July PPIC Statewide Survey were presented by researcher Alyssa Dykman at a Sacramento briefing last week.

Californians are much more likely than adults nationwide to say that global warming is extremely or very important to them personally. A majority of likely voters see global warming as a very serious threat to California’s economy and quality of life, and a solid majority say that the effects of global warming have already begun. This may help explain why most Californians are in favor of the state making its own policies to address climate change.

Other survey highlights:

  • Approval ratings for the president and Congress—both overall and on environmental issues—remain far lower than those for the governor and state legislature.
  • There are wide partisan differences in views on climate change and what the state should do about it.
  • Likely voters see drought and water supply as the top environmental issue facing the state; a majority support a water bond on the November ballot.
  • A majority of likely voters favor higher emissions standards for automobiles as well as state laws that aim to reduce greenhouse gas emissions in other areas.

Higher Education Finance: How Does California Stack Up?

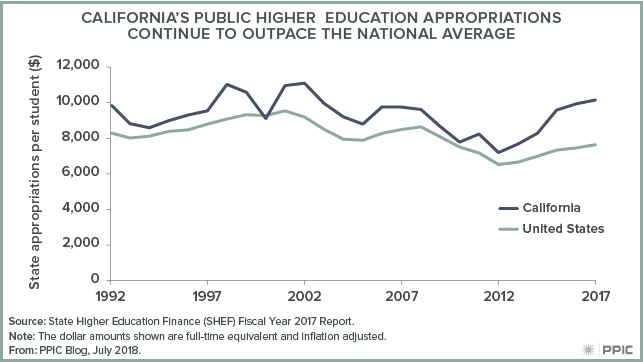
California’s public higher education spending per student has increased significantly since the end of the Great Recession—it is now higher than at any time since 2002. According to a recent report by the State Higher Education Executive Officers Association (SHEEO), spending increased 41% per student (based on full-time equivalents and adjusted for inflation) between 2012 and 2017 in California, compared to 17% across the rest of the nation. California’s percentage change was third highest in the nation, after Oregon and New Hampshire (both with an increase of 47%). However, both of those states provide much less support per student: in 2017, New Hampshire appropriated $2,959 per student and Oregon allocated $6,514, compared to California’s $10,157. California also ranked third in terms of absolute increases ($2,960 in California, compared to $3,781 in Hawaii and $3,608 in Illinois).

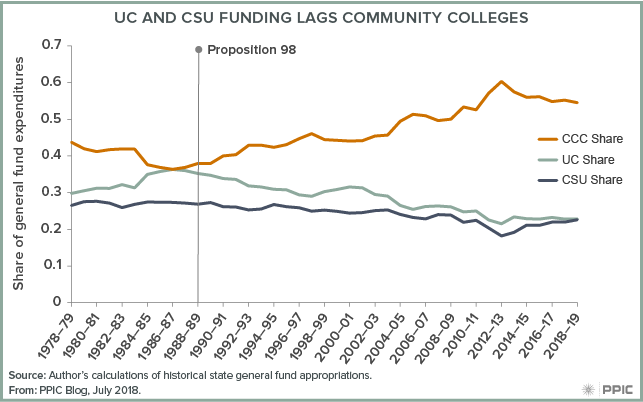
California’s funding increases have not been evenly distributed across the three public systems. Since 1988, the community colleges have benefited from the Proposition 98 funding guarantee for K–14 education. As a result, per student funding for the community colleges is now at an all-time high, but is still below peak UC and CSU funding levels.

Governor Brown recently signed the state budget for 2018–19, which includes $19.2 billion General Fund and local property tax funds for all public higher education systems—about 8% more than the 2017–18 allocation. This continues the recession recovery trajectory and prevents tuition increases at UC and CSU. Moreover, the governor and legislature have made investments in the Rainy Day Fund—increasing reserves to $13.8 billion—that will help protect higher education from recession-related cuts during the next economic downturn.

Good Budget News for Higher Education

The California State Legislature and Governor Brown recently reached a $200 billion budget deal that includes just over a billion dollars in new funding for the state’s public higher education systems. This funding forestalls proposed tuition increases at UC and CSU and allows each system to support increasing student access and success. Moreover, the governor and legislature’s work to maximize the state’s rainy day fund should help to reduce the likelihood of drastic tuition increases in the future, should an economic downturn threaten higher education funding.

The new funding will allow UC and CSU to enroll an additional 1,500 and 3,641 undergraduates, respectively, next fall.  These enrollment increases—coupled with more dollars allocated to improve time-to-degree, boost graduation rates, and close achievement gaps—will help each system to do their part to provide much-needed growth in the number of college graduates in the state.

The budget deal also includes the governor’s top two higher education priorities: the creation of an online-only community college and the introduction of a new community college funding formula. This year, community college funding per full-time student will exceed $8,000—the highest level in the systems’ hundred-year history. (Mainly this is because community college funding falls under Proposition 98, the K–12 funding guarantee passed by voters in 1988.)

The online community college will be launched with $100 million and receive $20 million per year going forward. The goal? To provide opportunities to earn short-term credentials to California’s “stranded workforce” (workers stuck in low paying jobs or jobs that are likely to be automated soon), to help such workers to better compete in today’s labor market. The online college will offer credential programs that have demonstrated labor market value and are not already offered at brick-and-mortar community colleges.

The establishment of a community college funding formula will be phased in over three years. It will provide funding for low-income and underrepresented minority students, reward colleges for improved student outcomes, and reduce reliance on increased enrollment to secure state funding. This approach represents the ongoing emphasis on improving student outcomes at the community colleges.

This is Jerry Brown’s final budget deal—it will be up to the next governor to work with the legislature to ensure the ongoing health of the public higher education system. California’s future economy depends on it.