Video: 2020 Census: What’s at Stake for California?

The decennial census plays an essential role in American democracy. The stakes are huge for California—the state stands to lose political representation and federal funding if there is a significant undercount—and 2020 is fast approaching. At a time when straightforward facts are in short supply, PPIC is providing essential, objective information about the importance of an accurate census count in California.

In this video, PPIC research director Sarah Bohn explains why the census is of particular importance to the Golden State this time around.

Primary Takeaways: Democracy Is Alive and Well in California

With the release of the official Statement of the Vote, the final tally is in for the 2018 California primary. The election outcomes are encouraging news for California’s democracy—especially in light of criticisms of the top-two primary system by the national media. Several important statewide trends stand out:

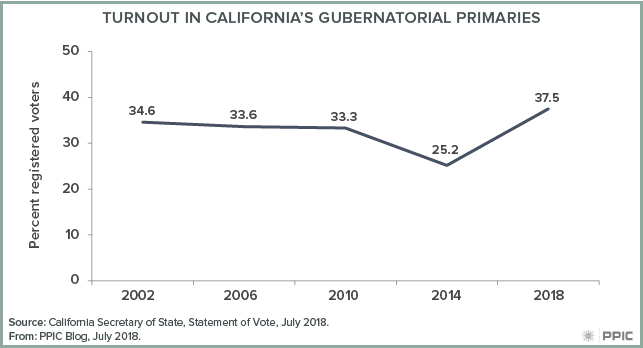
  • Strong political participation. A record-setting 19 million Californians—75.7% of eligible adults—were registered to vote in the gubernatorial primary. This threshold has not been reached since the middle of the 20th century. Moreover, the 7.14 million voters who cast ballots is an all-time high for a gubernatorial primary and, at 37.5% of registered voters and 28.4% of eligible adults, the turnout rates are the highest reported in the five gubernatorial primaries since 2000. Since his election four years ago, California Secretary of State Alex Padilla has been on a mission to make it easier for Californians to register to vote and cast ballots, and the efforts seem to be working. The May PPIC survey found that likely voters’ attention to election news was relatively high, so credit also goes to the media for stoking interest in political participation.

  • More independent voters. Many Californians are responding to the hyper-partisanship of national politics by eschewing the major parties and registering as independents (also known as NPP for “No Party Preference”). In June’s election, for the first time in the state’s history, NPP voters outnumbered Republican voters (25.5% to 25.1%). In the past four years, the number of NPP voters increased (+1,103,602) more than the number of Democratic voters (+745,598), while Republican ranks shrunk (-267,311). The makeup of the June ballot reflected the political clout of NPP voters. Four of the statewide races included NPP candidates, giving voters some nonpartisan choices they did not have under the previous primary system. And in a first for the general election, the top two candidates for insurance commissioner are a Democrat and an NPP candidate (formerly a member of the Republican Party).
  • Diverse statewide candidates. After much consternation about the likelihood of a single-party race at the top of the ticket, five of the eight partisan races—including the governor’s—feature a Democrat running against a Republican. Except for the governor’s race, the top-two primary results offer a diverse pool of candidates to choose from in the fall, at least among Democratic options. The US Senate election and the seven down-ticket races include five Latinos, four women, two Asian Americans, and one African American. Also, eight of the nine statewide races—including the governor’s—are contests between Northern and Southern Californians. While many Republicans are likely to skip voting in a US Senate race with two Democratic candidates, as they did in November 2016, a Democratic-only race for the open lieutenant governor seat will be closely watched for signs of cross-party voting.
  • Popular state ballot measures. Four of the five state propositions placed on the June primary ballot by the legislature passed. This is consistent with the historically high pass rate for legislative ballot measures. With the legislature’s approval holding steady and at a relatively high level in the May PPIC survey, the four state propositions each passed by healthy margins—including a 58% “yes” vote for the state water and parks bond. The latter results bode well for the state housing bonds passed by the legislature and placed on the November ballot. (Citizens’ initiatives appear only on the November general ballot.)

The main takeaway from the June primary is that the vital signs of California’s democracy are healthy. In the wake of California’s many election reforms, records may be shattered in the numbers of registered voters and ballots cast this fall—and throughout the 2020s. The top-two primary system may have its quirks, but it is well suited for the burgeoning number of NPP voters. NPP candidates have found a home in the top-two primary, an NPP will be on the fall ballot, and there will likely be NPP statewide officeholders in the future. The fears about major party voters feeling left out of the fall election were overblown, and most top two candidates reflect the state’s diversity. Positive responses to the June ballot measures suggest an easy time for the state propositions from the legislature this fall; the fate of the nine citizens’ initiatives—including a repeal of the recent gas tax increase—is currently less clear.

At PPIC, the race for governor, US senator, and superintendent of public instruction stand out as uniquely worthy of public attention. We have invited the two candidates in each race to participate in conversations with me about the future of California. Stay tuned for more information about these public events. Meanwhile, throughout the fall the PPIC Statewide Survey will focus on the governor’s race, the US Senate election, and the congressional races—as well as the gas tax repeal and other state propositions that impact our future. We look forward to informing discussions and raising awareness about the importance of this consequential election for the state and nation.

What Does the Repeal of Net Neutrality Mean for California Schools?

As the Federal Communications Commission’s (FCC) repeal of net neutrality phases in, concerns that Internet service providers (ISPs) could speed up or slow down traffic from certain websites or prioritize certain content loom large. Changes to Internet service, if any, will probably be slow and gradual; however, the repeal has potentially important implications for the digital divide in and outside of California’s schools.

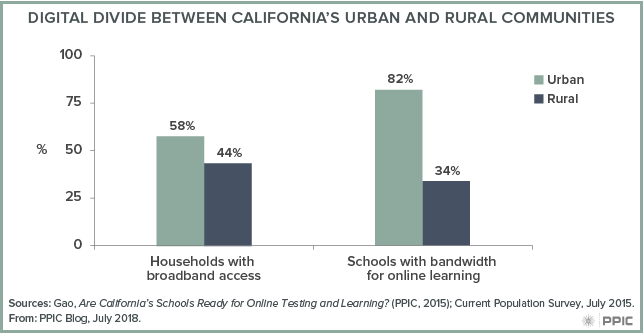
K‒12 schools rely increasingly on online content and management systems to deliver instruction (e.g., blended learning), administer standardized tests (e.g., Smarter Balanced assessments), and manage educational data (e.g., cloud computing). As online learning becomes ubiquitous, access to high-speed Internet is no longer optional—it’s a necessity. Most schools receive discounted Internet services through the federal E-rate program, but if providers decide to introduce tiered pricing based on content, students and educators could lose access to quality education programs. Tiered pricing could also exacerbate the digital divide between urban and rural districts. PPIC research shows that close to 70% of rural districts lack sufficient bandwidth for digital learning, compared to 18% of urban districts. If this gap persists or widens, students in rural areas may be left behind in the digital race.

Another concern is the homework gap. The FCC reports that 70% of teachers assign homework that requires access to broadband, while an estimated 860,000 (22%) households with school-age children in California do not have home Internet service. For many of these households, the cost is too high. Low-income families may get government subsidies (e.g., the Lifeline program) or discounts from ISPs. However, if providers create a fast lane for customers who pay premiums and a slow lane for those who don’t, the homework gap may widen. Rural residents may be particularly affected by these changes, because they tend to have more limited Internet access and fewer ISPs.

Federal and state policymakers have placed net neutrality near the top of their agendas. A major legislative effort to restore net neutrality fell short in the US House of Representatives. In California, two Senate bills (SB 822 and SB 460) that would establish a stringent net neutrality regime are being considered in the state legislature. Other states, including Montana, New York, and Oregon, are taking similar legislative or executive action

Paying for Water’s “Fiscal Orphans”

California’s water system is generally well funded and adequately maintained, but there are a few areas that lack a steady funding source. The most prominent of these “fiscal orphans” are safe drinking water for disadvantaged rural communities, flood management, stormwater management, and water for the environment. We talked to Dean Misczynski, an expert in infrastructure financing and an adjunct fellow with the PPIC Water Policy Center, about how to create a more reliable funding stream to address these problems.
PPIC: Are there better ways to pay for California’s underfunded “fiscal orphans”?

Dean Misczynski: Water is one of the easier things in government to pay for, because you can sell it. Local water fees and local taxes pay for most spending on water in California. State voter-approved general obligation bonds also play a pretty big role. But our thinking about how to use state bond acts developed sometime around the Civil War, and we could do a better job using bonds to fund 21st-century realities.

We currently use bond acts to raise the capital needed to build projects. But funding for the operation and maintenance costs of those projects is expected to come from somewhere else―or nowhere. No sensible business thinks this way; capital funding and operations and maintenance should be part of a unified financing plan. In addition to authorizing borrowing money for specified purposes, a state bond act could easily include ongoing expenses by appropriating money from the General Fund to pay for the operation and maintenance needed to make the project work. This approach would offer a more business-like, coherent financing plan and give voters a more honest look at what the undertaking would really cost.

To be clear, the operations and maintenance budget would not be part of the borrowing authorized by the bond act, because that would be an expensive way to pay for ongoing costs. But the funding would be earmarked and committed for the long term. And note that this doesn’t call for a new tax or fee; it just requires an ongoing commitment to use some General Fund dollars to cover the ongoing costs. In this way it’s similar to the bond itself—repayment comes from the General Fund, which ultimately comes from existing taxes.

PPIC: What types of issues would this approach be especially appropriate for?

DM: It’s best in situations where there aren’t good ways to cover operations and maintenance for projects funded by the bond. If we were to take this idea seriously, we’d want to do some careful thinking to identify the most legitimate uses of this new authority and to caution against using it for unnecessary or unwise purposes.

So, for example, a relatively well-off community getting a bond-funded project wouldn’t need state money for ongoing expenses. But for a water system in a very poor community, this type of funding mechanism could be very useful. There are a number of small, disadvantaged communities in the Central Valley that can’t afford to upgrade or maintain parts of their water system and that lack safe drinking water as a result. They might be good candidates.

These types of appropriations could also pay for ongoing expenses for projects that are important and have political support, but are easy targets for cuts during the state’s inevitable next recession. Two examples that come to mind are maintaining watershed areas, and data collection and analysis to improve water management.

This approach wouldn’t just be useful in the context of water—it could help with the transportation sector, low-income housing, and other statewide challenges. And it could be used as a model for local bond funding as well.

The Federal Farm Bill Could Affect CalFresh

The federal Farm Bill is due for reauthorization in Congress, but its fate is still uncertain—Senate and House versions differ substantially. The largest share of spending in—and the most contentious aspect of—the bill is the Supplemental Nutrition Assistance Program (SNAP), known as CalFresh in California. CalFresh is the state’s main food assistance program, helping nearly 4 million Californians afford groceries each month. The Senate bill leaves net SNAP funding largely unchanged. The House bill would trim costs significantly, in part by revamping work requirements and limiting state flexibility in setting eligibility guidelines. These changes, which would reduce the number of program recipients, are being proposed at a time when the SNAP caseload is declining nationwide, after growing substantially during and after the Great Recession.

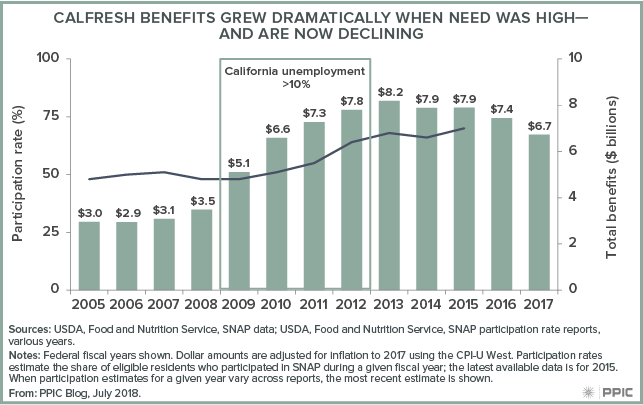
In California, policymakers have focused in recent years on getting more eligible Californians enrolled in CalFresh—the state had the lowest participation rate in the nation for a number of years. The share of those eligible who received benefits grew from about 50% to 70% between 2009 and 2015 (the most recent estimate)—but this improved participation rate is still near the bottom. Nonetheless, the California Poverty Measure estimates that CalFresh benefits kept more than 800,000 residents out of poverty in 2015.

Even as participation rates have been rising, decreases in demand are causing CalFresh benefit costs to fall—from $7.4 billion to $6.7 between 2016 and 2017 alone. Whether or not federal policies change, program costs are likely to continue to fall in the next year—unless the state enters a recession and the need for food assistance rises.

Emergency Departments and the Affordable Care Act

Coverage expansions under the Affordable Care Act (ACA) have resulted in a dramatic decline in the uninsured population in California. Much of the coverage gains have been driven by expanded eligibility for Medi-Cal, the state’s Medicaid program, which has seen a nearly 60% increase in enrollment since January 2014. With this large Medi-Cal expansion comes concerns about controlling costs, ensuring adequate access to care, and supporting the state’s health care safety net.

Monitoring how often people seek care in California’s emergency departments offers important insights—in part because frequent use can signal poor access to other medical care options. Hospitals in some parts of the state have reported growing demand for emergency care services in recent years. In a new study published this month in the journal Health Affairs, we examined emergency department use to understand how things have changed since the implementation of the ACA.

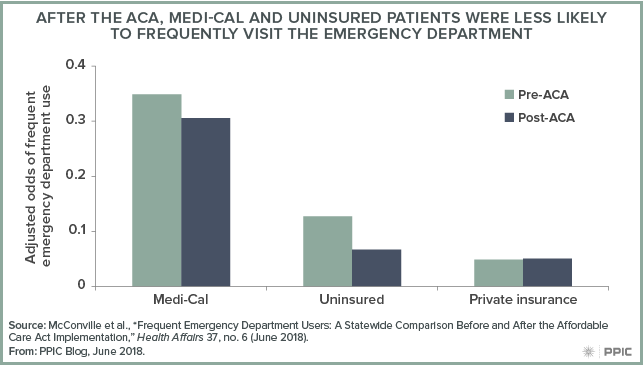
After controlling for factors such as patient age and health status, we found the odds of being a frequent emergency department user—with four or more annual emergency department visits—were significantly lower for Medi-Cal patients after the ACA. The odds of frequent use among the uninsured declined even more, while those with private insurance experienced little change. At the same time, however, there has been an overall increase in both the share and the absolute number of emergency department patients who are frequent users—despite the lower odds of frequent emergency department use after the ACA. We found that frequent users accounted for 7.9% of emergency department patients in the two years before the ACA, compared to 8.5% in the two years after.

Both before and after the ACA, the largest predictors of frequent emergency department use were having a diagnosed mental health condition or substance use disorder. This finding suggests state efforts to better integrate physical and behavioral health services for Medi-Cal enrollees could help lower frequent emergency department visits. Given that Medi-Cal is now the primary coverage source for more than two-thirds of frequent emergency department users, care plans managed by Medi-Cal will be a key player in efforts to manage emergency care moving forward.

In future work, we will be studying in more depth how changes in insurance coverage affected emergency department use across the state—with a particular focus on regions that saw the largest declines in their uninsured rates.

Video: The Impact of Proposition 47 on Crime and Recidivism

Proposition 47, passed by voters in November 2014, has generated considerable debate. By reducing penalties for some lower-level drug and property offenses, Prop 47 marked another significant step toward reducing California’s reliance on incarceration. Supporters of the reform believe that redirecting money that is no longer being spent on incarceration to behavioral health and other treatment programs would reduce recidivism. Opponents feared that Prop 47 would overburden local law enforcement and lead to increases in crime.

A panel discussion in Sacramento last Thursday encapsulated this debate—but also featured significant areas of agreement. PPIC researcher Mia Bird set the scene by outlining a new report, The Impact of Proposition 47 on Crime and Recidivism. The report finds no evidence that Prop 47 has affected violent crime rates but sees signs that it led to a rise in property crime—driven largely by thefts from motor vehicles. The report also finds a decline in recidivism, driven largely by a drop in rearrest and reconviction rates for offenders covered by Prop 47.

Bird pointed out that “Prop 47 likely sent a signal to law enforcement to reprioritize their resources away from arrests for drug possession toward more serious offenses.”

Fresno police chief Jerry Dyer underlined this point. “Whenever you have laws that take away your ability to arrest certain individuals for a felony, and you know there’s no room in the jail for misdemeanants, you shift your resources [toward] violent criminals.”

For George Gascón, San Francisco’s district attorney, “Prop 47 is a mild beginning of a process where we go back and see where we want to put public resources.” He pointed out that the negative impact of high rates of incarceration has been felt primarily in communities of color, and added that recent crime fluctuations need to be placed in the context of historically low crime rates over the past several years.

For Dyer, reclassifying some drug and property crimes as misdemeanors means that there are “no consequences for individuals who are committing crimes.” Dyer also noted that when Prop 47 passed, local law enforcement was still adjusting to the realignment of corrections responsibilities that was enacted three years earlier. The pace of reform has felt like “trying to take a drink of water out of a fire hose.”

While the panelists had differing views on the state’s shift away from incarceration, they agreed on the importance of treatment programs for mental health and substance abuse disorders. Gascón noted that with funding from Prop 47, “communities are beginning to experiment with different ways of treating the drug addiction and mental health issues that drive many crimes.” Dyer agreed, noting that “jail is no place for people with mental health issues.”

Kate Howard, executive director of the Board of State and Community Corrections (BSCC), explained how the BSCC developed a process for allocating 65% of the money saved by reductions in incarceration to local programs. The BSCC sought input from across the state, and the grant steering committee includes several ex-offenders, whose experience with the corrections system was “instrumental.” The first 23 grants were awarded in June 2017. While it is too early to measure their impact, Howard said there is “great reason for optimism.”

Funding Measures and the June Ballot

Last week’s primary election garnered considerable statewide and national attention, with much of the focus on the governor’s race and contested congressional seats. Further down the ballot, however, voters were asked to decide on millions of dollars of local tax, bond, and fee initiatives. On the whole, these measures enjoyed considerable success across the state.

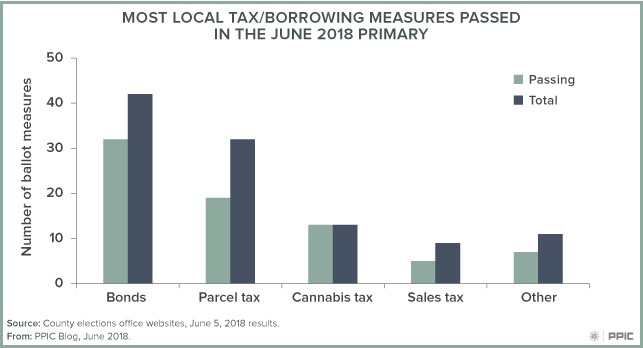
We found that Californians voted on 107 local tax, bond, and fee measures, representing the range of fiscal tools that local jurisdictions can use to raise revenue and borrow funds. Bond measures were the most popular, with 42 different local governments seeking voter approval (37 K–12 school districts; 2 community college districts; 3 cities). There were also 32 parcel tax measures; those related to K–12 schools (12) and fire/public safety (10) were most common. Ballots also included proposals to impose or increase taxes on cannabis (13) general sales (9), gross business receipts (2), and hotel stays (3). And there were proposals to raise utility fees (3), business license fees (1), and bridge tolls (1).

Most of the long list of funding proposals passed—but just putting a measure on the ballot did not guarantee success. Although counties are still counting some ballots, which could affect a race or two, at this time, we observe the following:

  • Overall, voters passed 76 of the 107 measures.
  • Of the 39 school bond measures, 30 passed. Proposition 39, passed in 2000, lowered the threshold for passing school bonds from a two-thirds majority to 55%. Had these measures been subjected to the previous standard, only 11 would have passed. The 19 measures approved under the current standard increased borrowing for investment in public schools by $1.8 billion.
  • On the heels of one of the states’ worst seasons of wildfires on record, California voters held the line on parcel taxes intended to support fire protection, with only 3 of the 9 measures passing.
  • All 13 of the cannabis tax proposals passed overwhelmingly.

California touched off a revolt against taxes 40 years ago. Primary voters in 2018 generally voted for increases but were relatively discriminating in their support, depending upon the type of tax and its intended purpose. This discernment comes at a time when the state’s economy is growing and unemployment is low. It will be interesting to see what happens in November, when we expect to see even more funding measures on the ballot.

Will California’s Red Districts Turn Blue in November?

One of the important questions hanging over California politics this election cycle is the impact of Donald Trump. In the 2016 presidential race, support for Trump was soft, with some parts of the state voting Democratic for the first time in more than a generation.

This shift encouraged Democrats to target congressional seats that had previously been considered out of reach for the party. The seven Republican-held US House seats considered most competitive all voted for Clinton over Trump. Yet many of these places haven’t voted Democratic for higher office in decades. Is this Democratic optimism warranted, or was 2016 a fluke?

Tuesday’s primary can help answer this question. California’s top-two system—in place since 2012—offers a view into the partisan sentiment in these districts in a year when Donald Trump is not on the ballot. It’s more like a first-stage general election because it lets voters choose any candidate they like regardless of party.

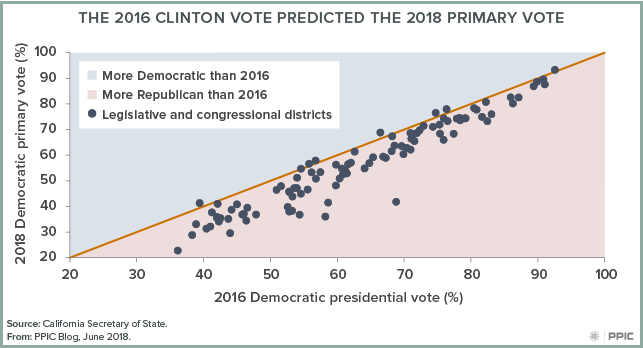
The figure below compares the share of the two-party primary vote for Democratic candidates to the 2016 two-party presidential vote in the same district (primaries without at least one candidate from each major party have been omitted). Each point is a state legislative or US House seat. The more the points cluster in the shape of a line, the stronger the correlation between the two votes. But any point above the line has a 2018 primary vote that is more Democratic than its 2016 presidential vote, while any point below is more Republican.

This figure tells us two things. First, the 2016 presidential vote predicts the 2018 results quite well. As the Democratic presidential vote increases, the Democratic primary vote in 2018 climbs as well. Moreover, the slippage in this relationship (and there is some) is about as large as in previous top-two years.

Second, the Democrats underperformed Clinton’s 2016 vote in almost every district. This too is consistent with the past. Democrats have underperformed the presidential vote in every primary under the top-two system. In fact, the underperformance was actually a little smaller this year than the average. This suggests it’s normal for Democrats to look bad in the primary season, and that it’s no reason for Democrats to be worried or Republicans to be excited.

However, this tells us less about the fall outcome than it might appear. The party vote in the general election usually shifts Democratic, but the magnitude of this shift varies a great deal. It was quite large in 2012: a seat with a 50 percent Democratic outcome in the primary on average voted 56 percent Democratic in the general. But in 2014 there was almost no change at all, and in 2016 the fall outcome was slightly more Republican.

Thus, for Democrats these results are a mixed bag. On the one hand, there are signs that the Trump effect in California has staying power. On the other hand, the consequences for this fall’s election are not altogether clear. The Democrats probably won’t do much worse on average than they did on Tuesday. But beyond that it’s difficult to say, and the consequences for individual seats will have to wait until Election Day.

A Preview of the California Governor’s Election

The people have spoken and the November election for governor has been decided: Democrat Gavin Newsom will face off against Republican John Cox. Let’s look at recent PPIC surveys to help us understand the determining factors of this outcome and the political dynamics that will surface in this fall’s matchup.

In the weeks before the June primary, the May PPIC survey found that Newsom was his party’s favorite in a race with the four major Democratic contenders, while Cox was his party’s top choice in a contest between the two major Republican contenders. The election results confirmed these trends in the voting patterns of red and blue counties. What is it about these candidates that was attractive to their bases?

The primary results were foreshadowed in a January PPIC survey. When likely voters were asked about the qualifications that they are looking for in a candidate for governor, most Democrats (84%) said they wanted a candidate with experience in office, while most Republicans (65%) preferred a candidate with experience running a business. The party faithful chose the person who arguably fit their profile best—Lieutenant Governor Newsom and businessman Cox. While California likely voters favor elected experience to business experience by a wide margin (62% to 31%), the fall election will focus on issues where opinions are more divided. This suggests a more competitive race than one might expect in deep blue California.

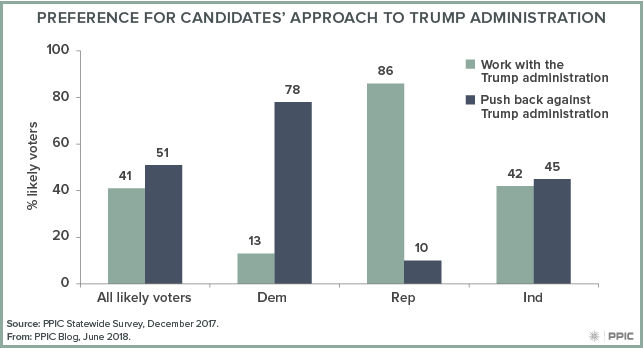
The November gubernatorial election is set in a midterm-election context perceived as a referendum on President Donald Trump and the Republican-led Congress. John Cox is endorsed by President Trump while Gavin Newsom is a vocal member of the Trump resistance. Democrats hope to flip several of the House seats held by California Republicans so that their party can take control of Congress. This election comes at a time when independents are now the second largest voter group at 4.9 million (SOS, June 1).

Slim majorities of California likely voters also say they would vote for the Democratic candidate over the Republican candidate in their House district races in both the March PPIC survey (53% to 39%) and in the May PPIC survey (52% to 38%). Democrats strongly preferred the Democratic candidate (92% March, 91% May) and Republicans strongly favored the Republican candidate (87% March, 86% May) while, again, independents are divided (Democrats: 37% March, 43% May). The independents’ turnout and leanings will thus be a focal point in House races—another reason this voter group is the wildcard in November.

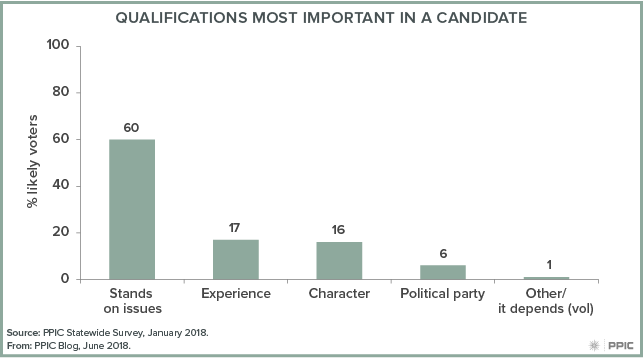
What else will Californians need to know about the two candidates? In the PPIC January survey, 60% of likely voters rank the candidates’ stands on the issues above several traits: experience (17%), character (16%), and political party (6%). Likely voters most often name the economy, immigration, and housing costs as their top issues in the May PPIC survey. Eighty-two percent of likely voters say that the candidates’ performances in public debates will be important in determining their vote for governor.

PPIC has invited the two gubernatorial candidates to participate in a public conversation with me about the issues, their leadership, and vision for California. Stay tuned for more information about when and where it will take place, and how you can attend or watch this special PPIC event.