English Learners and the New State Tests

California’s K–12 students struggled on the new statewide Smarter Balanced assessments (SBAC) last year. The results highlight the challenges facing students and teachers as the state shifts to computer-based tests on new curricula with higher standards for achievement. Disadvantaged groups like low-income students and English Learners (ELs) saw much lower achievement levels than their peers, and many of the state’s 1.4 million ELs could have a harder time getting reclassified as fluent in English due to tougher testing.

Reclassified ELs are among the best performing students in the state. They consistently outperform continuing ELs and often have higher achievement levels than English-only students. Policymakers are interested in helping ELs with sufficient English skills transition more quickly out of English Learner programs, increasing their access to academic instruction in other subject areas. In the past year, 11% of English Learners—about 155,000 students—were reclassified. Altogether, almost 2.7 million students—about 43% of the state’s total enrollment—are current or former English Learners.

The State Board of Education’s guidelines for EL reclassification incorporate student performance on the state standards tests and English proficiency tests, as well as parent consultations and teacher evaluations. However, districts’ testing requirements often exceed the state’s suggestions. PPIC research found that the state’s prior assessment (the California Standards Test, or CST) was a significant hurdle for English Learners to clear in order to be reclassified. The SBAC may make this hurdle even higher.

To estimate the percentage of students who might meet their district’s reclassification criteria following the shift to SBAC, we analyzed the results of a PPIC survey on reclassification policies. This survey collected data from 300 districts, which together serve more than half of the state’s students. When moving from the CST to the SBAC, the share of students who would have met their district’s reclassification criteria falls considerably. Overall, between 45% and 64% of ELs would have met their district’s criteria on the CST, but only 16% to 26% would have met the standard on the SBAC.

This chart illustrates the share of ELs meeting reclassification standards by the rigor of their district’s CST reclassification requirement. Districts that required a CST level of Basic for reclassification would see a substantial drop in ELs meeting this standard, with 65% of students meeting the reclassification standard under CST, compared to 21% under the analogous SBAC standard. Districts with more rigorous criteria would see the share of students meeting their reclassification standard drop even lower when moving from the CST to the SBAC—from 40% to 17%.

With the new Local Control Funding Formula and the adoption of the Common Core State Standards, much of California’s K–12 education system is in flux. There are several changes looming for EL reclassification policy as well. For example, federal law now requires that the state establish uniform standards for every district, and the Smarter Balanced tests could make it much more difficult for ELs to meet the basic skills criteria for reclassification. Additionally, recent research suggests that relying solely on the English language proficiency test may suffice to determine whether a student can succeed without additional EL supports. Given the changing landscape and emerging research, the timing is right for state and district educators to reassess EL reclassification policy, ensuring that criteria are set to maximize academic success for both English Learners and reclassified students.

Source: Authors’ calculations based on California Standards Tests 2012–13 results and California Assessment of Student Performance and Progress 2014–15 results.

Note: The CST and SBAC use different achievement levels. We consider CST’s Basic and Proficient as analogous to SBAC’s Standard Nearly Met and Standard Met, respectively. About 45% of districts require that ELs score at or above Mid-Basic to be reclassified. However, due to insufficient data, the share of students who would meet that standard on the SBAC is not shown here.

Calculating High School Graduation Rates

We are republishing this blog post to correct the number of students in the Class of 2014 who are not counted in a school graduation rate and the graduation rate of alternative high schools. As a result, the impact of including alternative school student data in the graduation rates of regular high schools also changes.

The federal Every Student Succeeds Act (ESSA), which was recently signed into law by President Obama, aims to offer states more flexibility in designing K–12 accountability programs than they had under No Child Left Behind. But one of ESSA’s lesser known provisions—a requirement that states identify and assist high schools with graduation rates below 67 percent—might force California to revise the way it deals with graduation rates at alternative high schools. Currently, the California Department of Education (CDE) excludes students attending most of the 640 alternative high schools across the state from its graduation rate calculations. Alternative schools—also known as district continuation schools, county community schools, and district and charter alternative “schools of choice”—are designed to help dropouts, students with behavior problems, pregnant or parenting teens, and truants. About 75 percent of the students at alternative high schools are juniors and seniors, according to CDE data.

ESSA requires states to calculate “cohort” graduation rates—which involve tracking students from 9th through 12th grade. The cohort graduation rate means something different at alternative schools than it does for regular schools. Students often transfer to alternative schools because they are struggling in school. CDE also reports that students attend alternative schools for an average of less than four months. Even so, CDE assigns students who transfer to alternative schools to those schools’ cohorts. Since CDE does not calculate graduation rates for most alternative schools, 59,300 high school seniors—or 12 percent of the Class of 2014—are excluded from statewide data (although these students are usually included in their districts’ graduation rates).

There are two main options for including all students in California’s school graduation rates. First, graduation rates for alternative schools could be published, although it is likely that their rates would be much lower than those of regular schools—and would fall below ESSA’s 67 percent threshold. According to PPIC estimates, alternative school graduation rates average about 37 percent, far below the statewide rate of 81 percent. The problem with this option is that, given the role alternative schools play in helping at-risk students, these low rates do not necessarily mean that alternative schools are underperforming.

The other option is to include alternative school students in the graduation rates of their “home” high schools. After all, students generally spend most of their high school years at their regular high school, attending alternative schools for short spells. In fact, excluding a large proportion of at-risk students from the calculation of school graduation rates does not accurately represent the performance of the state’s high schools. Using 2013–14 data, we estimate this option would reduce “regular” high school graduation rates an average of 6 percent. CDE’s current graduation rate methodology appears to be at odds with the federal approach to accountability. It also makes it more difficult for educators, parents, and other interested community members to get accurate information about the success of local schools. Moreover, the methodology creates an incentive for educators to send low-performing students to alternative schools. Thus, there are several important reasons to revisit the way CDE calculates school graduation rates.

Good Timing for New Federal Education Law

Since it passed in 2001, many states—including California—have chafed under the requirements that No Child Left Behind (NCLB) attached to billions of dollars in federal K–12 education aid. Congress voted to replace the law this week, reauthorizing those aid programs and loosening those strings—a lot. The president signed the bill yesterday.

This new flexibility comes at a good time for California. The state is in the middle of implementing a new K–12 accountability system and the new federal law, the Every Student Succeeds Act, or ESSA, gives California a chance to prove that its approach to improving schools can work—without running the risk of losing federal money.

NCLB and subsequent Obama administration programs dramatically increased the federal role in K–12 education, particularly when it came to accountability. NCLB required most students to take tests in math and reading every year. The results of those tests were used to determine whether or not a school was successful. Failing schools were required to take certain actions. If a state didn’t follow the rules or couldn’t make progress in improving its failing schools, it risked losing federal funding.

While NCLB provided a one-size-fits-all approach to accountability, the new law lets each state devise its own system, as long as it meets some core criteria:

It took eight years of legislative wrangling to produce ESSA. During that time, the message from state education chiefs was consistent: We believe in accountability, but give us the flexibility to do it our own way. They now have that flexibility, and with it, the responsibility to demonstrate they can hold schools accountable.

Luckily, the new federal law appears to mesh well with California’s plans for its accountability program. The State Board of Education is currently working to align its program with the eight state priorities defined in the Local Control Funding Formula (LCFF), which determines how state money is allocated to schools. The board has suggested that it will discontinue the Academic Performance Index—which ranked schools on a scale from 200 to 1,000, based on student scores on state proficiency tests—and replace it with a “dashboard” of indicators that will provide information on the LCFF priorities.

It would be a welcome development if California could merge its state and federal accountability programs. In our 2014 report, Designing California’s Next School Accountability Program, we found that separate state and federal measures were confusing and sent mixed messages to educators and the public. An approach to accountability that uses multiple measures and incorporates LCFF performance data could fix that problem and generate more accurate and useful accountability information. But there are critical steps for the state to take, including:

  • Ensuring data are accurate. The law calls for valid and reliable indicators of student or school performance, so that data can be compared across schools and districts. Currently, we do not have definitions of several of the LCFF indicators, including student suspension and graduation rates, that allow good comparisons.
  • Focusing on what’s most important. There are twenty-two performance measures across the eight state priorities in the LCFF. The state can help schools by including only the most important goals and measures in its new accountability program.
  • Supporting the local improvement process. More resources and attention should be given to developing a robust program of technical assistance for schools and districts. The state needs to recognize that local educators do not always know how to accomplish state goals. In fact, our report on LCFF implementation finds that the problem of technical know-how includes activities such as planning and budgeting to support school improvement.

While the fit between the new federal law and the Local Control Accountability Plan approach is promising, the new ESSA also raises questions about using a dashboard of indicators to assess school performance. The ESSA requires states to intervene in the lowest performing 5 percent of schools. State board members have been quoted as saying that the new system will not reduce school performance to one number—as the API did. It will be interesting to see how the state identifies schools that need improvement, since a dashboard approach implies using multiple measures of performance.

The passage of ESSA recognizes that using the states as laboratories of democracy is a robust approach to school accountability. California, with LCFF, has already started its experiment. The new federal law requires state accountability plans to be ready by school year 2017–18. The state board will be spending a lot of time in the lab until then.

Video: PPIC Survey Examines Election Landscape

As California heads into an election year, the PPIC Statewide Survey looks at residents’ views on a broad range of issues that are already flashpoints in the presidential primary races and will likely surface in statewide campaigns next year.

PPIC research associate Lunna Lopes presented the survey’s key findings at a Sacramento briefing last week. She was joined by Mark Baldassare, PPIC president and CEO, for a question and answer session afterward. He noted a link between Californians’ “modestly optimistic view of the economy,” their belief that there is income inequality in the state, and their attitudes about which ballot issues are important. Twice as many residents say that increasing the state minimum wage is very important than say legalizing marijuana is very important.

“In California, the belief that this state is divided into the haves and have-nots—and the feeling among many Californians that they are among the have-nots—are going to be driving forces in the election,” he said. The survey briefing was held just after the mass shooting in San Bernardino, and the briefing touched on Californians’ views about gun laws. PPIC research associate David Kordus provided findings from the September survey on this issue: Compared to adults nationwide, Californians are more likely to favor stricter laws than we have now. Most also say that controlling gun ownership is more important than protecting the right of Americans to own guns.

Video: Governing in a Time of Change

At a time when economic, environmental, and demographic forces are changing California, Governor Jerry Brown’s chief aide, Nancy McFadden, was asked to describe three administration priorities requiring bold leadership.

The first priority is keeping the state on a fiscally stable road, she told PPIC president and CEO Mark Baldassare before a Sacramento audience last week. This requires tough choices, she said, as the governor demonstrated when he vetoed bills that were worthy ideas but had budget implications for the state General Fund.

“Sometimes bold leadership means saying no,” she said.

Second, the administration will continue to implement the far-reaching changes adopted in past years, such as corrections realignment and the Local Control Funding Formula for schools, which targets money to the state’s neediest students and shifts funding control to the local level.

McFadden said the third priority is the “whole panoply of climate change and environment issues facing not only our state but our world.” Extreme weather events—drought, wildfires, and flooding—pose immediate challenges that have to be managed.

McFadden’s conversation with Baldassare was followed by a panel discussion about leadership—what it takes and when elected officials have demonstrated it. The panelists were Jim Brulte, chair of the California Republican Party and former state senate Republican leader; state senators Loni Hancock and Carol Liu; and Darrell Steinberg, chair of the California Government Law and Policy Practice at Greenberg Traurig and former senate president pro tem. The moderator was John Myers, Sacramento bureau chief of the Los Angeles Times.

Video: Higher Education & Our Economic Future

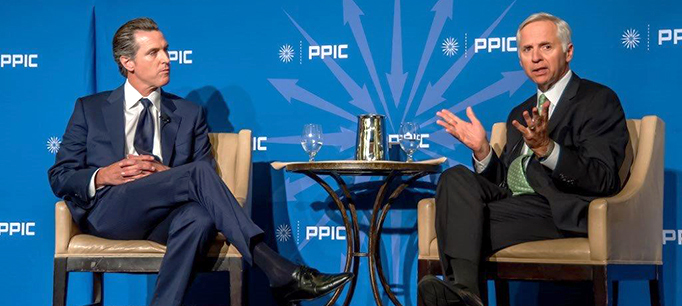
“The world is radically changed,” Gavin Newsom, California’s lieutenant governor, told a Sacramento audience this week.

“We’re competing against billions and billions of people, not just competing against cheap labor now, but against cheap genius,” he continued.

Newsom—who is also a University of California regent and California State University trustee—spoke in a conversation with Mark Baldassare, PPIC president and CEO. PPIC’s new report Will California Run Out of College Graduates? provided the context for the discussion. The report concludes that California will fall 1.1 million college graduates short of economic demand by 2030, if current trends persist.

Newsom said that “there is not a major industrialized nation in the world that is not focusing with intention on radically transforming their education system. One of the remarkable things about California is that we do not have a plan.”

He summed up: “We need goals. And we need to be able to measure those goals. And those goals must emanate from the state itself.”

Newsom was not the only speaker at the PPIC event to use words like “radical” and “revolution” to describe changes needed in higher education.

At a subsequent panel discussion, state assemblymember Catharine Baker said she is concerned that the state is falling short of the workforce needed even now. She noted that there is bipartisan agreement in the legislature that higher education is important but not about the need for major change. “There is a lot more focus on issues around the margins, that is, on how many students are we admitting, what few changes we can make in the community college system.”

Eloy Ortiz Oakley, superintendent-president of the Long Beach Community College District, said, “We almost need a revolution in our system. We started to get there when we were in crisis mode.”

“During the recession, we saw more creativity than ever before in the community college system and we began to focus,” he said. “I fear that post-recession that focus will start to dissipate.”

Hans Johnson, coauthor of the PPIC report and PPIC senior fellow, said the big challenge for the state is replacing the retiring baby boom generation with young, well-educated workers.

“I think there is a very clear path to closing that skills gap,” he said. “We need to have more students going to colleges—especially four-year colleges. We need improve completion rates—that opens up room for more students. We need to improve transfer rates from community colleges to the four-year colleges. And if we do all of those things—and these are all decisions we can make, as policymakers and higher education officials—we can actually close that skills gap.”

Timothy White, California State University chancellor, said CSU can do its part to fill the workforce skills gap—with the help of its educational and funding partners. He called the PPIC report “a very sobering clarion call that is of crisis proportion— not for the CSU or for the University of California, or the community colleges, but rather for California. And I hope we take it with the seriousness that it deserves.”

Why Students Found New Tests Tough

Recently the California Department of Education released the first results from the new Smarter Balanced Assessment test (SBAC), the standardized tests that were administered in spring 2015 to public school students in grades 3 through 8 and 11. As PPIC reported in a recent post, educators were not surprised to learn that proficiency rates in math and English language arts fell, relative to prior tests. However, when polled last April, a majority of public school parents (71%) had expected students to do at least as well on these new tests as they did on the state’s previous standardized tests.

There are a variety of explanations for why students did not do as well, but it is as yet impossible to untangle which, if any, is the primary driver.

  • The new Common Core State Standards (CCSS) have changed the testing landscape.The test is based on the new standards, which are intentionally more challenging. This would logically lead to lower rates of proficiency.
  • The CCSS have not been fully implemented yet. California is still fairly early in the implementation process, and administrators, teachers, parents, and students are all getting used to the new standards, curricula and materials, and teaching methods. Implementation of any new program takes time. Mike Kirst, president of the State Board of Education, has suggested that full implementation of the CCSS might be completed by 2019.
  • The SBAC test is harder. Both tests rely on multiple choice questions to gauge what students know. The new test also uses open-ended questions that require students to analyze, solve problems, and explain their answers.
  • The test is different than other tests students have taken. It is given online instead of with paper and pencil and it is adaptive rather than the same for all students. This means that if a student answers a question correctly, the next question will be a bit harder but if the student answers incorrectly, the next question will be easier. Students may not be used to using computers for testing and may be experiencing enhanced testing anxiety due to the changes in format and content. In addition, recent PPIC research indicates that not all schools and districts are at full capacity with regard to the computer technology needed to seamlessly test all students.
  • Teachers don’t know what is on the test. Scores on the state’s previous tests may have been inflated because of “teaching to the test,” which reportedly occurred frequently in the old testing regime. With its open-ended questions and adaptive approach, the SBAC test is designed to resist teaching to the test.

California is not the only state to see lower rates of proficiency on the SBAC. Other states, including Connecticut, Delaware, and Washington, have experienced the same phenomenon of lower rates of proficiency. In contrast, Kentucky has seen an increase in its proficiency rates. In some states, even if proficiency rates were low, state policymakers reported being pleased that the results were not as dire as had been expected based on field tests of the SBAC.

The CCSS and SBAC represent a way of guiding California’s K-12 system that addresses shortcomings in the previous standards and tests. Educators have learned that the standards need to encourage teachers to help students use what they learn to answer real-world questions. They also have tried to design the SBAC tests so they no longer drive instruction, but simply provide a snapshot of what students can do. The 2015 SBAC scores represent a starting place for this new regime, and the scores reflect that fact.

Inspiring Civic Engagement

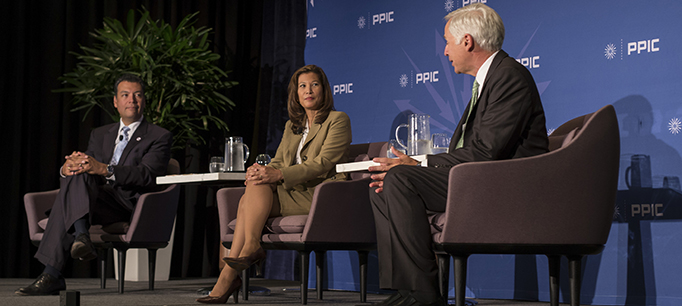
Many eligible Californians don’t register to vote, turnout in statewide elections has reached record lows, and PPIC surveys show many residents are disengaged from state government. What can be done to increase participation in elections and engage residents more broadly in all aspects of civic life? Tani G. Cantil-Sakauye, California’s chief justice, and Alex Padilla, California secretary of state, offered their responses last week in Los Angeles at an event co-sponsored by PPIC and the California Community Foundation.

In a conversation with Mark Baldassare, PPIC president and CEO, both emphasized the contribution schools can—and should—make to civic engagement.

Cantil-Sakauye noted that her teen-agers were taught civics in the second semester of his senior year in high school. “Now, think back where you were mentally in your second semester of senior year,” she told the audience. “Not the best place.”

She described Power of Democracy, a judicial branch initiative that includes Padilla and is an effort to elevate the status of civics education. Rather than focusing on teaching civics as a stand-alone subject, the group helps to integrate it into all school subjects, school projects, and community service. Partnering with Tom Torlakson, state superintendent of public instruction, as well as organizations and school districts, Power of Democracy provides schools the resources to do so, she said.

Padilla and Cantil-Sakauye each described personal experiences that sparked their interest in government and the people who had been influential along the way. Padilla said that after his freshman year at MIT, he returned to Los Angeles and visited his high school government teacher, who told his former student, “You’re 18 years old now. Have you registered to vote?” Then the teacher pulled out a voter registration form from his desk. “He wouldn’t let me leave until I filled it out,” said Padilla. That teacher, Alex Reza, was in the Los Angeles audience at last week’s event.

Cantil-Sakauye said she developed an interest in how decisions are made and who makes them after hearing adults in the Filipino community talk about their frustrations with government. When she was 9 years old, her family lost their home in an eminent domain proceeding. Cantil-Sakauye said her mother went to court and came back feeling “disrespected and humiliated.” Later on, her mother took her to see the pioneering Filipina lawyer, Gloria Megino Ochoa. “My mom threw me an elbow and said, you could do that!”

College Readiness and the New State Exams

Last week, California released the results of the new statewide tests aligned with the Common Core State Standards for students in grades 3-8 and grade 11. The 11th-grade test—from the Smarter Balanced Assessment Consortium (SBAC)—is designed to measure whether students are on track to be ready for college and careers after graduation. In fact, the CSU and community colleges can use scores from the test to determine if students are ready for college level courses. The results show that about half of 11th-grade students are at least conditionally ready for college level courses in English and less than a third are ready for college level math courses.

The fact that most 11th-grade students are not yet ready for college is not necessarily news for California. Since 2004, California students have been able to participate in California’s Early Assessment Program (EAP), which used an optional statewide test to determine college readiness levels of 11th-grade students. The college readiness identification component of the new tests is based on the EAP and informs 11th grade students whether they are ready, conditionally ready, or not ready for college.

We cannot directly compare the test results to see if students have improved, as the EAP was optional for all students and the math section was only offered to students in advanced math courses, meaning a large portion of students were untested by the EAP. But the two tests are similar in that they show that a majority of high school juniors are likely not ready for college in both English and math. The new test data does show that a large majority of students are now tested in English and math, meaning more students now know whether they are ready for college level work.

But there is also some good news here for California. For students, new ratings regarding college readiness come early enough for the information to help before they enroll in their 12th-grade classes. Prior research on the EAP suggests that the optional testing helped lower the likelihood that a student would need remediation. Now, because the SBAC test is mandatory, almost all students in California will know whether they are ready for college or need to make improvements during their senior year.

This year, over 90,000 more students than last year were given a rating of “conditionally ready” in English. This will give them an opportunity to avoid remediation in college, by taking a prescribed 12th-grade English class and receiving at least a C grade.

And while it might seem that informing almost 200,000 more math students that they are not ready for college would be discouraging, prior research on the EAP suggests that a “not-ready” rating did not discourage students from enrolling at a CSU. Finally, the SBAC can serve as one of multiple ways for students to demonstrate college readiness. Research suggests that using multiple measures—rather than relying solely on a placement exam—can keep students from being misdirected into remediation.

For the state, the new test provides a benchmark by which to measure future progress and a way to compare across states. Of the eight states that have released test scores, California is 4th and 5th in the proportion of students who are at least conditionally ready for English and math, respectively. As more states release their scores, California will have a clearer picture of how well it is preparing high school students for college on a national scale.

Chart notes: Data from the EAP and CDE websites. The number of students in each category of the SBAC are estimated from the total numbers tested and the percentages given by CDE.

Students Struggle on Test of New Standards

California gave its first statewide tests aligned with the Common Core standards last spring. The scores have just come out, with 40% of fourth-graders scoring proficient or better on the English Language Arts (ELA) test and 35% doing so in math. Scores for 8th and 11th grade are somewhat higher in ELA and lower in math. This new test is called the Smarter Balanced Assessment.

The share scoring proficient or higher on the new test is lower than on the old test, the California Standards Test (CST). In the final year that students were tested using CST—and on the old state standards—67% of fourth-graders scored proficient or higher. Most public school parents (71%) expected students to score at least as well on the new tests as on the old ones, according to a recent PPIC Statewide Survey. But most educators did not. Here’s why: the Common Core standards are more demanding than California’s old ones, students and teachers are in the early years of transitioning to these standards, and what it means to be proficient on the new test is different than on the old one. California is not the only state finding that the first year of Common Core testing reset perceptions of student performance.

To the right we present results for the CST and the Smarter Balanced tests, alongside California students’ scores on the National Assessment of Educational Progress (NAEP), a national ongoing assessment of what children know in a variety of subject areas. While these three test results are not directly comparable because each measures competence relative to different standards and each has its own definition of what it takes for a student to score “proficient,” it is important to have a clear sense of how our students are faring on each. The Smarter Balanced test results for each student group are higher than the NAEP, but low relative to the most recent CST.

We find gaps in proficiency for economically disadvantaged students and English Learners (ELs). Each group is specifically targeted for higher funding levels by the Local Control Funding Formula (LCFF). The CST gaps between EL and white students (61%) and between economically disadvantaged and white students (31%) are both smaller than those for the Smarter Balanced test (79% and 54%, respectively). Gaps for the NAEP are somewhat larger than in the Smarter Balanced tests. Educators will not be surprised by these findings.

California’s public school system has seen dramatic changes in recent years, and the 2014–15 Smarter Balanced test results are an important baseline to measure how these changes are affecting students. In the past, California students’ test results improved almost every year that the CST was administered. Today, both the Common Core State Standards and the LCFF aim to improve outcomes for all students and close achievement gaps. Multiple years of Smarter Balanced test results will be needed to monitor progress. These new higher standards are meant to improve outcomes well beyond secondary schooling, and the least advantaged students have the farthest to go. The new curriculum and new funding should help get them there.

Note (TOP CHART): NAEP is given to a representative sample of California students. FRPL refers to students who qualify for free or reduced price meals. Source: 2012-2013 California Standards Test, 2012-13 National Assessment of Educational Progress, and 2014-15 Smarter Balanced Assessments.
  
Note (BOTTOM CHART): We calculate the percentage gap by subtracting EL and economically disadvantaged students scores from white student scores and dividing by white students’ scores. Source: Authors’ calculations from the SBAC, NAEP, and CST.