Last month, as high school seniors were beginning to apply for college, the US Department of Education released its yearly scorecard to help students and their parents make informed choices. In addition to information on graduation rates, access, net price, this year’s scorecard includes earnings data for former students. The earnings profiles will be especially helpful—until now, students, parents, and the public lacked access to official information about earnings nationwide. They may also help hold colleges accountable for student outcomes.
The new earnings data is exciting—but not perfect—so it is important to determine what it actually tells us. The US Department of Education—which administers financial aid, mostly in the form of Pell Grants and federal student loans—generates the earnings profiles by linking its data on college students who get federal aid with earnings data from the US Department of the Treasury. This covers about 70 percent of students nationwide. Of course, the shares of students receiving federal aid vary across colleges—at some postsecondary institutions, fewer than half receive it. But the scorecard’s explanation of its methodology suggests that, aside from family income, college students who receive federal aid are similar to those who do not.
Another caveat is that the earnings measure for each institution represents all students receiving federal aid who started there—including those who didn’t graduate and those who transferred to other schools or pursued post-graduate degrees.
 Still, it is instructive to compare the earnings of former students across institutional sectors. The table shows what you would see if you looked up earnings profiles for different types of California colleges. We chose colleges with median earnings that were closest to the median of each sector.
The median student who started at UC Davis earns about $8,000 more than a student from Azusa Pacific University, about $10,000 more than a student from Sacramento State. The differences among the sectors align with what we know from prior research: earnings of former students of colleges that grant bachelor’s degrees are, on average, higher than those of former students of colleges that grant only associate degrees or certificates. Moreover, research has found that students at private for-profit institutions end up with lower earnings than those of comparable students from public or private non-profit four-year universities.
 What the scorecards don’t show is that the difference between colleges is far smaller than the difference within colleges. The figure shows the variation in earnings at the same campuses included in the table above. First, note the tremendous overlap: many students who start at community college end up earning more than some students who started at UC and CSU. The difference in median earnings between the typical CSU and the typical UC is approximately $10,000. But the difference between the 25th percentiles and the 75th percentile of UC Davis student earnings is almost $50,000.
Looking at these differences alone is not enough to judge the quality of an institution. The differences that we observe across colleges might reflect differences in the type of students who enroll in different institutions, or variations in completion rates. They may also have to do with differences in the fields of study that attract large numbers of students. For example, some colleges have high concentrations of students enrolled in STEM (science, technology, engineering, and math) fields—these students traditionally go into higher-paying jobs. Other colleges may have a high concentration in less remunerative majors. Similarly, the dispersion that we observe in student earnings within institutions is likely tied to a number of factors, including fields of study and rates of completion.
PPIC research has found that a worker’s wages vary tremendously depending on his or her college major. At the high end, those with engineering degrees earn a median annual wage of $96,000. At the low end, those with degrees in education administration and teaching have a median annual wage of $57,000. The Department of Education plans to include earnings by area of study in future versions of the scorecard, and we think this will make the scorecards much more valuable to students and families.
Californians will find the federal scorecard particularly useful, since the state currently lacks a student tracking system. Many other states have maintained more robust and inclusive student tracking systems for years. These systems allow calculation of more precise earnings information by major and degree for all graduates in a state—and some states are collaborating to track outcomes and earnings of former students who move from one state to another.
In California, only the community college system provides salary information for its graduates. At a time when state and national leaders are urging that colleges and universities be held accountable, the state’s parents, students, and taxpayers would benefit from more and better information about student outcomes.

 It is easy to see the appeal of completing a bachelor’s degree in three years. For students it has the potential to produce net financial benefits. Three-year graduates are likely to reduce the overall cost of their education despite the additional costs of attending summer sessions and forgoing summer employment. And newly minted graduates can enter the job market one year earlier, presumably with greater earning potential. For schools, reducing the amount of time students take to get degrees allows them to enroll more students.
  The University of California has agreed to bring in more transfer students as part of its budget agreement with the governor. Specifically, UC has committed to enrolling one new transfer student for every two new freshman. This means that one third (33%) of entering students will be transfers system-wide and at each campus (except Merced) by 2017. It also means that unless there is funding to increase enrollment, there may be fewer places for entering freshman.



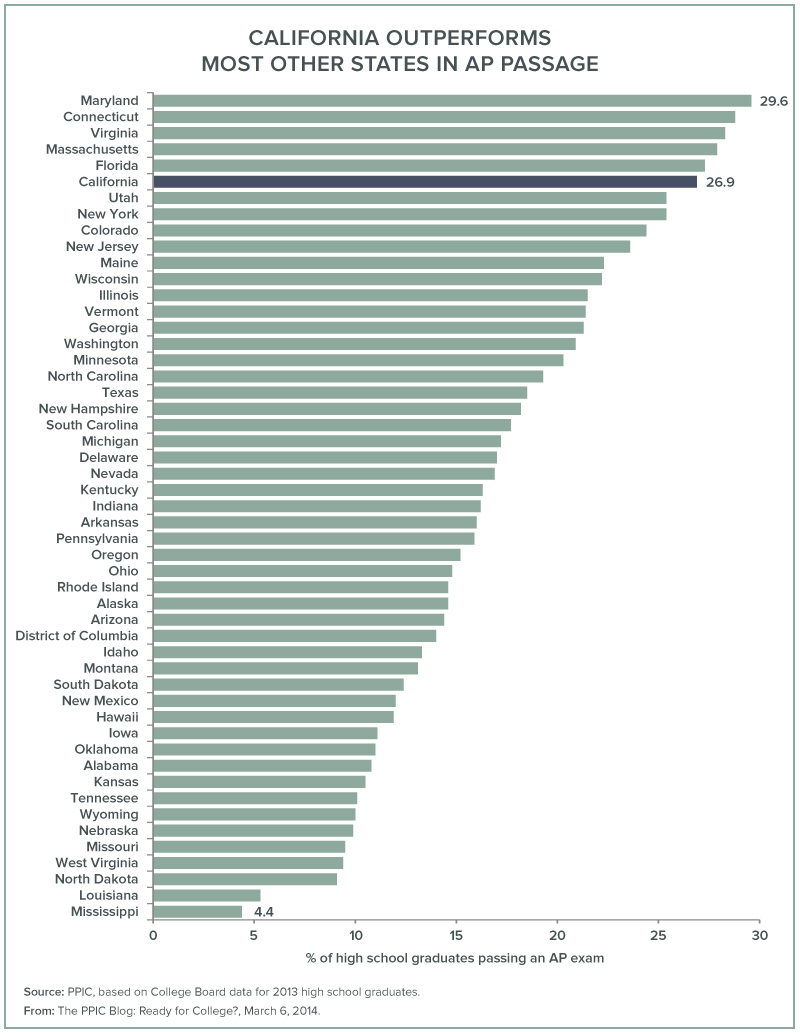
 California’s high school graduates outperform their peers in the rest of the country on AP exams. In 2013, more than one in four California high school graduates (26.9%) passed at least one AP exam sometime during high school, compared to one in five in the nation as a whole. Among the 50 states and the District of Columbia, California high school graduates ranked sixth highest. Moreover, the share of graduates successfully completing an AP exam is going up fast in California—higher than in the rest of the nation. Between 2003 and 2013, the share of high school graduates passing at least one AP exam increased 9.6 percentage points in California, compared to 7.9 percentage points for the entire nation. California has a higher share of graduates taking AP exams than does the nation as a whole (45.6% versus 35.0%), with passage rates among AP exam takers slightly higher in California (59.0% versus 57.4%).