Video: Legislative Leaders Look Ahead

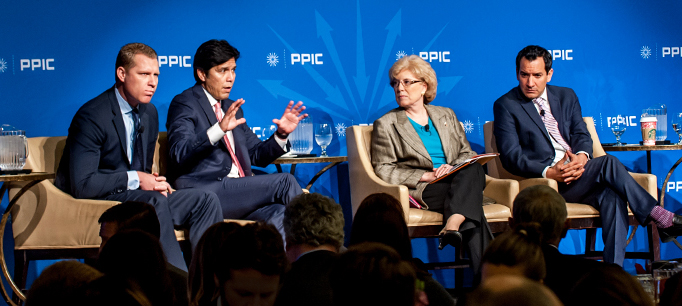
Despite their political differences, California’s legislative leaders have similar views of the state’s most pressing challenges. In a conversation facilitated by PPIC this week in Sacramento, the two top legislators from both major parties provided a preview of the issues they expect to tackle this session. With the impact of federal policy changes still unclear, the legislative leaders focused on longstanding challenges.

Asked to list the top issues the legislature and governor need to work on this session, Anthony Rendon, the Democratic speaker of the state assembly, named housing and transportation—topics he heard about repeatedly as he campaigned around the state. He said he saw the impact of a housing and transportation crisis first hand when walking precincts in the Inland Empire. “If you knock on someone’s door at 7:00, 7:30 p.m., they’re not home yet. They’re still on the freeway.”

Jean Fuller, the Republican leader of the state senate, sees the top issues as affordability in California generally and jobs. “We are concerned about housing, but we are also very concerned about jobs.” She noted that in her district, which stretches from Visalia to Twenty-Nine Palms, there is double-digit unemployment.

Kevin de León, the Democratic state senate president pro tem, said the past legislative session had been particularly productive; he highlighted minimum wage, gun safety, and climate change legislation. In this session, he said, “we have to deliver on the issues of housing and transportation and the issue of economic growth.”

For Chad Mayes, Republican leader of the assembly, poverty is the number one issue in the state, which has the highest poverty rate in the nation. “If you use that as a performance measure for how well our board of directors—the state legislature—is doing, I think you’d have to say we have been failing.” He added: “We’re failing, in large part because of housing costs.”

The speakers acknowledged major policy differences. But they pointed to past successes in bridging them as a sign that they can do so again.

“Things are not broken here, in comparison to DC,” said de León.

Understanding the New Federal Water Law

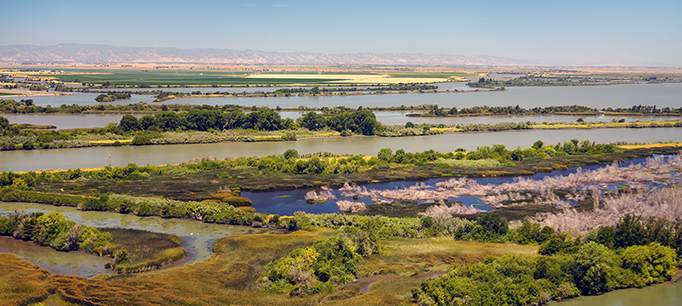
A new law signed by President Obama in December alters federal water policy in the Sacramento–San Joaquin Delta. These changes are complicated, and their likely effects on both future water supply and environmental stewardship are largely unknown.

The legislation is part of the Water Infrastructure Improvements for the Nation Act, which authorizes water-related investments around the United States. It includes funding for an array of projects in California, such as flood protection in the Sacramento Valley, watershed restoration and water quality improvements in the Lake Tahoe Basin, infrastructure for water recycling and desalination, and new surface water supply projects. It also includes funds for new fish hatcheries, acquisitions of water and land to support aquatic habitat, and programs to control invasive species that exacerbate the threats to endangered species. Before these projects can receive these federal dollars, Congress will also have to appropriate funding for them.

The most controversial aspect of the new law is a change in the way federal fisheries agencies must balance water supply for farms and cities with protection of endangered fish species in the Delta—including the Delta smelt and most species of salmon and steelhead. Under the authority of the Endangered Species Act (ESA), these agencies write “biological opinions” about how the projects must operate to minimize harm to ESA-listed species. The biological opinions that currently govern the operation of the federal Central Valley Project (CVP) and California’s State Water Project (SWP) prescribe a flexible range of allowed water exports. The new law requires the agencies to revise several terms of the biological opinions to “provide the maximum quantity of water supplies practicable” to CVP and SWP contractors “without causing additional harm to the protected species.”

Proponents of this change believe that the existing biological opinions require the projects to leave more water in the Delta than the fish need for their survival, especially during periods of high flows. Opponents believe that the legislation will add to the accumulating stresses on the fish and increase their risk of extinction. The actual benefits and risks of the operational changes are difficult to predict.

The amount of additional water the new law will make available to CVP and SWP contractors is uncertain—though it is likely to vary considerably with hydrologic conditions. We estimate that the projects may have been able to export several hundred thousand acre-feet of additional water during high flow periods in 2016—a year with average precipitation. However, it is unlikely that significant additional water would be made available during dry years—such as 2014 and 2015—when water supplies are especially scarce. In such years, most of the uncaptured flows through the Delta are needed to repel salinity and protect the quality of the water that is exported to farms and cities.

The risk of the new legislation to endangered fishes is also unknown. The existing biological opinions allow for flexible responses to account for rapid changes in water flows and temperature, information about fish locations, and new knowledge about how water supply operations affect fish. This flexibility acknowledges the uncertainties inherent in protecting endangered species in a complex and highly variable Delta ecosystem. By removing this flexibility, the new law has the practical effect of removing the margin of error in a complicated and error-prone system.

The latest drought has shown that removing flexibility in how we manage water for vulnerable species can increase the risk of extinction. How the fisheries agencies will strive to maximize water exports while avoiding additional harm to the protected species is an open and vexing question. Much depends on how the new federal administration chooses to interpret and administer the new law. And, as is often the case in California water policy, much depends on the inevitable legal challenges to its implementation.

This post was revised on January 27, 2017.

Learn more

Read a Statement by President Obama on the Water Infrastructure Improvements for the Nation Act
Read California’s Water: The Sacramento-San Joaquin Delta (from the California’s Water briefing kit, October 2016)
Visit the PPIC Water Policy Center’s Delta resource page

The News on Student Debt Is Not All Bad

Californians are rightly concerned about the costs of attending college and the amount of money many students need to borrow in order to pay those costs. In a recent PPIC Statewide Survey, 57% of Californians identified lack of college affordability as a big problem. An even larger majority—78%—agreed with the statement that students have to borrow too much money to pay for a college education.

As college costs have risen, the share of students taking out loans has grown substantially in both California and the nation. Just ten years ago, only about one-third of freshmen at four-year colleges and universities in California took out loans compared to 44% in 2014. Equally troubling is the growing size of those loans. Even after adjusting for inflation, average loan amounts for freshmen increased 14% in California between 2004 and 2014 (from just over $6,000 to almost $6,900). Among graduating seniors at California colleges in 2015, cumulative student debt totaled just over $24,000 for those who took out loans.

But not all of the news is bad. There are some encouraging and newly emerging trends in student debt, especially in California.

  • Over the past few years the trend toward more loans and higher loan amounts has reversed, with declines in both the share of freshmen taking out loans and the amount borrowed. In California, the share of freshmen at four-year colleges taking out loans has declined from 48% to 44%, and average loan amounts (adjusted for inflation) have declined from over $7,700 in 2010 to under $6,900 in 2014.
  • Student debt remains lower in California than in the rest of the nation, with California freshmen less likely to take out a loan (44%) than their counterparts in the rest of the nation (54%). Among those who do borrow, loan amounts are lower in California ($6,851) than in the rest of the US ($7,014).
  • The vast majority of students in California attend public colleges, and these students are much less likely to take out loans than students at private colleges. Very few California community college students take out loans, and less than 40% of freshmen at UC and CSU take out a loan, compared to more than 50% of freshmen at private nonprofit colleges and 70% at private for-profit colleges. Among those who take out loans, the amounts borrowed are also lower at California’s public colleges. Graduating seniors in 2015 at UC and CSU who took out loans had a median cumulative debt of $16,600, compared to $23,400 at private nonprofit colleges and $30,500 at private for-profit colleges. The lower rates of student debt at California’s public colleges and universities are related to institutional and state policies that provide scholarship and grant support to many low- and middle income students.
  • Finally, and perhaps most importantly, strong job prospects for college graduates, especially in California, mean that the vast majority of students are able to pay back their loans. Loan default rates are very low for students graduating from the state’s public and nonprofit private universities. Students at private for-profit colleges fare much worse. They often accumulate large amounts of debt, and this—coupled with low graduation rates—often makes it a struggle to pay back their loans.

It is important to remember that loans are an important and useful source of financial aid for many students. Indeed, taking on debt can be a very smart economic choice if it allows a student to enroll in and complete college. Policymakers and educators should seek to provide more opportunities for students to strategically use loans to reach their educational goals. Student debt becomes a problem when graduates are not able to pay back their loans—especially if they received a low-quality education and/or took on an exorbitant amount of debt. These are outcomes we should work to prevent.

Learn more

Read Higher Education in California: Making College Affordable
Read the PPIC Statewide Survey: Californians and Higher Education
Visit the PPIC Higher Education Center

From Drought to Deluge

The recent change in the weather is prompting many Californians to shift their worry over drought to fretting about floods. That’s an understandable response to California’s volatile climate, which is the most variable in North America. Most notable this year is the return of atmospheric rivers—river-like bands of moisture that periodically stream into California, often from the tropics. These storms are responsible for most of our large, devastating floods. They are also critical for our water supply, providing roughly half of our precipitation in normal and wet years. When atmospheric rivers don’t occur, we usually have a drought.

Here are a few key takeaways from this welcome stretch of wet weather:

  • This is likely to be the end of the surface-storage drought for most of the state. In other words, by next week almost all the major reservoirs will be at or above their seasonal averages (there’s a good summary here)—conditions we have not seen in six years. This is great news since reservoirs are the primary source of water for cities and farms.
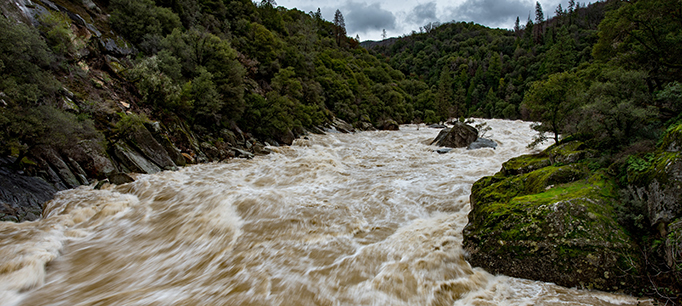
  • Many multipurpose reservoirs—those that supply water, hydropower, and flood storage—are well above historic averages. To maintain their flood management capacity for future winter storms, these reservoirs are required by federal rules to release large amounts of water, which is why so many rivers below dams are running high.
  • It is reasonable to be optimistic that our reservoirs will fill this spring. We rely on melting snowpack to top up reservoirs in the spring and to provide roughly a third of the state’s water supply in an average year. The warmth of the weekend storms washed away some of this snowpack, particularly in the middle elevations of the Sierra Nevada (5,000–7,000 feet). Still, higher elevations accumulated a great deal of new snow with these storms, and more than two months remain in the winter snow season.
  • One wet year is not a drought buster. During the height of the drought, the state’s farmers and others turned to groundwater pumping to make up for surface water shortages. The water deficit in our aquifers is now immense. For example, in 2014 and 2015, surface water supplies to farmers in the Central Valley were cut nearly in half, causing them to make up most of this reduction through additional groundwater pumping or land fallowing. It would take many successive wet years—and more intentional groundwater capture and storage—to restore aquifers to the condition they were in before the onset of drought.

The wet beginning to 2017 is a welcome relief from the past five dry years. Full surface reservoirs take pressure off water users and water regulators. But the rains did not wash away California’s major water challenges. There are big decisions ahead—many to be made this year—about how to sustainably manage groundwater, improve storage, resolve the problems of the Delta, and arrest the decline of our native fish and wildlife. Maintaining momentum on these issues is as critical now as when the reservoirs were low.

Learn more

Read California’s Water (PPIC briefing kit, October 2016)
Visit the Policy Priorities for California’s Water YouTube page
Visit the PPIC Water Policy Center flood resources page

Photo by Carson Jeffres


California’s 4.5 Million Trump Voters

In the November election, California voters passed several ballot initiatives acting on liberal priorities, and votes for Hillary Clinton in the state exceeded votes for Donald Trump by a two-to-one margin. Nevertheless, 4.5 million Californians voted for Donald Trump—7% of his total support across the country. California’s Trump voters stand apart from other voters—both those who supported past Republican presidential nominees and Clinton supporters—in important ways. But many Trump voters align with California’s Democratic majority on issues of taxation and undocumented immigrants.

California Trump voters’ low level of trust in the federal government is one of the major ways that they differ from other voters. The October PPIC Statewide Survey found that 81% of Trump voters say the federal government is run by a few big interests, wastes a lot of taxpayer money, and only does what is right sometimes (or never), compared to only 24% of Clinton voters. The large gap on these questions between Trump and Clinton voters in 2016 stands in sharp contrast to 2008, when McCain and Obama voters were about equally likely to express distrust (55% and 57%, respectively).

Yet there are some areas of overlap between Trump and Clinton voters. In California’s US Senate race between two Democrats, PPIC surveys indicate that about half of Trump voters decided not to participate. Of those who indicated they would vote, though, Trump voters were about evenly split between Kamala Harris—preferred by most Clinton voters (58%)—and Loretta Sanchez. In October, we found a noteworthy 22% of Trump voters saying they would vote for Harris, who was ultimately the winner of the seat.

Another winner in November was Proposition 55, which extended a tax on high incomes in California. While Clinton voters were far more likely than Trump voters (75% to 24%) to say they favored the tax extension, a quarter of Trump voters said they would vote yes. It’s likely that many of them contributed to the success of the measure, which passed with 63% support.

Immigration is another policy area with some notable overlap in opinions between Trump and Clinton supporters. Although Trump voters were far more likely than Clinton voters to support building a wall along the border with Mexico (82% to 7%), a majority of Trump voters (52%) agreed with the 95% of Clinton voters who said undocumented immigrants should be allowed to stay in the country if certain requirements are met. As California policymakers consider potential responses to a change in federal immigration policy, it will be interesting to see how Trump’s voters feel about new federal and state action.

Though California remains a Democratic-majority state, millions of Californians voted for the president-elect in November. While there are large differences in opinion between them and Clinton supporters, neither group is monolithic, and our survey findings suggest some potential areas of cooperation between them.

Learn more

Find out more about the PPIC Statewide Survey

A State of Water Independence

The presidential election has raised questions about how changes in federal environmental policy could affect California’s water resources management. Concerns include the potential loosening of endangered species protections and changes to federal regulatory jurisdiction under the Clean Water Act. These questions are especially pronounced in California, where the United States is both an environmental regulator and operator of several of the state’s largest water projects.

While there are areas of uncertainty, California’s water rights and environmental laws are both robust and comprehensive, and thus will provide something of a firewall to changes in federal policy. Although many of these laws apply in tandem with their federal counterparts, California’s laws are also largely independent of federal environmental standards. Here are a few examples.

Reasonable use and the public trust: The California Constitution’s “reasonable use” requirement and the state’s public trust doctrine recognize a strong and continuing public interest in protecting the ecological integrity of the state’s waters. In 2009, the California Legislature declared that these principles “shall be the foundation of state water management policy.”

Water rights: The State Water Board has permitting authority over a majority of surface water rights, including those for the federal Central Valley Project (CVP) and California’s own State Water Project (SWP). These projects supply water to more than 25 million residents and businesses across the state and to almost four million acres of farmland in the Central Valley. Permit conditions require the projects to release water from reservoirs and to limit pumping from the Delta to protect water quality, fish and wildlife, and other instream uses throughout the Sacramento–San Joaquin Delta ecosystem.

Federal law directs the US Bureau of Reclamation to operate the CVP in compliance with all requirements of California law, including conditions in its water rights permits. This is an important mandate because CVP operations are coordinated with the SWP, and the two projects’ water supply and environmental stewardship functions must be synchronized.

The bureau also controls the distribution of water diverted from the Colorado River for agricultural and urban uses in Southern California. Although federal law generally governs, the State Water Board has significant authority over the use of this water through its constitutional authority to prevent waste and unreasonable use.

Water quality: The State Water Board and the nine Regional Water Quality Control Boards also set water quality standards and issue permits governing discharges of pollutants. California’s water quality laws implement the federal Clean Water Act, but they also function independently. California often sets stricter pollution limits than required under federal standards, and the state permitting system applies more broadly than its federal counterpart (covering discharges to groundwater, for example). Equally importantly, California’s water quality laws do not depend on the Clean Water Act for their existence and would continue even if significant changes are made in federal law.

California’s authority to protect its water resources will be largely insulated from changes in federal environmental policy.

Stream flows: In addition to the State Water Board’s power to protect stream flows through water quality standards and the reasonable use and public trust doctrines, the California Fish and Game Code compels all dam operators to release water to support fish. In litigation to restore flows and salmon to the San Joaquin River, the federal courts ruled that this law applies to the CVP.

Endangered species: The California Department of Fish and Wildlife has extensive authority to protect vulnerable species under the California Endangered Species Act. Although the state statute is more limited than its federal counterpart, it does prohibit the unauthorized “taking” of protected species. If federal endangered species policy were to change, the department could use this authority to place conditions on water project operations to prevent or minimize harm to state-listed species. The department also could expand the list of state-protected species to fill any gaps created by federal policy changes.

Wetlands: The federal government has extensive jurisdiction under the Clean Water Act to regulate activities that may alter wetlands, and the state and regional water boards often implement this federal law. But California also has independent authority to protect wetlands through discharge permits and land use regulations. This regulatory authority would continue even if, as expected, the new administration reduces the scope of the federal wetlands rules.

In light of these laws, California’s authority to protect its water resources will be largely insulated from changes in federal environmental policy. Of course, Congress could amend the statutes that require federal compliance with California law. But such a change would contradict a long history of federal deference to state water rights law and support for state administration of water quality protections.

These policies reflect Congress’ understanding of the benefits of comprehensive and integrated water resource management and its recognition that the states are best suited to decide how to allocate and manage water in light of local conditions and local needs. Indeed, in the recent federal legislation that changes endangered species management in the Sacramento–San Joaquin Delta, a large and bipartisan majority in both houses of Congress reconfirmed the United States’ continuing “obligation to act in conformance with applicable state law, including applicable state water law.”

Going forward, it would be extraordinary for Congress to depart from this foundational policy.

Learn more

Read California’s Water (PPIC briefing kit, October 2016) and Managing California’s Water: From Conflict to Reconciliation (PPIC 2011).
Visit the PPIC Water Policy Center’s water quality resource page.

Improving College Placement Policies

Assessment and placement policies govern where students begin their college trajectory. This is a high-stakes issue for students, affecting how quickly they achieve their educational goals. Too often, it affects their likelihood of reaching these goals at all. Students who are placed in developmental, or remedial, courses end up spending significant portions of their limited financial aid packages—and sometimes take on debt—to pay for courses that don’t usually count toward a degree.

Findings from a PPIC survey on assessment and placement policies show that California’s community colleges vary in how they identify college-ready students. First, colleges use different assessment tests. Second, even those that use the same test apply different cut-off scores, which are the minimum scores that a student must get to be designated college ready. While over half of colleges reported using the Accuplacer test to assess college readiness in math, cut-off scores ranged from 25 to 96 out of 120. Students with the median score of 58 would be deemed college ready at only half of these colleges, while at the other half, they would be placed into developmental math. This lack of consistency means that access to transfer-level courses is determined not only by students’ performance on the test, but also by placement policies at the institution where they enroll.

Unfortunately, there’s no easy fix to this problem, as opposing forces are at play. On one hand, the current approach of setting local assessment and placement policies allows for considerable academic freedom and institutional autonomy, giving colleges flexibility to respond to the local needs of the population they serve. This is particularly important for placement into developmental coursework, the structure of which varies significantly across colleges. On the other hand, locally determined cut-off scores into transfer-level courses lead to inconsistent standards and can send a confusing message to high schools around the state about what it means to be college ready.

Accordingly, placement into transfer-level courses should be uniform across the community college system. Having clearer and more uniform policies for accessing introductory transfer-level courses (e.g., college composition, college math, and statistics, among others) is critical because these courses are considered equal in the eyes of four-year institutions accepting them for transfer. Variation in the standards used to access these courses dilutes this presumed equality.

California State University (CSU) presents a compelling case study for a statewide system that has consistent assessment and placement policies for determining college readiness. Across the 23 universities in the CSU system, a common assessment and common cut-off scores are used for placement into transfer-level math and English. Yet individual campuses maintain flexibility regarding how they structure developmental education sequences and placement into these courses.

Systemwide assessment and placement policies at California’s community colleges could yield multiple benefits:

  • Eliminating barriers for students who transfer from one college to another. Clear and uniform policies for accessing transfer-level courses would begin to make students’ assessment results more portable across colleges, especially those in the same region.
  • Improving programs and support for students in developmental education. Currently, the lack of comparable data across colleges has prevented the system from measuring the effectiveness of interventions designed to increase student success in developmental education.
  • Sending a clear message to high schools about college readiness standards at community colleges. This would be akin to the uniform policy used by high schools and colleges across the state to determine college readiness as part of the Early Assessment Program (EAP).

Continuing to let community colleges determine placement into developmental education while standardizing placement policies into transfer-level courses will preserve local autonomy and help to bring about the benefits that come with systemwide uniformity.

Learn more

Read the report Determining College Readiness in California’s Community Colleges: A Survey of Assessment and Placement Policies
Visit the PPIC Higher Education Center

A Water Sector Energy Hog

When we use water, we’re also using energy—sometimes a little, sometimes a lot. Overall, water use accounts for about 20 percent of California’s electricity use and 30 percent of natural gas used by businesses and homes. This energy is used to supply, convey, treat, and heat water.

Where does it all go, and more importantly, how can we best save both water and energy?

You might guess that our long-distance transport of water through the state’s network of canals and pumping stations is a big energy hog. The federal and state water projects combined move about a quarter of all water used in California. The State Water Project—which conveys water from the Sacramento–San Joaquin Delta to cities and farms in the San Joaquin Valley, the Central Coast, and Southern California—is the largest single user of electricity. But even so, the state’s water conveyance system is something of an energy sipper, accounting for just 4 percent of the sector’s total energy use.

Or maybe you’d assume that California farmers—who use about four times more water than the state’s urban areas—use the most water-related energy. But even though farmers pump some 10 million acre-feet of water in an average year, they use just 5 percent of California’s water-related energy.

Have you guessed it yet? Hint: The state’s cities, especially California households and industries, use by far the most water-related energy—and much of it goes down the drain.

Heating water is the most energy-intensive water-related activity. Some residential “end uses” of water—faucets, showers, and clothes washers—are energy hogs, accounting for 42 percent of all energy used in the water cycle. And in total, the residential, industrial, and commercial end uses of water account for more than 85 percent of energy used in the water sector. By comparison, supplying, pumping, and treating urban water make up about 5 percent. 

Reducing the energy footprint of the state’s water cycle will require more reductions in hot water use.

A recent study, which looked at the energy use of supplying, pumping, and treating water, estimated that the energy savings resulting from drought-related urban water conservation to date has equaled the combined savings of all energy efficiency programs offered by the state’s major energy utilities. The study did not account for water heating or other energy-intensive uses of water.

California has been a leader in energy efficiency for many years. Its efforts include reducing energy use of washing machines and dishwashers—which together still use less energy than showers. Last year, the state’s energy commission adopted new standards (which went into effect this summer) that will cut water flow in showerheads by 20 percent. The move is expected to save more than 2.4 billion gallons a year in the first year—and enough energy to power more than 200,000 homes for a year.

To further reduce the energy footprint of the state’s water cycle, it would be most effective to continue to target reductions in hot water use. This can be done by changing our habits (such as decreasing water heater temperatures), improving water-heating efficiency, and reducing the energy intensity of some industrial processes.

Saving energy in the water sector also reduces greenhouse gas emissions—nearly 10 percent of the state’s emissions are directly associated with water use. California plans to reduce its emissions 40 percent below 1990 levels by 2030, and the water sector can provide some of the most cost-effective ways to meet that goal.

But as always in California’s water management, there is no one-size-fits-all solution. Local assessments—with state agencies’ support—are needed to evaluate cost-effectiveness of various solutions locally and across regions. The state could then use these assessments to devise a statewide plan for reducing the water sector’s energy consumption and greenhouse gas emissions.

Learn more

Read California’s Water: Energy and Water (from the California’s Water briefing kit, October 2016)
Visit the PPIC Water Policy Center

The Turnout Turnaround

Voter turnout in California was dismal in 2014—record lows in the primary and general elections prompted serious concern about how to turn the problem around. The state has been aggressive in adopting reforms to promote turnout—including a system for registering online, “conditional” registration, which allows people to vote after registering as late as election day, and a system to register voters mostly by default via the DMV.

The Secretary of State recently certified the vote count for the November election, and the results suggest the state is heading in the right direction. Turnout was 58.7% among those eligible to vote, easily higher than the 30.9% showing in the midterm election two years ago, but also higher than the presidential election four years ago (55.5%) and almost as high as the notably high-turnout election in 2008 (59.2%).

In fact, while low turnout in the 2014 general election put California farther behind other states, this year’s turnout almost brought the state up to the national average. As the graph shows, turnout in presidential elections has been climbing in all states since about 2000. But this is the first time that the upward trend has been stronger in California than elsewhere.

Some of this upward surge may reflect higher registration rates: the share of eligible residents who are registered rose this election year to a 20-year high. The state’s recent reforms can’t explain this increase because most of them have not been implemented yet. The exception is online registration, which went live during the 2012 presidential election cycle and has proved popular. Early evidence suggested that the new system’s overall impact on registration was small, but this could have changed over time. In any case, the higher registration rate this year might lead to higher levels of participation in the future.

There are reasons to think that the higher turnout and registration were driven by a more mobilized Latino population. Certainly, Latino registration increased this year, perhaps in response to the tone and content of the presidential campaign. And Californians voted at even higher rates for Hillary Clinton than they did for Barack Obama, something many have also attributed to increased Latino engagement. However, there is little support for this story in the county-level results. The size of each county’s eligible Latino population explains almost none of the variation in turnout this year. In fact, the higher turnout this year was evenly distributed across the state.

Despite the signs of increased engagement, it is too early to say the state has come out of its turnout slump. As the figure makes clear, turnout in presidential elections is not the state’s biggest problem. The challenge is and has been midterm turnout. A growing share of the voters who participate in presidential elections do not vote in the gubernatorial election two years later. The last two election cycles—which have seen exceptionally high presidential turnout and exceptionally low midterm turnout—have not departed from this pattern but exemplified it.

The state should be proud of the progress made this election, and there are grounds for optimism as the state rolls out its election reforms over the next few years. But the positive signs from this election cycle should not make policymakers complacent about the challenges that lie ahead.

California’s Marijuana Majority


Mark Baldassare, PPIC president and CEO and director of the PPIC Statewide Survey, spoke at the Pacific Chapter of the American Association of Public Opinion Research annual conference in San Francisco today, December 16, 2016. Here are his prepared remarks for a post-election panel discussion.

One of the most historic turnarounds in California initiative history has been largely overlooked in the wake of the stunning presidential election results. Californians passed a recreational marijuana initiative this fall after rejecting a similar effort six years ago. The 2010 initiative, Proposition 19, failed with 46.5 percent of the vote. This year, Proposition 64 passed with 57.1 percent. How did support grow by 10.6 points, allowing this controversial policy to move into the victory column? The answers are found in both national and state trends.

First, Americans’ views on marijuana legalization have shifted in recent years. When asked in Pew Research Center national surveys, “Do you think the use of marijuana should be made legal or not,” fewer than 50 percent said “yes” in 2010 and 2011 while a majority have said “yes” since 2013. Two key events happened in 2012: Washington and Colorado voters passed initiatives to legalize recreational marijuana. Alaska, Oregon, and Washington, DC, voters followed in 2014. This November, Massachusetts and Nevada—and perhaps Maine, depending on a recount underway—joined California voters in legalizing recreational marijuana.

California public opinion mirrors these changing national attitudes. PPIC surveys have been repeating the Pew Research Center’s question for six years. In our surveys, the percent of adults saying “yes” to legalizing marijuana was below 50 percent before November 2010, when Proposition 19 failed. Support for legalization edged up to the majority in 2013. Some Californians apparently changed their minds about marijuana legalization after other states passed initiatives.

Did California’s marijuana legalization pass because its base of support grew stronger? Or because its appeal expanded to more demographic groups? The answer is “both” when we analyze the final PPIC surveys before the November 2010 and November 2016 elections. These surveys were within close range of the election results (44% Proposition 19, 55% Proposition 64) with a comparable 11-point difference between 2010 and 2016. We compare the likely voters who said “yes” to Propositions 19 and 64 across parties, political, and demographic groups.

The only majority supporters of Proposition 19 in 2010 were Democrats, liberals, and Californians under 35 years old. This fall, there were double-digit increases in the yes vote for Proposition 64 among Democrats, liberals, and residents under age 35. The consolidation of support in these groups was important in the 2016 California election context. This presidential election attracted a larger electorate with liberal leanings than the 2010 gubernatorial election did. That is reflected in the passage of several progressive reform and tax initiatives this November, as noted in an earlier PPIC blog post.

Significantly, there were also double-digit increases in the yes vote for Proposition 64 in likely voter groups where Proposition 19 had previously fallen short. Notably, independents, moderates, and 35- to 54-year-olds joined Democrats, liberals, and younger voters to form a broader political and demographic coalition of Proposition 64 supporters this fall. Moreover, support grew from less than 50 percent in 2010 to include solid majorities in 2016 among men (47% to 64%), college graduates (47% to 61%), those earning $80,000 or more (46% to 60%), and whites (44% to 55%). In sum, Proposition 64 attracted more of a political mainstream following than Proposition 19 did.

Proposition 64 still did not win by a landslide even with these impressive gains in the depth and breadth of support. Fewer than 50 percent in key demographic groups supported the initiative. They include Republicans (33%), conservatives (31%), Californians age 55 and older (45%), Latinos (47%), women (48%), and the non-college educated (49%). Obviously, many Californians did not jump on the bandwagon and vote for marijuana legalization this year.

Finally, it is worth noting that when we asked voters if the outcome of the vote on Proposition 64 was very important to them, opponents of legalization were more likely to say “yes” than supporters were (60% to 50%). These views could play a critical role because marijuana legalization still faces many hurdles. Will the deep divisions among political and demographic groups surface in local communities when it’s time to implement the new law? Will California lawmakers side with the voters who passed marijuana legalization if the Republican president and Congress change direction on federal enforcement? As always in the initiative process, voters were the deciders but they are not the last word. Now many issues are left to local, state, and federal government officials to sort out.

Learn more

Find out more about the PPIC Statewide Survey