Ecosystems Need Groundwater Too

Groundwater is a critical resource for most living things in California. But while human communities can increase groundwater pumping when surface supplies diminish during droughts, ecological systems often have no backup supply. We talked to Sandi Matsumoto, associate director of the Nature Conservancy’s California Water Program, about determining which ecosystems are particularly dependent on groundwater and what can be done to help them cope with dropping water levels.
PPIC: What are “groundwater-dependent ecosystems”?

Sandi Matsumoto: These are familiar places to everyone—wetlands, rivers, estuaries, springs, and associated plants and animals that rely on groundwater to meet some or all of their needs. They’re found in nearly all of the state’s groundwater basins and are often supported by surface waters, such as rivers and streams fed by rain or melting snow. Even deserts have them—where springs support desert oases, for example.

The Nature Conservancy has been working with California’s Departments of Water Resources and Fish and Wildlife to develop a comprehensive statewide map of vegetative indicators of groundwater-dependent ecosystems. Using plants as the prime indicators, we’ve mapped 2.2 million acres of groundwater-dependent ecosystems.

PPIC: How well do we understand the connections between groundwater and the ecosystems that depend on it?

SM: We’re definitely early in our understanding of this complex relationship. To fully understand it you’d have to get a hydrogeologist and an ecologist in the same room together—and you don’t see that pairing very often.

I like to think of rivers and streams as expressions of a healthy groundwater system. In California, rivers can flow well into summer months, long after the snowpack has melted. In areas with high groundwater levels, a lot of that river flow can come from groundwater. High levels of pumping can reverse this dynamic—when groundwater levels drop lower than the bottom of the river channel, water starts seeping into the aquifer. It’s called a “losing stream.”

Going forward, I think the Sustainable Groundwater Management Act (SGMA) will bring a much greater understanding of ecosystem conditions. By monitoring certain vegetation types we could improve our understanding even more. For example, we can look for signs of declining health in plants or changes in the number of acres of these “indicator plants.”

The trend has been a decline of groundwater-dependent ecosystems. The goal of SGMA is to stabilize things, but if groundwater sustainability agencies make a concerted effort, we may even be able to reverse the decline. For example, colleagues at the Nature Conservancy in Arizona are doing groundwater recharge projects near rivers, boosting their flow and improving conditions for riparian ecosystems. In California we’re trying to mimic seasonal wetlands by flooding farmland to support migratory birds. These kinds of projects help farmers while also providing habitat and even groundwater recharge benefits.

I also think that SGMA will force us to figure out what we care about and how to sustain those things. To get to groundwater sustainability we have to talk to each other, and experts will have to come out of their silos. If SGMA is done right, we’ll see hydrogeologists working with ecologists and other unlikely pairings. That’s what I’m most hopeful about.
The Gender Gap in California Politics

In the past year, women have led large-scale political protests nationwide and an increasing number are running for elected office. In California, likely women voters have a numeric edge over men (53% to 47%), according to PPIC’s analysis. With the midterm elections quickly approaching, will women make a pivotal difference?

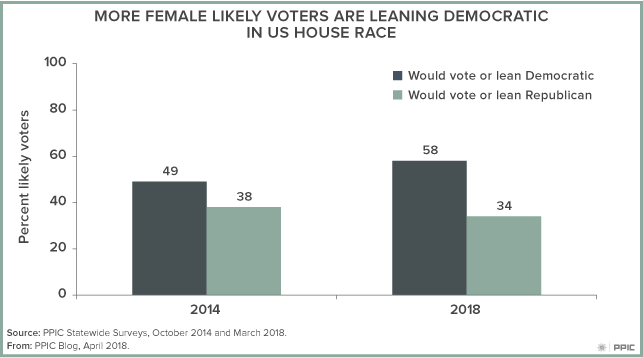
PPIC’s March 2018 survey offers some insight: nearly six in ten women (58%) support the Democratic candidate on the generic ballot for the U.S. House of Representatives—a 9-point increase since 2014. Preferences among men are unchanged.

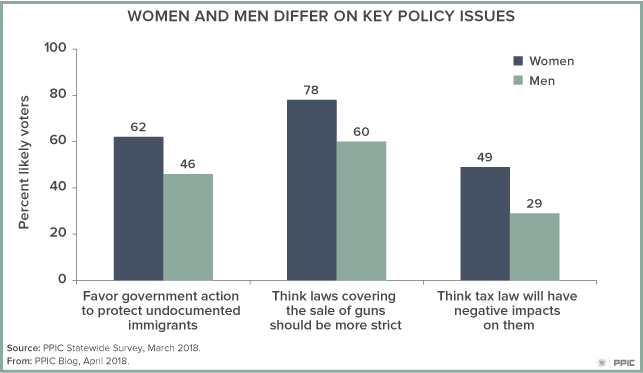
Although PPIC surveys show female likely voters are much more likely than their male counterparts to disapprove of President Trump (67% to 52%), issues like immigration policy, gun control, and taxes also reveal degrees of a gender gap. Examples include:

  • Immigration policy. Six in ten female (62%) likely voters are in favor of state and local governments making their own policies—separate from the federal government—to protect the rights of undocumented immigrants; fewer than half of men (46%) are in favor.
  • Gun control. While solid majorities of men and women think laws covering the sale of guns should be stricter, more women (78%) than men (60%) hold that view.
  • Federal tax law. Differences are also apparent between women (49%) and men (29%) who believe that the tax laws will have a negative impact on their families in the coming years.

However, it is important to note the role that party plays in policy preferences. For each of the aforementioned issues, there are sizable differences between Democratic women and Republican women. It’s also notable that among Republican likely voters, more women (54%) than men (38%) think gun laws should be stricter.

California is often mentioned as a battleground state in the 2018 elections, and tension between the federal and state governments is palpable. California’s government stands in opposition to many policies coming out of Washington and several of its congressional seats could be up for grabs—potentially determining the party that will lead the next US Congress. As a result, the nation will be watching California. And the PPIC Statewide Survey will continue to follow the perceptions and preferences of California’s likely voters, with particular interest in the gender gap.

Expanding Health Care Coverage for Undocumented Immigrants

As efforts to create a state-based single-payer health system confront complex questions of costs and federal uncertainty, advocates and state lawmakers are pushing forward with incremental policy measures to expand access to health coverage. The largest group of Californians that remain without comprehensive health insurance are undocumented immigrants, who were largely excluded from the coverage expansions created by the Affordable Care Act. Estimates suggest that almost 60% of uninsured Californians are undocumented.

Today, the Senate Health Committee is holding a hearing on SB 974 (Lara), which would allow all income-eligible California residents, regardless of immigration status, to enroll in comprehensive coverage through Medi-Cal (the state’s Medicaid program). California has already extended Medi-Cal coverage to undocumented children under 19, who have been eligible for comprehensive health benefits since May 2016. At the end of last year, nearly 220,000 undocumented children were enrolled in Medi-Cal, with costs estimated at $280 million in the recent fiscal year’s budget. No cost estimates are available yet for covering undocumented adults. But comprehensive coverage for the undocumented population must come from state funds, since federal Medi-Cal funding can only be used to support emergency services for undocumented immigrants.

In previous research, we estimated that about half of California’s undocumented population would likely qualify for Medi-Cal based on their income levels if restrictions on immigration status were removed. But this varied across regions. In Los Angeles County and parts of the Central Valley, more than half of undocumented immigrants had incomes below the Medi-Cal eligibility threshold of 138% of the federal poverty level, or FPL ($34,600 for a family of four). Bay Area counties had lower shares of income-eligible undocumented immigrants.

Currently, undocumented adults rely on the health care safety net—including community clinics, public hospital systems, and emergency departments—to access needed medical care. These providers play an integral role in caring for both those that remain uninsured and those covered by our vastly expanded Medi-Cal program. As policymakers consider ways to expand comprehensive health coverage, it is important that they continue to support the state’s safety net providers.

Testimony: Reforming Key Policies at the Community Colleges

Olga Rodriguez, research fellow at the PPIC Higher Education Center, testified before the Assembly Higher Education Committee in Sacramento today (April 3, 2018). Here are her prepared remarks:

Thank you for the opportunity to testify this afternoon. My name is Olga Rodriguez and I am a research fellow at the Public Policy Institute of California. PPIC is a nonpartisan policy research organization and does not take positions on legislation. My comments are based on research we have conducted at PPIC on California’s community colleges.

Every year, California’s community colleges identify hundreds of thousands of students as not ready for transfer-level courses in math and English. Since these courses are required to transfer to a four-year college, students deemed underprepared are placed in developmental (also known as remedial or basic skills) courses to prepare for college work. These placement decisions have profound effects: our study finds that 80% of entering students take at least one developmental course in math, English, or both, and very few of those students complete a college-level math or English course, or transfer to a four-year college after six years.

Despite the critical role of assessment and placement, historically there has been little clarity about how colleges across the state assess and place students into math, English, and English as a Second Language (ESL) sequences. The overwhelming majority of colleges do not have this information publicly available in their college catalog or on their website. To help fill this information gap, in spring 2016 we surveyed all 113 community colleges in the state; 82 of the colleges participated in the survey. They reported on the policies used to assess and place students into transfer-level math and English as well as the highest level of ESL during the 2014–15 academic year. The broad goal of the survey was to provide policymakers and practitioners with a descriptive landscape to improve understanding of the policies used across the state to assess and place students into math, English, and ESL courses. These results provide an important baseline prior to the implementation of assessment and placement reforms. I describe our findings below.

  • First, community colleges varied in how they identified college-ready students. We find that the use of assessment tests was widespread; 100% of colleges reported using assessment tests for math, English, and ESL placement. However, there was variation in the types of tests used and how they were used. For example, while more than half of colleges reported using the Accuplacer test to assess college readiness in math, cut scores ranged from 25 to 96 out of 120. A student with a score of 58 (the median score used by colleges) would be deemed college ready at half of these colleges, but not at the other half. The lack of consistency means that access to college courses—credit-bearing courses that students need in order to transfer to four-year colleges—is determined not only by students’ performance on the test, but also by the policies at the college where they enroll. This wide variation may be especially challenging for the 40% of students who eventually enroll in more than one community college campus, as they could be deemed college ready at one college but referred to remediation in another. These policies end up undermining opportunities to transfer between campuses and provide mixed signals about what it means to be ready for college-level courses. Furthermore, assessment and placement practices have implications for equity. Students of color are more likely to attend colleges that set higher math cutoff scores, which means these students have less access to the math classes they need to advance.
  • Second, the use of multiple measures was sparse and unsystematic. In California, the use of other measures in addition to placement exams (known as multiple measures) is mandated by law. In fact, research shows that measures such as high school achievement data do a comparable or better job at predicting college success compared to assessment tests. But while assessment tests were standard practice, there was substantial variation in the types of other measures used across colleges and across subjects. Additional measures included high school GPA, grades in prior English and math coursework, results from the Early Assessment Program (EAP), and counselor or instructor recommendations, among others. Overall, we find that 61% of colleges used grade in last math course, and 40% used grade in last English course; but only about one-third of colleges used high school GPA for placement into math and English courses. Even fewer colleges used these measures for ESL placement (8–12%). In addition, while some colleges used multiple measures in a systematic way for all students, up to 30% of colleges only used multiple measures if students requested it or challenged their placement. Uneven implementation of multiple measures may aggravate inequities if students with cultural and social capital are more likely to take advantage of these policies.
  • Third, assessment and placement in ESL needs more attention. Each year, about 30,000 students enroll in ESL, and these students may be especially disadvantaged by current policies. Compared to English and math, in ESL, fewer colleges offered exemption opportunities and test preparation activities. Additionally, our findings suggest that a lower proportion of colleges used high school achievement data for ESL placement, indicating that English Learners may not be benefitting from one of the most promising methods of improving placement accuracy.
  • Finally, ongoing reforms aim to promote more consistent and accurate placement policies. With the support of the governor, the legislature, and the system office, a significant amount of resources have been devoted to improving assessment and placement at community colleges. The passage of Assembly Bill 705 will help address this issue by mandating that all colleges use high school achievement data for the assessment and placement of all students. Still, if colleges have the autonomy to set their own rules for placement, and if colleges do not fully inform students of their placement rules, this will be a cause for concern as uneven access to transfer-level courses has significant implications for student success.

In sum, assessment and placement policies should help students reach their academic goals—not stand in the way of those goals. As colleges work to enhance the efficacy of developmental education, implementing evidence-based practices that accurately assess students’ college readiness will be critical. A more equitable and efficient system for assessment and placement is a vital step in helping all students achieve their academic goals.

California’s Immigrants and the 2018 Election Context

This piece is excerpted from a presentation at the USC Annenberg School for Communication and Journalism given on March 30, 2018, in Los Angeles.

Many eyes will be on California in this midterm election year, especially since control of Congress may hinge on the outcome of 10 competitive House races in the Golden State. Currently, more than a quarter of the state’s residents are born outside the US—and one in five immigrants make up what we consider likely voters in California elections. With federal immigration policy playing a lead role in today’s polarized political discussions, will California’s immigrants have an impact—and to who’s advantage—in the 2018 election?

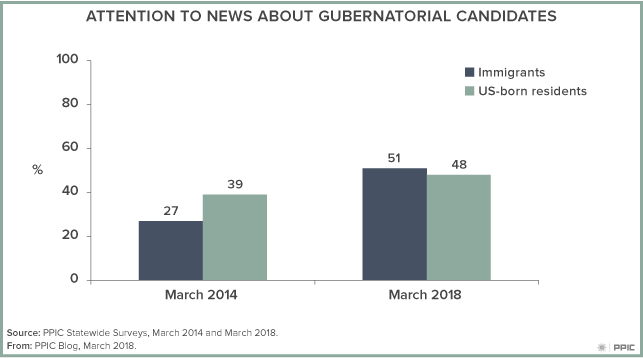
Typically, California’s immigrants are less interested in politics than their US born counterparts. But not when it comes to the 2018 election cycle. Among likely voters in our current survey, immigrants and nonimmigrants are similarly likely to be following the news about gubernatorial candidates “very” or “fairly” closely (51% immigrants, 48% US born). Both groups say that voting this year is more important than in past midterm elections (47% immigrants, 51% US born). Perhaps most telling for this year, both likely voter groups mention immigration and illegal immigration when asked about the issue that they would most like to hear the gubernatorial candidates talk about before the June primary (23% immigrants, 23% US born).

When it comes to current candidate choices, we do see some divergence between immigrant and US-born likely voters:

  • Democrat Gavin Newsom slightly trails Democrat Antonio Villaraigosa among immigrants (17% to 23%), while he is favored by three to one over Villaraigosa among nonimmigrants (30% to 9%).
  • Republican John Cox does equally well with both groups (15% immigrants, 14% US born).
  • Democrat Dianne Feinstein is favored by large margins over Democrat Kevin de León both among immigrants (50% to 18%) and nonimmigrants (40% to 16%). She has a higher approval rating among immigrants than nonimmigrants (68% to 51%).
  • Immigrants are more likely than nonimmigrants to favor the Democratic candidates in their local House races (63% to 51%) and less likely to favor the Republican candidates (30% to 41%). Immigrants also give higher approval ratings than nonimmigrants to their current local House member (59% to 51%).

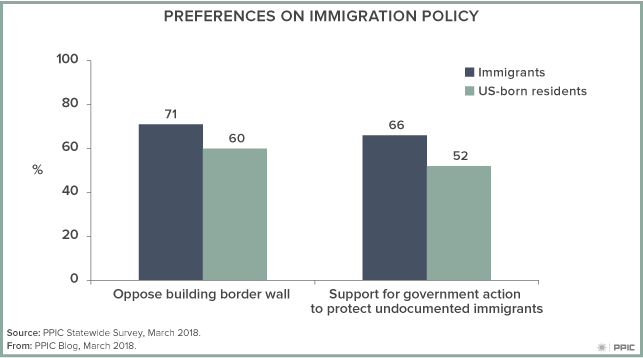
Despite these differences, immigrant and nonimmigrant Californians are aligned in their views of the current policy landscape. Majorities in both likely voter groups disapprove of President Donald Trump (63% immigrants, 60% US born), oppose the new federal tax law (65% immigrants, 56% US born), want gun laws to be stricter (82% immigrants, 67% US born), and oppose building a wall along the entire border with Mexico (71% immigrants, 60% US born). When it comes to state and local governments making their own policies and taking action separate from the federal government, majorities in both likely voter groups say they are in favor of protecting the legal rights of undocumented immigrants (66% immigrants, 52% US born).

One of the political wildcards in this California mid-term election is whether the strong opposition to federal immigration policy will motivate more naturalized citizens to vote and more noncitizens to become citizens and register to vote. As noted earlier, immigrants make up a larger share of the state’s population than is reflected in the likely voter group—leaving much room for growth that could transform the state’s electorate. The PPIC Statewide Survey will be closely monitoring the trends in political engagement and ballot choices in this consequential election for California and the nation.

Five Factors for Successful Online Learning

Governor Brown’s budget proposal requested a $100 million initial investment, along with $20 million annually, to establish a new online college that would be part of the state’s community college system. This college would initially focus on short-term certificate programs for non-traditional students ages 25–34 who are already in the workforce. In the long term, this college would seek accreditation, provide pathways to transfer to a four-year college, and compete with established online course providers like Arizona State Online and the for-profit University of Phoenix.

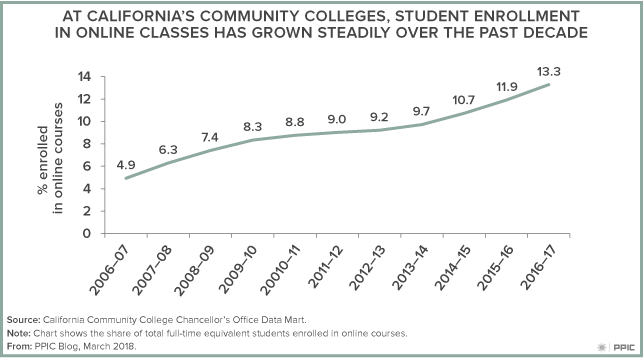
Tens of thousands of students already take online courses offered by California’s community colleges. In fact, the share of student enrollment in these courses has increased 9 percentage points over the past decade to more than 13% in 2016–17. The new online college, if established, is likely to accelerate this trend.

Previous PPIC research has identified five key factors to help ensure student success in online programs:

  1. Use a systems approach to course design. In this model, an instructional designer works with faculty, media developers, and programmers to develop an online course. This approach recognizes the fundamental differences between online and face-to-face instruction and allows instructors to focus on the subject matter and student engagement.
  2. Provide professional development. Effective online instruction requires distinct strategies. For example, to guide discussion online, instructors must gauge student engagement and develop appropriate norms without the usual visual and auditory cues. Rapid changes in technology and the isolated nature of online instruction also make professional development and mentorship particularly important.
  3. Set student expectations. There is a common misconception that online courses are easy. On the contrary, students in online courses often struggle with the autonomy, time management, and digital literacy necessary to succeed. Successful online programs use orientation courses to set expectations and clarify the differences between online and face-to-face education.
  4. Create community. Communication is essential to foster a constructive learning environment and positive peer interactions. Online courses that encourage regular and effective communication among students and between students and their instructor develop a better sense of community and improve the likelihood of student success.
  5. Take advantage of the online environment. Online tools offer unique insights not available in face-to-face pedagogy. Data on student engagement (e.g., did students view the syllabus or access additional course resources?) can provide clues for how to improve student outcomes. Online learning also facilitates personalization and can be adapted to different learning styles and special needs.

In 2013–14, the community college system launched the Online Education Initiative (OEI), which promotes these best practices and has established online course standards and faculty training in pedagogy and course design. As the state moves forward with its proposal to create a new online college, the OEI could play a key role. Overall, the line separating online and face-to-face learning is not as stark as many suppose. Most college courses already incorporate some online aspects, whether it’s an online course management system, chat room, or video conferencing. As the online and face-to-face worlds continue to merge, furthering our understanding of best practices for online instruction will be critical to student success in higher education as a whole.

How Oroville Is Changing Dam Safety in California

California’s 1,500 dams are regularly inspected and most have been safe for generations. Before last year’s Oroville Dam spillway crisis, the last dam disaster was the deadly 1928 Saint Francis Dam failure in Southern California. But the scale and drama of the Oroville crisis jolted the state into action, resulting in a stream of safety reviews, forensic analyses, and policy changes.

Within weeks of Oroville’s spillway incident, Governor Brown announced a 4-point plan to bolster dam safety and flood protection. And with the enactment of Senate Bill 92, a new dam safety regime has strengthened the state’s existing system.

We asked two experts about the lessons of Oroville for dam safety in California: Jeff Mount, a senior fellow at the PPIC Water Policy Center and an expert in hydrology and geology; and Jay Lund, director of the Center for Watershed Sciences at UC Davis, a member of the National Academy of Engineering, and an adjunct fellow at PPIC.

“First, we have to do a more complete job of assessing infrastructure,” said Lund. “We need to look for potential cascades of failures, which is what happened at Oroville. And we need to look at all of the outlet structures, which are essentially a dam’s safety valves.”

He noted that all federally regulated dams are subject to safety analysis every seven years, “yet they didn’t pick up the problems of Oroville. The lessons here are that you can never stop worrying about infrastructure and that we have to be prepared for things to fail.”

Mount seconded the need to stay vigilant, noting, “Water has a way of finding weaknesses in planning, design, and maintenance. If you miss something, eventually water will find a way to tell you so.”

Another new dam safety bill, Assembly Bill 1270, requires the state to consult with independent experts to update dam safety practices every 10 years. Lund said that will encourage the use of new kinds of technologies and practices. “But I think more important than the law itself is the culture of the people in charge of dams and dam safety, and whether they’re given the right resources and the mission to do more thorough assessments of old problems lurking in these structures.”

Mount noted that climate change is a complicating factor. “The inspections and upgrades are a good start,” he said. “But many of our dams―including Oroville―were designed more than 50 years ago. We need to evaluate how to operate them under changing hydrologic conditions.”

He added that many large dams try to fulfill multiple, conflicting objectives. “For example, a flood manager wants an empty reservoir during flood season while a water supply manager wants to fill the reservoir as much as possible. We’ll need to take a second look at how we manage dams for competing objectives and will likely face some tough trade-offs.”

Oroville also raises the question of how to pay for dam safety over the long term. “The Oroville episode will probably end up costing slightly less than $1 billion,” Lund said. “At 5% interest, that’s $50 million a year. A $50 million annual flood safety program might have avoided this. There is probably a good financial argument to increase spending on maintenance and inspection of major infrastructure.”

The 2020 Census Is Critical for California

The decennial census plays an essential role in American democracy. Most fundamentally, it ensures that communities get the right number of representatives in government. Less well known is the role it plays in determining how hundreds of billions of federal dollars are allocated to states and localities for a wide range of public services, including health care and child nutrition programs.

Although census information is essential, the Census Bureau is currently budget constrained, behind schedule, and scaling back the number of full-scale test runs it was planning. This is of particular concern since several key changes to the census process are in the works: the majority of census information will be collected online, resources for door-to-door outreach may be reduced, and a question about immigration status will be added to the official questionnaire. These and other factors increase the potential for an undercount, especially among vulnerable populations. Just today, California Attorney General Xavier Becerra has filed a lawsuit over this issue.

Why are the stakes so high? A significant undercount could cost California political representation in Congress at a time of record polarization and a deep partisan divide over the direction of the state and the nation. Critical decisions that affect California’s future will be determined to a large extent by federal rules on such issues as climate change, health care, and immigration.

An undercount also means that an important amount of federal funding could dry up. Federal, state, and local government programs that target disadvantaged neighborhoods or populations rely critically on census surveys to identify those in need and distribute funds accordingly. For example, two programs crucial to the health and well-being of children in California—the Children’s Health Insurance Program and the Women, Infants, and Children program—rely on population estimates that use the decennial census count as a baseline for population estimates with which they aim to accurately allocate funds across states.

The impact on California could be huge—and 2020 is fast approaching. At a time when objective facts and information are in short supply, PPIC will be working to raise awareness about the importance of the 2020 Census for California and motivate elected leaders and organizations across the state to work together to ensure an accurate count. Stay tuned for more facts and analysis of the 2020 Census from PPIC.

Video: Preview of the California Primary

As California’s June 5 primary approaches, the latest PPIC survey finds Democrat Gavin Newsom gaining ground over Antonio Villaraigosa in the governor’s race, while support for Republican John Cox rises among likely voters. In the US Senate race, Dianne Feinstein holds her double-digit lead over fellow Democrat Kevin de León.

Dean Bonner, PPIC associate survey director, detailed the findings at a Sacramento briefing last week.

The survey shows Newsom (28%) as the top choice among likely voters, followed by Cox (14%), Democrat Villaraigosa (12%), Republican Travis Allen (10%), and Democrats John Chiang (6%) and Delaine Eastin (5%). Yet a quarter of likely voters are still undecided, which raises questions about what will happen in the top-two primary.

A few other highlights include:

  • Governor Jerry Brown’s approval rating (54%) has held steady, despite state-federal tension over immigration policy. The legislature’s approval rating (45%) has also stayed consistent, in spite of sexual misconduct reports last fall.
  • The top issue voters would like gubernatorial candidates to talk about before the June primary is immigration, followed by guns or school safety.
  • Nearly half of Republicans (48%) are now joining an overwhelming number of Democrats (87%) and independents (68%) in saying there should be stricter gun controls.
  • Bipartisan support emerged for a water bond measure, with two-thirds of likely voters saying they would vote yes. Partisans were more divided on affordable housing projects.

World Water Day through a California Lens

Happy World Water Day―a day that brings attention and, hopefully, action to some of the world’s most pressing water challenges. This year’s theme is “exploring nature-based solutions to the water challenges we face in the 21st century.” It’s a concept that shows the deep linkages among many water problems—and the need to tackle these problems jointly.

California’s complex array of water challenges make it something of a policy lab for trying out a “portfolio approach” that addresses issues in an integrated way. Although California has one of the world’s largest economies, the state faces many of the same water problems seen around the world. Too many communities don’t have access to safe drinking water. Some critical water infrastructure is in poor shape. The state’s ecosystems are in decline, with many aquatic species hovering near extinction. To complicate things, we have an extremely variable climate—so both droughts and floods are a reality Californians live with.

Our recent policy brief, Priorities for California’s Water, provides a road map for taking on some of these challenges. The report highlights linkages among key issues and points to integrated solutions that can bring multiple benefits—approaches that are especially important in light of the changing climate.

For example, wildlife-friendly farming can support ecosystems while maintaining the economic viability of farms. Cooperation on storing and releasing water from reservoirs can benefit fish while meeting downstream users’ needs. Investing in healthy watersheds can help protect drinking water supplies and reduce the risk of extreme wildfire. Flood protection projects that reconnect rivers to their floodplains can provide fish and wildlife habitat. By capturing and treating stormwater runoff, cities can improve water quality, augment their water supplies, and enhance wetlands or open space. Across California, there are promising examples of such approaches, but they are still the exception rather than the rule.

Here at the PPIC Water Policy Center, we could be accused of thinking every day is California Water Day. But we’re happy to be reminded that there’s a global effort to tackle critical water issues and growing understanding of the linkages among the world’s biggest water challenges. Finding solutions that can work in unison won’t happen overnight. It will take creative thinking and bold action from all quarters—water managers, governments, agricultural and urban water users, community and environmental advocates, business and scientific leaders. World Water Day reminds us we all live on the same blue planet and that solutions are within our reach.