How Are School Districts Spending Their LCFF Dollars?

Since the enactment of the Local Control Funding Formula (LCFF) in 2013–14, funding for K–12 education has risen to record highs. Much of the increase is due to the improved state economy, which has seen nearly a decade of continuous growth and led to dramatic expansions in the state budget. Even so, the LCFF has significantly altered the funding landscape, with the intention of providing more resources to the districts, schools, and students who need them most. Six years in, what can we say about how this system is faring?

Under the LCFF, districts with more high-need students (those who are low income, English Learners, homeless, or foster youth) have seen larger funding increases. Between 2013–14 and 2017–18, high-need districts (those with student populations that are at least 55% high need) increased student spending more than $500 more per-pupil than did lower-need districts (where fewer than 30% of students are high need). Districts with especially large shares of high-need students (80% or 90%) saw an even greater funding increase under the new funding formula.

Are higher-need districts spending differently than lower-need districts? We can address this question by comparing the changes in spending between 2012–13—the year prior to LCFF’s enactment—and 2017–18, the most recent year for which K–12 financial data is available.

The data reveal two patterns of note. First, despite greater total increases, spending on teacher salaries actually grew more in lowest-need than in the highest-need districts: $570 per student in the lowest-need districts (where fewer than 30% of students are high need) vs $495 in the highest-need districts (where more than 80% of students are high need). Higher-need districts hired more teachers and saw greater reductions in teacher-pupil teacher ratios. However, a greater reliance on novice teachers (whose salaries are lower) reduced the overall spending increase among these districts. Benefits spending also increased by much more in higher-need districts, mainly due to the greater increases in staffing levels.

Second, higher-need districts have been spending more on support staff and other non-teaching staff. They have also spent more on services, materials, and other student spending (excluding capital outlay, debt service, pre-K, and adult education): these expenditures increased by $822 per student in the highest need districts, as opposed to $336 in the lowest need districts. Higher-need districts are most likely attempting to address the additional challenges that higher-need students face outside the classroom. The hope is that these additional services and support staff will translate into improvements in academic performance that will narrow achievement gaps. Research on similar reforms in other states suggests that this approach will eventually pay off.
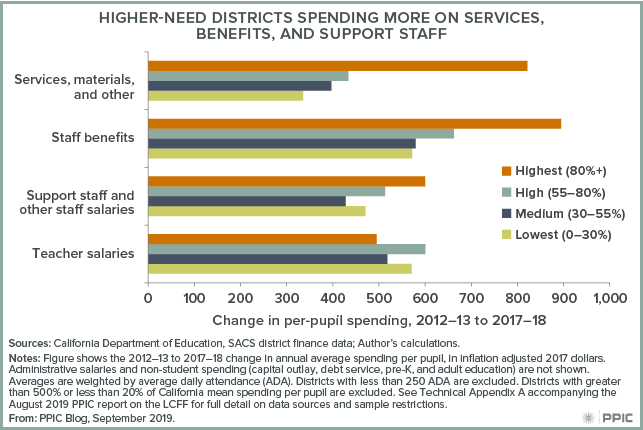
figure - Higher-need Districts Spending More on Services, Benefits, and Support Staff

Currently, however, concerns are growing about whether additional funding is reaching the highest-need students within districts. Because districts are not required to report their school-level spending publicly, it is difficult to assess how this funding is allocated within a district. However, public staff records and salary schedules do allow us to examine differences in teacher spending across schools in the same district. Such comparisons show that districts tend to spend more on their highest-need schools but that the difference is modest.

Fortunately, federal requirements will soon make more comprehensive school-level spending data available. While we don’t yet know how accurate and comparable it will be, this data will bring new and much-needed transparency to our K–12 finance system.

Integrating California’s Education Data

[vc_row][vc_column][vc_column_text]California needs an integrated data system that connects pieces of the education pipeline that are currently maintained separately.  An integrated system could perform a variety of critical functions and reach a diverse audience of stakeholders. For example, it could provide feedback to educational institutions on student outcomes, even after students graduate. It could also encourage better planning and coordination between educational sectors, increase the state’s ability to evaluate educational programs and policies, and provide students and families with better information about successful educational and workforce pathways.

The state has recently invested $10 million toward planning for this type of system, establishing the California Cradle to Career Data Systems Working Group to “recommend data system structural components, processes, and options” and to “advise ongoing efforts to develop, administer, and enhance the data system” (per Senate Bill 75).

The Public Policy Institute of California has also been focused on this issue, facilitating a group of research and policy organizations interested in the establishment of an integrated student data system in the state. Known as the California Education Data Collaborative, this group has met regularly throughout this year to discuss the opportunities and challenges associated with advancing education through connected data.[/vc_column_text][/vc_column][/vc_row][vc_row][vc_column width=”1/2″][vc_column_text]

The collaborative’s activities are designed to build knowledge and skills among diverse stakeholders involved in improving access, equity, and success across California’s educational systems. As a collaborative, we have engaged with national experts, leaders in successful data systems from other states, policymakers from California, and those with experience in working for an integrated data system in California.

As the state’s California Cradle to Career Data Systems Working Group takes shape, the collaborative is working to:

  • Engage with stakeholders—including students, parents, educators, and institutions—about how to implement a data system that best serves them.
  • Connect with policymakers to ensure that the data system answers critical questions about policies and programs to foster student success.
  • Provide research and advice on how to construct a system that will improve California’s education systems.
  • Examine issues of privacy and security to ensure confidentiality of student records.

[/vc_column_text][/vc_column][vc_column width=”1/2″][vc_column_text css=”.vc_custom_1567624867972{padding-top: 20px !important;padding-right: 20px !important;padding-bottom: 20px !important;padding-left: 30px !important;background-color: #384763 !important;border-radius: 4px !important;}”]

PPIC’s California Education Data Collaborative

California Competes
California College Guidance Initiative
California EDGE Coalition
California Policy Lab
Cal-PASS Plus
The Campaign for College Opportunity
Children Now
CORE Districts
Education Insights Center
The Education Trust- West
First 5 LA
Policy Analysis for California Education
Public Advocates
Public Policy Institute of California
Strategic Education Services
The Institute for College Access and Success
WestEd
[/vc_column_text][/vc_column][/vc_row][vc_row][vc_column][vc_column_text]Establishing an integrated, longitudinal student data system will take a multifaceted, sustained approach. In the long run, the value of this system will lie in the policy questions that can be asked—and answered with confidence—and the ability of practitioners, students, and families to access information that helps them make informed choices. To assess reforms accurately and comprehensively will require strong partnerships, clear long-term planning, identified goals—and good data.[/vc_column_text][/vc_column][/vc_row]

Video: School Resources and the Local Control Funding Formula

The Local Control Funding Formula (LCFF) was enacted in 2013-14 with three major goals: to simplify California’s K–12 school finance system, increase local control over spending, and provide additional funding to districts with large shares of high-need students—those who are low income, English Learners, homeless, and/or foster youth. At a lunchtime event in Sacramento last Thursday, PPIC researcher Julien Lafortune shared key findings from a new report that looks at increased spending under the LCFF. Then, a panel of experts offered state and local perspectives on the successes and challenges of directing funding to high-need students.

The PPIC report offers new statewide evidence on how school resources have been affected by LCFF; it also examines the extent to which these resources are reaching the highest-need students. It finds that LCFF funding is, for the most part, reaching the high-need students for whom it was intended. But the funding formula imperfectly targets high-need students in lower-need districts.

Kent Kern, superintendent of schools for the San Juan Unified School District, highlighted the challenges of serving high-need students in a district with wide disparities across schools. At 54.5%, his district’s share of high-need students is just below the LCFF’s “high need” funding threshold; however, 19 of its 64 schools have shares of high-need students that are 80% or above. “One of my schools that’s actually at the 99th percentile is a mile away from a school in another district. If we received the same funding as that district got, [our] school would be generating $1.4 million more.”

Not surprisingly, Kern would welcome a change to the LCFF that could benefit the high-need students in his district: “I think there would be some threshold that would allow schools with high-need concentrations to get more money.”

From a statewide perspective, however, the LCFF’s district-level approach is important. Michael Kirst, professor emeritus at Stanford and a key LCFF architect, emphasized the importance of providing additional funding to districts with the highest concentrations of need, to help them address particularly difficult educational challenges: “I would continue to support the theory of concentration, though I realize there are tradeoffs.” Samantha Tran, senior managing director at Children Now, pointed out that when the LCFF was being developed, many stakeholders were concerned that a school-level funding model could create perverse incentives: “If a border line could be drawn that allows for deeper concentration that draws down more state dollars . . . that is not the policy we want in place. We don’t want to perpetuate segregation.”

Asked what they would change about the LCFF, Kirst and Tran agreed on the need for more money as well as greater transparency on spending. Kirst noted that “it takes more than money” to retain teachers and improve student outcomes, but there are clear links between spending and achievement. And Tran said that while she has “no interest in bean counting,” the state needs a clearer understanding of trends in spending and outcomes.

From both the state and the local perspective, the LCFF has been successful in focusing attention on high-need students. As Tran put it, “We’re actually having a conversation about high-need schools . . . that’s a success.” One of the biggest challenges, from Kern’s perspective, is that people expect “too much change too fast. . . . I think we just need to stay the course.”


A New Look at College Enrollment Rates

California’s K–12 districts and schools are responsible for preparing students for college and career. But until recently, data has not been available to determine their success in actually getting students to apply to and attend college. Now, however, the California Department of Education has published data on college enrollment among recent high school graduates, using information from the National Student Clearinghouse. Initial findings show wide disparities in college enrollment across racial/ethnic groups and throughout the state’s regions—including within school districts themselves.

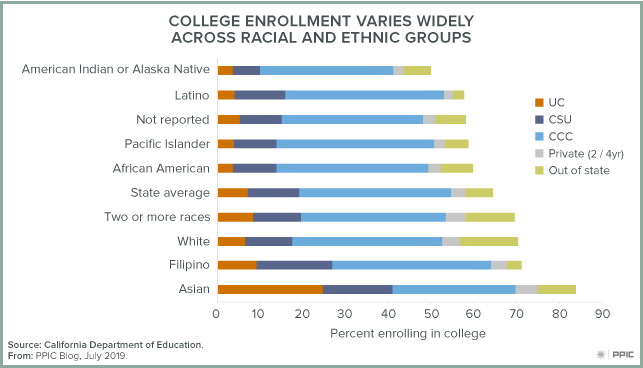
According to the data, about 65% of California’s high school graduates attended college within a year of graduation in 2017–2018 (the most recent data available). But there are wide differences. For instance, Latino students—the majority of K–12 students—have a relatively low rate of college enrollment (58%), while rates for Asian American students (84%) are quite high. Asian American students are also much more likely to attend a University of California campus than other students. African-American students have a similar enrollment pattern as Latino students, except many more opt to go to college in another state. White and multi-racial students also enroll in out-of-state colleges or universities at rates above the state average.

Figure - College Enrollment Varies Widely Across Racial and Ethnic Groups

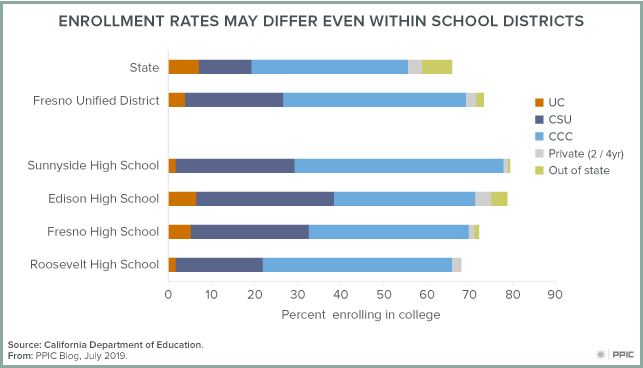
Differences by school, district, and region are also available in the data (you can check your local district’s college enrollment rates here). Fresno provides a good example. Fresno County has higher college enrollment rates than the state, but students are much less likely to attend a UC and much more likely to attend a CSU or community college—perhaps because of the strong presence of Fresno State and local community colleges, as well as the greater distance to most UC campuses.

Figure - Enrollment Rates May Differ Even Within School Districts

Among the many districts in Fresno County, students from Fresno Unified School District are relatively more likely than others to attend college. But there is plenty of variation within the district. Sunnyside High has very high enrollment rates; however, rates are lower than the district average for UC and much higher for community college. By contrast, Edison High has much higher than district average enrollment at UC, private, and out-of-state schools.

Enrolling in college or university is a goal for many high school students. But because the existing K–12 and higher education data systems are not linked in California, this is the first time in over a decade that the state has good information about whether high school students are meeting that goal. With the passage of SB75, California has begun the process of building a statewide longitudinal data system that will connect the existing student data systems between K–12 and higher education. The new enrollment data provide the first glimpse of the promise of a connected education data system. Linking data across segments could yield useful new information—such as whether students were successful in their college courses—which would fit nicely in the state’s dashboard on college readiness.

K–12 Education and the New State Budget

The recently enacted 2019–20 budget allocates 28% of the total state budget for all K–12 education programs: $103.4 billion ($58.8 billion from the General Fund). Proposition 98, passed by the voters in 1988, establishes a minimum annual funding level for K–12 schools and community colleges. This year, the Proposition 98 funding level is $81.1 billion, bringing K–12 per-pupil expenditures to nearly $12,000. According to the Department of Finance, total per-pupil funding, including all federal, state, and local sources amounts to $17,423.

In addition, the rainy day fund requires the state to set aside savings for future education spending based on specific criteria, including General Fund tax revenue and Proposition 98 funding levels. This year, for the first time ever, the budget triggers a deposit into Public School System Stabilization Account at $376.5 million.

figure - K-12 Funding Is at a New High

The Local Control Funding Formula (LCFF) is the primary manner in which funds are distributed to support students. This year’s budget brings the total LCFF funding to nearly $63 billion, a $1.9 billion increase from last year, accounting for a statutory cost-of-living adjustment.

This year’s enacted budget also includes funding to address a wide range of concerns, including pensions, special education, and full-day kindergarten. For teacher pensions (CalSTRS), the budget pays down the state’s ($2.9 billion) and the districts’ share ($1.6 billion) of the unfunded liability. Another $500 million for fiscal year 2019–20 reduces by 1.03% school districts’ contribution rate to CalSTRS and CalPERS (pensions for public employees). The budget adds $350 million to reduce that contribution rate by an additional 0.7% in 2020–21.

The budget aims to mitigate rising special education costs to districts by adding more than $600 million to support students with disabilities.

A $300 million one-time payment goes to the Full-Day Kindergarten Facilities Grant program, which allows districts to construct new facilities or retrofit preexisting ones for the purposes of ensuring access to full-day kindergarten.

Despite the record funding level this year, two longer-term finance issues loom. The CalSTRS funding plan, as governed by AB 1469, has set school districts’ share of teacher pension costs to increase to 18.1% in 2019–20 and to 19.1% by 2020–21. While the budget’s funding toward the districts’ contribution rate will provide much-needed relief, growing pension costs will remain challenging.

Finally, in a time of growing costs, declining student enrollment is hampering districts across the state. Over the past five years, nearly half of all districts experienced enrollment losses—and this trend may continue over the next decade. Given that the state’s funding model is based on average daily attendance, declining enrollment is likely to persist as an important fiscal issue over the long run.

Budget Takes Baby Steps Toward Special Education Reform

The new 2019–20 state budget recently signed by Governor Newson provides significant new funding for K–12 special education programs. It also makes substantial revisions to the state funding model for services to students with disabilities—and signals policymakers’ intent to make even more extensive changes in this policy area next year.

Passage of the Local Control Funding Formula (LCFF) in 2013 generated questions about the fiscal and planning effects on local special education programs. Our work in this area (in 2016 and 2018) has found that district special education costs have risen much faster than state funding over the previous decade and has recommended several changes to make state funding more responsive to local costs. The new state budget includes two of our key recommendations:

  • Equalize special education funding. This year, $153 million was added to partially equalize per-pupil special education funding levels. Our report recommends equalizing local per-pupil funding rates up to the 90th percentile of current levels. Funding rates across Special Education Local Plan Areas (SELPAs) range from about $500 per pupil to more than $1,000. The new funding would bring the lowest local rate up to $557, which is about the 75th percentile of existing rates.
  • Fund early childhood special education. Another $493 million in this year’s budget will provide grants of about $9,000 for 3- and 4-year-olds who participate in special education preschool programs. State special education formulas fail to provide any state support for these children, and our reports conclude that the lack of funding could discourage districts from aggressively seeking children who could benefit from early services.

Because the new funding helps districts pay for their existing special education programs, these appropriations provide welcome fiscal relief. But the budget attaches a giant question mark to the long-term future of these new appropriations. Specifically, in 2020–21, the budget makes the two new grants conditional on broader special education reforms, and even holds out the possibility of revising those grants. Issues for further discussion include:

  • More changes to special education funding. Problems with the main special education funding formula were not addressed in this year’s budget. We have suggested the state peg annual budget increases to a better predictor of future costs, such as LCFF increases or past changes in special education costs.
  • Refining the role of SELPAs. We have also suggested giving districts greater leeway in determining how students with disabilities are educated, consistent with LCFF’s local control focus. SELPAs perform a wide range of services locally, including planning how students are served and supporting district special education programs that exhibit sub-par performance.
  • Improving local special education programs. The budget identifies two specific areas for attention: serving more students in their regular classroom (rather than in separate special education classes) and ensuring that student subgroups are not identified for special education in disproportionate numbers. By including this issue in the budget language, policymakers are signaling they want faster progress in these areas.

Interview: Filling the Gaps in California’s Education Data

California is one of only a few states without a database showing how students advance from K–12 schools to college and into the workforce. As part of his “cradle to career” initiative, Governor Newsom has proposed $10 million to develop such a system.

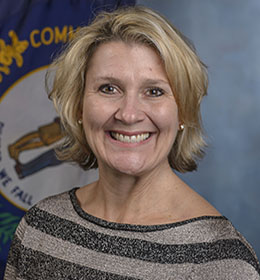
photo - Dr. Jessica CunninghamWe talked to Dr. Jessica Cunningham, interim executive director of the Kentucky Center for Statistics (KYSTATS), about Kentucky’s preschool-to-workforce data system and what California can learn from their experiences.

PPIC: What are the benefits of an integrated student database?

Jessica Cunningham: One major benefit is improving current programs and education-to-career pathways. We work with K–12 career technical education (CTE) programs to provide them with better labor market data to guide their offerings. We’ve also evaluated the impact of expanding work-ready scholarships for students earning high-demand associate degrees at community colleges.

Our research helps policymakers, practitioners, agencies, and the public make more informed decisions. We recently showed that students who completed K–12 CTE programs earned more than their peers. This information contributed to the state’s decision to include CTE pathways as an alternative to the standard high school equivalency test.

PPIC: What hurdles did you encounter establishing the system?

JC: Funding is an ongoing challenge. We’re 85% funded by federal grants, so we face some financial uncertainty year to year. We’re currently looking at the potential for state appropriations as a more sustainable funding source.

More broadly, managing the data system is like working on a puzzle. Sometimes there are missing pieces, since you’re only able to report on the data you have. For example, we don’t have data on private K–12 schools or on children’s experiences prior to preschool or Head Start, so we need to be mindful of those gaps.

Also, some benefits of a data system take time and it’s important to set expectations accordingly. When we published our very first report on high school graduates, readers were eager for information on college completion rates and earnings. But we needed many more years of data before we could examine those long-term outcomes.

PPIC: What recommendations do you have for California?

JC: In Kentucky, we’re legislatively authorized to receive education and workforce data. A governance structure that includes different stakeholder groups (K–12, higher education, workforce development, financial aid) is also critical.

In the early stages, it’s necessary to figure out the key questions for the state—and to determine who should be engaged in that process. Those questions will drive decisions about the data you collect. You won’t be able to do everything at once, so developing a strong research agenda is essential.

Setting up a centralized system makes things easier. This way, no one has to recreate all the necessary data connections for every report or request. Our reporting data warehouse has zero personally identifiable information. We do everything in house—we don’t have to send data back and forth to a vendor and we know that we’re maintaining confidentiality and following the rigorous rules outlined in our data use and access policy.

We also emphasize that we’re nonpartisan. We provide data and results, but policymakers and other leaders are the ones driving the conversation about how to use this information to improve programs and policies.

LAUSD’s Measure EE and the Parcel Tax Vote Threshold

On June 4, voters in the Los Angeles Unified School District (LAUSD) will decide the fate of Measure EE, a historically large parcel tax that would generate about $500 million a year. Like all parcel taxes, Measure EE has a high bar to clear: two-thirds of voters must approve it. More than half of all proposed parcel taxes have cleared this bar since 2003.

The California Legislature is considering a constitutional amendment to lower the parcel tax vote threshold to 55%. If the legislature approves this proposal, California voters will weigh in. The amendment’s success at the ballot box is far from certain: the April 2019 PPIC Statewide Survey found that just 39% of likely voters would favor such a measure. But what might happen if the legislature and voters did ultimately approve the lower vote threshold? If the state’s recent experience with school bond measures is any indication, we would expect to see more parcel taxes placed on the ballot, with more of them passing.

The parcel tax is a California phenomenon. Proposition 13 (1978), which placed strict limits on commercial and residential property taxes, included a provision allowing cities, counties, and other districts to impose “special taxes” if two-thirds of voters approved. While the majority of parcel taxes levy a flat dollar amount per parcel—a lot or piece of property—Measure EE ties the dollar amount to the square footage of the building(s) on each parcel.

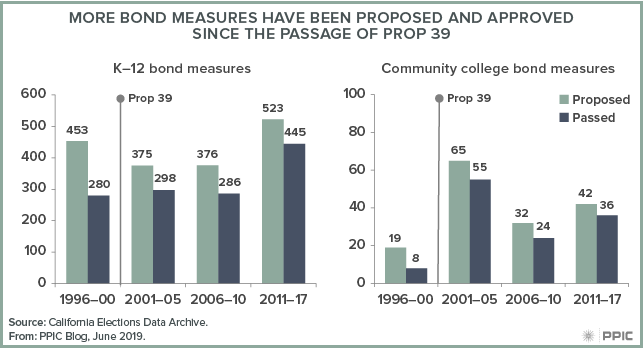
California voters lowered the approval threshold for school and community college bond measures to 55% when they approved Proposition 39 in 2000. The passage rate for K–12 bonds increased from 62% in the five-year period before Prop 39 to 79% in the five-year period after it was approved, and both the number of measures and rate of passage for K–12 bonds have been rising since 2011. This increase is especially striking given that the median bond amount has more than doubled (from $20 million to $45 million) since the threshold was lowered.

The trend has been similar for community college bond measures, though there are far fewer community college districts (73) than school districts (1,026) in the state. After Prop 39 passed, more colleges placed measures on the ballot—especially from 2001 to 2005—a higher share passed, and bond amounts increased. Passage rates increased from 42% before Prop 39 to 86% since 2011. The median amount has more than tripled since 1996 (increasing from $87 million to $350 million).

figure - More Bond Measures Have Been Proposed and Approved Since the Passage of Prop 39

The vote on Measure EE will be important for LAUSD—the resources that the parcel tax would generate are critical to the district’s future finances. The vote will also be worth watching with the pending constitutional amendment in mind. If the measure is approved, lawmakers may see less need for lowering the parcel tax threshold. If it is defeated, the amendment may gain momentum.

Californians See Preschool as Important

Early childhood education, a policy priority for Governor Newsom, is viewed as important by an overwhelming majority of Californians. In the April 2019 PPIC Statewide Survey, 78% of Californians and 88% of public school parents said that attending preschool is important to a student’s academic success in kindergarten through grade 12.

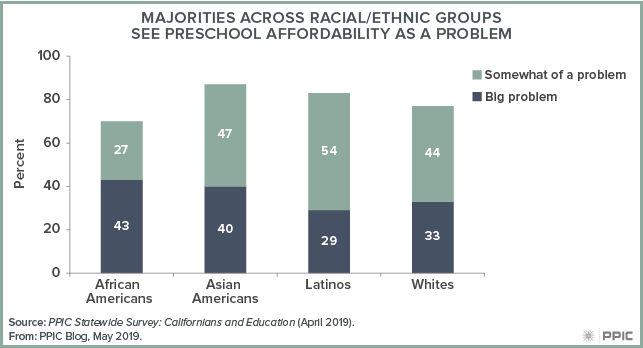
A similar share of Californians (80%) see the affordability of preschool as a problem. Democrats (46%) and Independents (38%) are much more likely than Republicans (25%) to say that it is a big problem. A majority across regions see affordability as a problem, with San Francisco Bay Area residents (42%) most likely to feel that it is a big problem. Across racial/ethnic groups, African Americans and Asian Americans are more likely than whites and Latinos to say that affordability is a big problem.

figure 1 - Majorities across Racial/ethnic Groups See Preschool Affordability as a Problem

Governor Newsom has proposed new funding that would address some of these affordability concerns. In April, we asked Californians if they were in favor of or opposed to the governor’s initial budget proposal from January, which allocated $125 million to expand full-day, full-year preschool to all eligible low-income four-year-olds. A majority of Californians—about two in three adults and three in four public school parents—favored this proposal. In addition, majorities across all demographic groups and regions favored it. In the May budget revision, the proposed funding was reduced to $31 million, which would pay for 10,000 new full-day preschool slots starting April 2020.

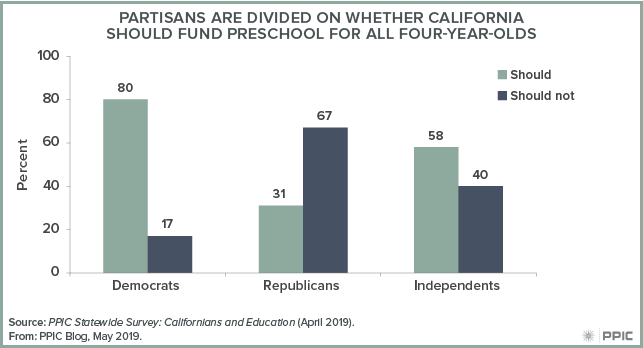
There is slightly less support for state-funded preschool in general: six in ten adults say that the government should fund voluntary preschool programs for all four-year-olds. State-sponsored preschool is a highly partisan issue, with Democrats much more likely than independents or Republicans to express support.

figure 2 - Partisans Are Divided on Whether California Should Fund Preschool for all Four-year-olds

With the release of the governor’s revised spending plan on May 9, the state budget process is well under way; the deadline for enacting the final budget is June 15. PPIC will continue to monitor the governor’s proposed allocations for early childhood education and the opinions of Californians on the issue.

Divided Views on Charter Schools and School Choice

Nearly three decades after California started authorizing charter schools, state lawmakers have renewed the debate over their rules and regulations. Today, there is a package of bills aimed increasing charter oversight moving through the legislature, and the governor has taken steps to address related issues. As the debate continues, the PPIC Statewide Survey has taken an in-depth look at Californians’ views of charter schools and school choice.

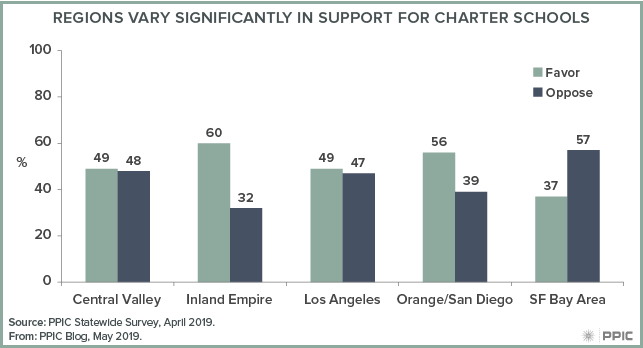
PPIC’s latest survey on K–12 education finds that Californians have mixed views on charter schools overall (49% favor, 46% oppose). Differences across regions and demographic groups are particularly notable. For example, half of Latinos (51%) and whites (50%) are in favor of charters in general, compared to fewer Asian Americans (43%) and African Americans (36%). Regionally, majorities in the Inland Empire and Orange/San Diego are in favor, while those in the Central Valley and Los Angeles are divided; a majority of San Francisco Bay Area residents are opposed.

figure 1 - Regions Vary Significantly in Support for Charter Schools

Looking more closely at charter school issues further highlights regional and racial/ethnic differences. On the question of transparency and accountability, overwhelming majorities across racial/ethnic groups say it is important for charters to operate with the same standards as traditional public schools. This includes 87% of Asian Americans, Latinos, and whites, and 72% of African Americans.

When it comes to charters taking away state funding that would otherwise be available for traditional public schools, seven in ten Los Angeles residents (71%) say they are concerned, compared to about six in ten in the Inland Empire (65%), San Francisco Bay Area (63%), and Orange/San Diego (62%); over half in the Central Valley (55%) express concern.

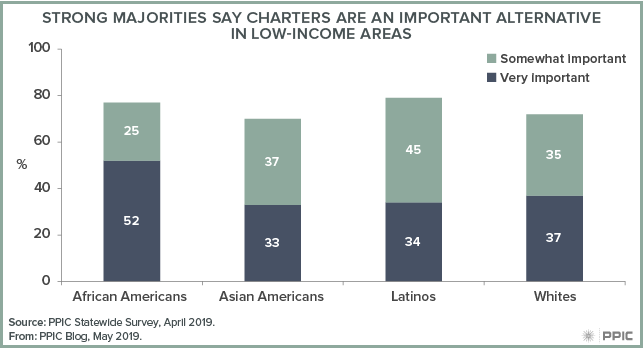
With respect to school choice, African Americans (52%) are much more likely than whites (37%), Latinos (34%), and Asian Americans (33%) to say it is very important for parents in lower-income areas to have the option of sending their children to charters instead of traditional public schools.

figure 2 - Strong Majorities Say Charters Are an Important Alternative in Low-income Areas

Earlier this year, Governor Gavin Newsom commissioned a task force to examine the impact of charter school growth on district budgets. He also signed legislation requiring the state’s 1,300-plus charter schools to follow the same transparency laws that apply to public school districts. As these policies play out, the PPIC Statewide Survey will continue to track Californians’ concerns and preferences on charter school issues.