Interactive: Californians’ Views on Homelessness

[vc_row][vc_column][vc_column_text]Homelessness is a growing concern in California, where nearly a quarter of the nation’s homeless population lives. The crisis comes amid sky-high housing costs and widening income inequality. PPIC’s latest survey explores residents’ perceptions of homelessness in their part of the state.

Eighty-five percent of Californians say they are concerned about the presence of homeless people in their local community, including 58 percent who are very concerned. Majorities across regions and demographic groups say they are very concerned about this issue.

In addition, about six in ten Californians (58%) say the presence of homeless people has increased in their local community over the past year. Four in ten say it has stayed the same, while only 3% say it has decreased.

The chart below allows you to take a closer look at how different Californians view this issue. Across regions, Los Angeles (63%) residents are the most likely to say the presence of homeless people has increased. This is in line with recent data showing Los Angeles County saw a spike in homelessness in 2019. African Americans (73%) and residents with annual household incomes under $40,000 (61%) are also especially likely to report an increase in homelessness in their community. Very small shares of Californians report a decrease in the presence of homeless people.[/vc_column_text][/vc_column][/vc_row][vc_row max_width=”80″ visibility=”visible-desktop”][vc_column][vc_column_text][infogram id=”1p0621pw3w90yltegez9kvk6xdanq1qd6ey?live”][/vc_column_text][/vc_column][/vc_row][vc_row max_width=”80″ visibility=”visible-tablet-landscape”][vc_column][vc_column_text][infogram id=”1p0621pw3w90yltegez9kvk6xdanq1qd6ey?live”][/vc_column_text][/vc_column][/vc_row][vc_row visibility=”visible-tablet-portrait”][vc_column][vc_column_text][infogram id=”1p0621pw3w90yltegez9kvk6xdanq1qd6ey?live”][/vc_column_text][/vc_column][/vc_row][vc_row visibility=”visible-phone”][vc_column][vc_column_text][infogram id=”1p0621pw3w90yltegez9kvk6xdanq1qd6ey?live”][/vc_column_text][/vc_column][/vc_row][vc_row][vc_column][vc_column_text]Given the complexity of the homelessness crisis, the governor and state legislature must think of creative and sustainable solutions. One possible approach is a law that would require local governments to construct enough shelter beds so that any homeless person requesting to come indoors could do so. When asked about this proposal, an overwhelming majority of Californians (76% adults, 70% likely voters) are in favor. There is support for the policy across parties, regions, and demographic groups.[/vc_column_text][/vc_column][/vc_row][vc_row max_width=”80″ visibility=”visible-desktop”][vc_column][vc_column_text][infogram id=”1prd6drdjkx025ig27z3kwz276smgp3jj2r?live”][/vc_column_text][/vc_column][/vc_row][vc_row max_width=”80″ visibility=”visible-tablet-landscape”][vc_column][vc_column_text][infogram id=”1prd6drdjkx025ig27z3kwz276smgp3jj2r?live”][/vc_column_text][/vc_column][/vc_row][vc_row visibility=”visible-tablet-portrait”][vc_column][vc_column_text][infogram id=”1prd6drdjkx025ig27z3kwz276smgp3jj2r?live”][/vc_column_text][/vc_column][/vc_row][vc_row visibility=”visible-phone”][vc_column][vc_column_text][infogram id=”1prd6drdjkx025ig27z3kwz276smgp3jj2r?live”][/vc_column_text][/vc_column][/vc_row][vc_row][vc_column][vc_column_text]As state policymakers work on their policy agendas for the next year, we will continue to monitor Californians’ views on homelessness and related policies closely.[/vc_column_text][/vc_column][/vc_row]
Video: Counting the Central Valley

The 2020 Census is fast approaching, and the stakes are high for California—political representation and federal funding are on the line. The San Joaquin Valley, with a population of 4.3 million, may be one of the state’s hardest-to-count regions. In Sacramento last Friday, PPIC convened a discussion about how valley communities are preparing for the census.

California has long been home to high numbers of “hard to count” residents—including young children, renters, and immigrants. In 2020, the difficulty of counting all Californians will be greater than ever. PPIC researcher Joe Hayes outlined the challenges, which range from uneven internet access to a lack of trust: “Individuals are less likely to respond out of privacy concerns, on the one hand, but also out of distrust for the federal government.”

The good news is that state and local governments have invested heavily in outreach. Complete Count Committees have been established counties across the state, and community-based organizations are spearheading outreach efforts. To help guide these efforts, PPIC created interactive maps that show hard-to-count communities across the state. Maria Jeans, program coordinator for the Maddy Institute, moderated a panel discussion about the factors that make counting the Central Valley so challenging—and how challenges are being addressed.

Jesus Martinez, executive director of Central Valley Immigrant Integration Collaborative, highlighted the challenge of organizational capacity. As local preparations for the census got under way in 2018, he realized that “only a handful” of those who wanted to get involved “had any type of personal or institutional experience with the census.”

Don Saylor, a Yolo County supervisor, cited the difficulty of reaching remote rural settings across the Central Valley and the large numbers of farmworkers, language minorities, young children, and residences with multiple households. He included students enrolled at UC Davis and other colleges in the Central Valley—especially those “who are renters, living in different kinds of group settings”—as a hard-to-count population.

The panelists agreed that the fear generated by federal immigration rhetoric and policies are particularly challenging for the Central Valley. As a result, census outreach must focus on more than just making sure California gets its fair share of federal funding. As Martinez put it, “This is a human rights and civil rights issue for us now. It is the right of immigrants to be included in the 2020 Census.” Much of the outreach involves person-to-person conversations—canvassing and phone banking, “house meetings” among neighbors, and interactive media.

Cindy Quezada, senior program officer at Sierra Health Foundation, noted that encouraging people to participate is not the only challenge. “Sometimes people might want to participate but they don’t have a way to,” she said. “Either you’re living in a trailer in a backyard so you’re not going to get the invite and you’re not going to get an enumerator visit, or you may not speak a language that’s supported.” These structural barriers “are something we should really be paying attention to.”

How Did California’s Voter Registration Rate Get So High?

The most recent report on voter registration from the California Secretary of State offers startling news: the registration rate is now just above 80%, the highest it’s been before a primary election since World War II. With several months to go before the registration deadline, this rate is all the more remarkable considering the state’s population, which compared to other states is younger, more mobile, and less acculturated to voting—in part due to the high number of immigrants. As a result, eligible voters in California are especially challenging to mobilize.

What explains this incredible number? First, national politics has helped draw in new voters over the last decade. In the early 2000s, the state’s registration rate languished below 70%. Two presidential elections—the race between Barack Obama and John McCain in 2008, and the one between Hillary Clinton and Donald Trump in 2016—helped elevate that rate to about 76% heading into the 2018 election.

Second, the state implemented an important reform in April 2018. The California New Motor Voter (CNMV) program takes a fairly aggressive approach to registering eligible residents at the Department of Motor Vehicles. DMV customers getting a new driver’s license or state ID, renewing an existing one, or updating an address must now answer voter registration questions to complete their DMV transactions. If they don’t want to register they have to say so explicitly.

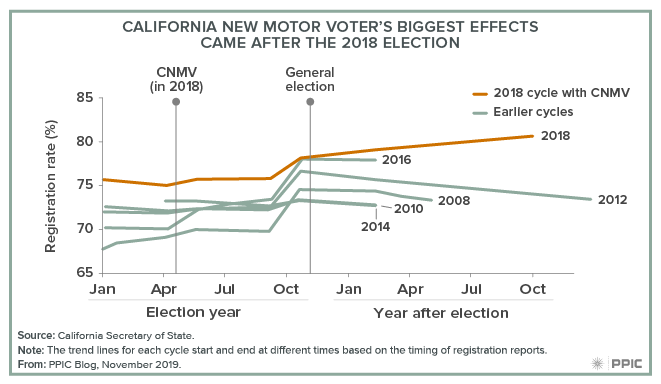
CNMV’s effect has been complicated. It has more than doubled the number of people registering at the DMV, from an average of about 140,000 per month to roughly 370,000. Yet most of these people were not new registrants. In fact, many aspects of registration in 2018 were unexceptional. The figure below compares the registration rate over time in every election cycle between 2008 and 2018. The rate already started higher in 2018—a consequence of the 2008 and 2016 elections. It then increased during the election season, but the increase was in line with previous years.

The real change has come since the 2018 election. In every past cycle, the registration rate has flattened or even fallen in the next calendar year. Excitement fades, and routine file maintenance removes more voters than the number who sign up. But an election doesn’t stop people from using the DMV, so under CNMV people have continued to register. The result is a steadily widening gap between registration now and registration at the same point in past cycles.

figure - California New Motor Voter’s Biggest Effects Came After the 2018 Election

It’s not clear from this gap whether more people will register by the 2020 election than would have without CNMV. Americans already seem unusually excited about voting, and enthusiasm often finds its way to the ballot box. Yet higher registration is not the reform’s only potential effect. In pushing so many to fill out a voter registration form, CNMV also helps keep the registration file up to date. This avoids glitches on Election Day that could prevent someone from voting.

Ultimately, whatever the cause, the registration rate is up. This hints at a new future for California. Unregistered Californians have traditionally been younger and more diverse than voters, with different views on policy issues. As the registration rate climbs, more of these residents become part of the voting public. Politics may be forced to change in response.

Proposition 187 and a Changing California

Twenty-five years ago, in the midst of the worst economic crisis since the Great Depression, 59% of Californians voted to pass Proposition 187. The landmark ballot measure sought to set up a state-run immigration system and deny most public benefits—including K–12 education—to undocumented immigrants. The measure was later found to be unconstitutional, but its impact was pivotal in transforming California into what it is today.

Most Californians now support policies to protect undocumented immigrants. A recent PPIC survey found 61% of Californians and 54% of likely voters are in favor of state and local governments making their own policies and taking actions, separate from the federal government, to protect the legal rights of undocumented immigrants. In addition, our April survey found 57% of Californians (54% likely voters) support public school districts designating themselves “sanctuary safe zones” to indicate they will protect undocumented students and their families from federal immigration enforcement efforts.

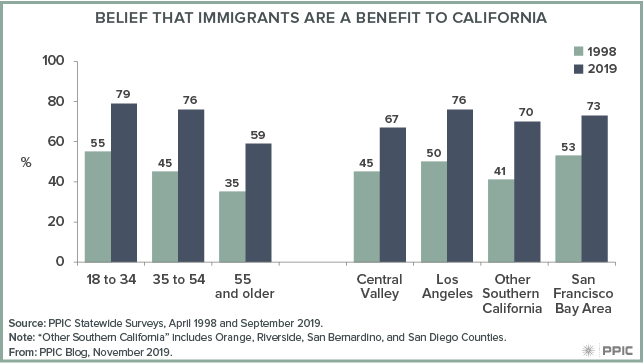
Californians’ overall views toward immigrants have also shifted. The PPIC Statewide Survey has monitored this issue since 1998. In April 1998, Californians were divided: 46% viewed immigrants as a benefit to California because of their hard work and job skills, while 42% viewed immigrants as a burden because they use public services. Since then, the share of Californians viewing immigrants positively has increased 25 points (71% benefit, 22% burden).

Across age groups and regions, the perception that immigrants are a benefit has risen by more than 20 points. Positive perceptions are also up across racial/ethnic groups, by 27 points among African Americans, 20 points among Latinos, 18 points among whites, and 12 points among Asian Americans. The share of Democrats viewing immigrants positively has increased 37 points, while the share of Republicans holding this view has decreased 2 points.

figure - Belief that Immigrants Are a Benefit to California

In recent years, Californians have supported policies to improve the lives of immigrants, such as providing health care for young undocumented Californians, taking state and local actions to protect immigrants, and supporting a pathway to citizenship. What role will immigration play in the upcoming election? Stay tuned to the PPIC Statewide Survey as we continue to examine Californians’ view of immigrants.

Do Californians Support the Proposed School Bond?

When Californians go to the polls in March, they will not only cast a vote in the presidential primary—they will also vote on an education bond to fund construction and modernization projects. Given differences in support for the bond across the state’s regions and demographic groups, turnout will play a pivotal role in whether this measure passes.

In the closing days of the legislative session, the legislature passed and the governor later signed a bill placing Proposition 13 (the Public Preschool, K–12, and College Health and Safety Bond Act of 2020) on the March ballot. If approved by voters, the measure would authorize $15 billion in general obligation bonds to pay for the construction and modernization of California’s public schools, community colleges, and four-year colleges.

The September PPIC Statewide Survey took an initial look at support for this proposition. While two-thirds of Californians (66%) are in favor, 54% of likely voters say they would vote yes—just slightly above the majority needed to pass.

Are some Californians more likely than others to support the bond measure? Unsurprisingly, there is a wide partisan divide, with three in four Democratic likely voters (76%) saying they would vote yes compared to just three in ten Republicans (29%). Overall, independent likely voters are divided (48% yes, 44% no). But among Democratic-leaning independents, nearly two in three (64%) are supportive.

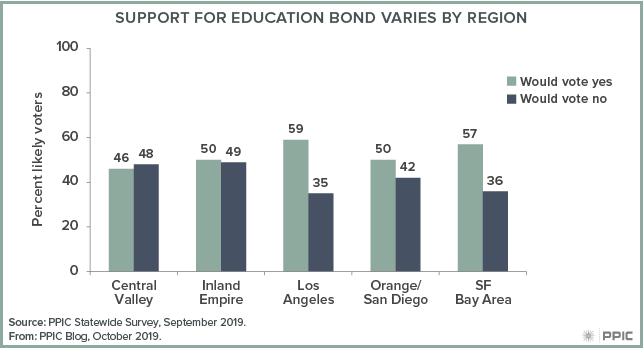
Support varies across regions, with Los Angeles (59%) and San Francisco Bay Area (57%) likely voters expressing the most support, compared to about half of likely voters elsewhere in the state.

figure - Support for Education Bond Varies by Region

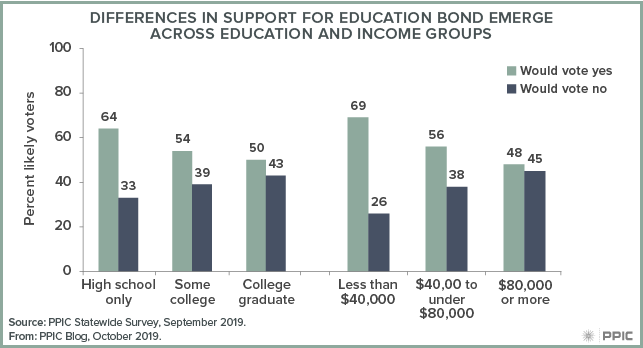
While support is similar among likely voters with (55%) and without (53%) children in the house, there are differences across other demographic groups.

White likely voters (47%) are much less likely than Latinos (74%) and those of other racial/ethnic groups (62%) to say they would vote yes. And since school construction bonds are often paid off by property taxes, it’s notable that homeowners (44%) are far less likely than renters (71%) to say they would vote yes. Support is higher among younger likely voters (66% age 18 to 44, 48% age 45 and older). It declines as education and income levels increase.

figure - Difference in Support for Education Bond Emerge Across Education and Income Gaps

Overall, support for the education bond currently hovers at around half for likely voters, but there is much stronger support among many regional and demographic groups—suggesting that passage could depend on who shows up to vote. If Democrats and Democratic-leaning independents turn out in large numbers for the presidential primary, that could affect the fate of this bond. Stay tuned to the PPIC Statewide Survey as we continue to track this measure in advance of the March primary.

Approval Ratings in a Hyper-Partisan Era

One of the most surprising findings in our PPIC Statewide Surveys this year has been the consistency of the approval ratings of the California governor and US president during a very eventful year. It’s yet another sign of deep divisions between Republican and Democratic voters—and a split in partisan preferences within the growing ranks of independent (also known as no party preference or NPP) voters in California.

The latest PPIC survey shows Governor Gavin Newsom’s approval rating to be statistically unchanged among California’s likely voters over the course of his first year in office (43% January, 45% March, 47% May, 47% July, 43% September). Despite low unemployment and a multi-billion dollar budget surplus, Newsom’s approval rating is still falling short of 50 percent—even as he has become more widely known.

Meanwhile, President Trump’s approval rating has also held steady in 2019 (36% January, 34% March, 38% May, 38% July, 35% September). Trump’s approval may be low, but it has been rock solid in the wake of numerous controversies and political setbacks, including the current impeachment inquiry.

One of the major contributors to the ceiling on the Democratic governor’s approval rating is his very weak support among Republicans (12% January, 14% March, 13% May, 14% July, 12% September), even while strong majorities of Democrats approve of the job that he is doing (65% January, 68% March, 69% May, 72% July, 68% September).

Similarly, the floor on President Trump’s approval rating is largely explained by overwhelming approval from Republican voters (82% January, 82% March, 84% May, 87% July, 83% September) even while his Democratic support has mostly been in single digits (7% January, 5% March, 8% May, 10% July, 7% September).

Behind these disparate views of two starkly different political figures is a growing inclination to see the world through a highly partisan lens. About seven in ten Republicans now call themselves “strong” Republicans (63% January, 69% March, 72% May, 65% July, 72% September)—up sharply in a decade (55% September 2009). Similarly, about seven in Democrats now say they are “strong” Democrats (69% January, 66% March, 69% May, 60% July, 68% September)—again, much higher than 10 years ago (58% September 2009).

How does hyper-partisanship impact approval ratings? In our latest survey, only 5% of “strong” Republicans approve of the governor, compared to 76% of “strong” Democrats. And 94% of “strong” Republicans approve of the president, compared to just 1% of “strong” Democrats. The “not so strong” Republicans and Democrats give more mixed reviews—but their diminishing ranks means that approval ratings are more polarized and static.

One would expect that the growing number of independent voters—now about a quarter of the California electorate—would be a reliable source of volatility in the governor and president’s approval ratings. But most nonaligned voters are clearly taking sides in the partisan conflict. In our recent survey, we find that most independent likely voters are split fairly evenly between the two parties, with seven in ten saying either that they lean Democrat (36%) or Republican (35%). Of those who lean Republican, 18% approve of the governor while 69% approve of the president. Of those who lean Democratic, 63% approve of the governor while 2% approve of the president.

Most Californians have made up their minds about whom they do and do not trust in government. Many view their federal and state officeholders through party labels rather than ideas and actions. It would take extraordinary circumstances for Governor Newsom to rise much higher in public esteem—or for President Trump to fall much lower.

The emergence of hyper-partisanship has significant implications for California’s democracy. Will California voters be reluctant to cross party lines in the top-two primary in March? Will independent voters continue to side with one of the two major parties or are they open to a third party alternative? Will California’s elected leaders be able to find common ground and bipartisan solutions?

The answers to these questions will have far-reaching impacts on the 2020 election and the future of the state. The PPIC Statewide Survey will continue to track partisanship throughout this highly contentious and consequential time.

Waning Confidence in the Electoral Process

Just ahead of the next Democratic presidential primary debate, and as California heads into a particularly consequential election year, residents express the lowest confidence in the state’s electoral system ever recorded by the PPIC Statewide Survey.

In our most recent survey, 36% of all adults and 42% of likely voters say that they have either a great deal (18% adults, 22% likely voters) or quite a lot (18% adults, 20% likely voters) of confidence in California’s electoral system. Confidence has continually declined since we first asked this question in October 2004.

figure - Confidence in the Electoral Process Has Declined Significantly

Levels of confidence in the electoral system differ across partisan lines. Today, Democrats (52%) are slightly more likely than they were in 2004 (45%) to say they have either a great deal or quite a lot of confidence in the system. But confidence has declined somewhat among independents (35% today; 47% 2004) and significantly among Republicans (27% today; 76% 2004).

Since 2004, confidence has declined across nearly all age, education, income, and racial/ethnic groups—with the exception of African Americans, who express similar levels of confidence today (37%) as they did in 2004 (32%).

Much recent debate has centered on two opposing concerns about elections: some are concerned about voter fraud, in which ineligible people vote, while others are concerned about voter suppression, in which eligible voters are unable to cast a ballot.

Currently, voter fraud is the stronger concern. A slight majority of Californians (54%) and likely voters (57%) are either very or somewhat concerned that it is too easy for ineligible people to vote. But many still consider voter suppression to be an issue, with 45% of all adults and 42% of likely voters either very or somewhat concerned that it is too hard for eligible people to vote.

Views on these issues differ across party lines. Republicans (79%) are far more likely than independents (53%) or Democrats (43%) to be either very or somewhat concerned about voter fraud. In contrast, Democrats (50%) are more likely than independents (43%) or Republicans (34%) to say voter suppression is either very or somewhat of a concern.

figure - Partisan Differences in Concerns about Voting in California Elections Are Sizeable

Concern about voter fraud has increased among certain groups since we last asked this question in 2017. In particular, we see increases among likely voters (57% today; 50% 2017), as well as among those age 55 and older (63% today; 53% 2017), Asian Americans (54% today; 43% 2017), and college graduates (48% today; 40% 2017).

Concern about voter suppression has grown among African Americans (66% today; 49% 2017), residents of the Inland Empire (54% today; 35% 2017), and Republicans (34% today; 22% 2017).

Governor Newsom recently signed legislation that will allow voters to register and vote on Election Day anywhere ballots are cast. This is the latest in a number of reforms meant to broaden voter access in the state. Stay tuned as we monitor Californians’ perceptions on these issues throughout this important election season.

Video: Californians and Their Government

As California’s 2020 Democratic presidential primary draws closer, Elizabeth Warren, Joe Biden, and Bernie Sanders lead the rest of the field by a wide margin. However, many voters say they would consider supporting a candidate other than their current choice. These and other key findings from PPIC’s latest statewide survey were outlined by Rachel Lawler in Sacramento last Thursday.

Likely voters identifying as registered Democrats or as Democratic-leaning independents support Elizabeth Warren (23%), Joe Biden (22%), and Bernie Sanders (21%) at levels well above Kamala Harris (8%) and Pete Buttigieg (6%). No other candidate is preferred by more than 3 percent, and 9 percent say they don’t know which candidate they prefer. More than half of voters who expressed a preference would consider supporting another candidate.

The survey asked about a $15 billion bond for school and college construction that has been approved by the legislature for the March 2020 ballot. It has the support of two in three adults—but only 54 percent of likely voters. This narrow margin of support coincides with concern about the state’s economic outlook. Fewer than half (41% adults, 37% likely voters) expect good times financially in California during the next 12 months.

A potential November 2020 ballot measure that would amend Proposition 13 to tax commercial properties at their current market rate and direct some of the new revenue to K–12 public schools is favored by 57 percent of adults. However, fewer than half (47%) of likely voters favor the measure, and this share is down somewhat from April 2019 (54%). A potential state bond measure to fund water infrastructure is favored by 68 percent of adults and 57 percent of likely voters.

Other survey highlights:

  • Californians are most likely to name homelessness (15% adults, 16% likely voters) and jobs and the economy (15% adults, 13% likely voters) as the top issue facing the state. Other issues named include housing costs, immigration, and the environment.
  • Most Californians view immigrants as a benefit to the state, and half are at least somewhat worried about someone they know being deported as a result of increased federal immigration enforcement.
  • Two in three Californians think the Supreme Court should not overturn Roe v. Wade; more than half think some states are making it too difficult to get an abortion.
  • Half of Californians say they have a disaster plan and six in ten have a disaster supplies kit. Six in ten are very (28%) or somewhat (32%) worried about personal injury, property damage, or a major disruption of their routine as the result of a disaster.


The Mood of California Voters and the 2020 Election Cycle

This post is excerpted from my speech at the Sacramento Seminar on October 4, 2019 in San Francisco.

Pollsters often say that a public opinion survey is a snapshot in time. The latest PPIC Statewide Survey was conducted in the days after the California Legislature finished its work in 2019 and while startling news was breaking that the president called a foreign leader for a political favor—which has resulted in the launch of an impeachment inquiry. The mood of California voters in this timely survey—especially their level of unhappiness and anxiety—is noteworthy because of its far-reaching implications for the March primary and the November election.

Let’s start with President Trump’s approval rating, which now stands at 35% among California likely voters. This is unchanged from the last reading in our July survey and has been remarkably stable over time. Today, 83% of Republicans approve of his job performance, compared to just 38% of independents and only 7% of Democrats. Given its partisan makeup, California is a reliably blue state on the Electoral College map. Still, low approval ratings for the president will increase turnout, influence the Democratic presidential primary choice, and affect all of the legislative races next year.

Meanwhile, approval ratings for Congress remain low even in the wake of Democratic control of the US House of Representatives. Today, just 24% of California likely voters approve of the way that Congress is doing its job. This is unchanged from the start of the year—as well as from a year ago when Republicans controlled the House. In California, likely voters across party lines give low approval ratings to Congress. If this trend continues, incumbents will have to work harder to keep their seats in 2020.

Closer to home, Governor Newsom and the legislature are getting mixed reviews in their first year of making policy together. Among likely voters, 43% approve and 44% disapprove of the governor, while 38% approve and 51% disapprove of the legislature. Since the beginning of the year, disapproval has increased significantly for the governor (+15 points) and the legislature (+8 points). Today, more than six in ten Democrats approve of the job that the governor and legislature are doing, compared to fewer than four in ten independents, and less than two in ten Republicans. If their ratings remain in the doldrums, the governor and legislators will have little sway over Californians’ ballot choices next year.

figure - Approval Ratings of State Elected Officials

Equally important, California’s likely voters are in a negative frame of mind about the state of their state—even in the midst of low unemployment and budget surpluses. Fifty-four percent say that things in California are going in the wrong direction (41% say right direction). When asked about economic conditions in California for the next 12 months, a similar 54% expect bad times (37% say good times). Pluralities across party lines are now expecting bad economic times in the next 12 months—a timeframe that includes most of the 2020 election campaign season.

figure - Likely Voters Expect Bad Economic Times in the Next 12 Months

State bonds and tax measures will face headwinds if this level of economic unease continues. This is already evident in the modest support for the $15 billion school bond (54%) and the split-roll property tax initiative (47%) in our recent survey.

figure - Modest Support for Likely 2020 State Ballot Measures

Digging deeper into the survey, more than six in 10 likely voters worry about being able to afford the cost of their health care, six in ten are concerned about the threat of a mass shooting where they live, half are worried about experiencing natural disasters such as wildfires, and four in ten worry about someone they know being deported. Candidates’ promises and plans to address these fears will likely impact the standing of current frontrunners Joe Biden, Bernie Sanders, and Elizabeth Warren—and their challengers—in a Democratic presidential primary which is very much up for grabs, as our recent survey shows.

How will voters’ views change over the next 12 months? Clearly, the political wildcard is the impeachment inquiry and how it will impact perceptions of the president, Congress, and the major parties. Uncertainty about the economy is another unknown factor. In the short run, the impeachment inquiry is likely to increase polarization, lead to more political gridlock in Washington, and heighten expectations for the governor and legislature to do more to solve the problems facing California.

PPIC Statewide Surveys will continue to monitor the broader political and economic attitudes, as well as voters’ preferences for presidential candidates and ballot measures, throughout what will be a consequential 2020 election.

Video: 2020 Election Preview

Now that California’s presidential primary has been moved from June to March, how might the state’s electorate influence the 2020 election, and how are the major parties engaging with voters? At a lunchtime event in Sacramento last week, PPIC president Mark Baldassare provided an overview of voter participation in California and KQED’s Marisa Lagos moderated a lively, wide-ranging discussion of the upcoming election season.

Lagos, who covers California politics and government for KQED, noted that California has long been a “piggy bank” for presidential candidates in both parties. She asked whether the earlier primary date will increase the state’s influence. “Guess what? You’re still the piggy bank!” joked Tamara Keith, White House correspondent for National Public Radio.

More seriously, Keith noted that it isn’t clear whether “California will come into the process soon enough to make a difference or whether things will have started settling out after Iowa and New Hampshire.” She added that because it takes weeks for the state to count its absentee ballots, “there’s a chance that the race will have already advanced a lot by the time California’s results are fully in.”

Rusty Hicks, chair of the California Democratic Party, said that the earlier primary date offers opportunities for presidential candidates to engage voters across the state. “You have top-tier candidates going to the northern rural parts of the state. They’re going to the Central Valley, they’re going to the Inland Empire.” In his view, this is “a real opportunity to showcase the state . . . it’s more than the Bay Area and Los Angeles.”

From the Republican perspective, the early presidential primary doesn’t make a big difference. But Jessica Patterson, chair of the California Republican Party, sees opportunities on the state level. “We have the opportunity to change the entire makeup of the building across the street.” The party is focused on “making sure we’re engaged in communities . . . to talk about the things that are important to them, and really focus on fixing our state.”

While their perspectives differed in many ways, both Patterson and Hicks stressed the importance of working together to empower and represent all Californians. “I think we all have an interest in ensuring that we have an engaged and empowered electorate,” said Hicks. Patterson agreed, adding that “it’s better for all of us when we find ways that we can work together.”