When it comes to government budgets, the focus is usually on who gets how much. But that’s only part of the story of the California state budget, which usually includes a host of provisions that specify how the money is to be used. This year’s budget is no exception—and one relatively obscure provision could help University of California (UC) campuses optimize their budgetary decision-making.
A lot of attention has been paid to the budget provision that withholds $50 million from UC until the university’s Office of the President (UCOP) implements the recommendations contained in an unflattering state audit. Our focus, however, is on another, little-noticed provision that requires UCOP to complete an experiment in “activity-based costing”—a detailed way of tracking and measuring university expenditures.
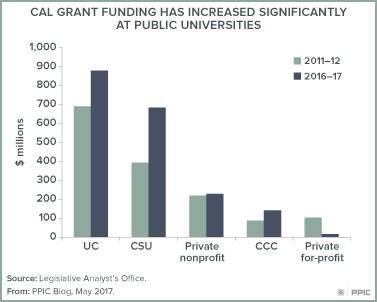
As we noted in a recent report, it is challenging to track dollars as they flow through higher education systems. Public universities typically have multiple funding sources and several missions and activities, all of which combine to create an intricate web of dollars. Activity-based costing focuses on an institution’s expenditures to identify where money is going. In a pilot program at UC Riverside, administrators have combined data on students, faculty, courses, and finances to create a detailed picture of the costs associated with instruction. The information enables administrators to estimate costs at various levels—from how much it spends to run a department down to the cost of teaching a single class section. The enacted budget requires UCOP to expand UC Riverside’s activity-based costing to three departments on each of two additional campuses.
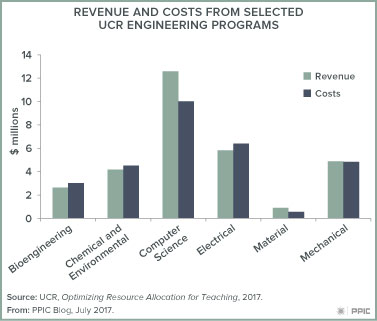
Activity-based costing has the potential to inform conversations among campus administrators about the trade-offs involved in using resources to improve student outcomes. For example, the conventional wisdom is that it is expensive to increase enrollment in STEM (science, technology, engineering, and math) programs. By applying activity-based costing, UCR budget and planning officials found that expanding the biology and computer science departments would not necessarily be costly. Because of the size of enrollment and the way courses are taught and faculty are assigned, the revenue generated by those departments exceeds the cost of expansion. The cost of expanding programs in electrical engineering and bioengineering, on the other hand, is currently higher than the revenue generated from enrollment.
The takeaway is that if administrators feel that expanding the electrical engineering program is a priority, they should pursue it knowing that they will need to find additional sources of revenue.
The UCR pilot has also enabled the university to understand the costs of instruction at a high level of detail. Our report calculated the changes in the cost per degree over time for both the UC and California State University systems. UCR was able to break down the cost per degree by type. For example, producing an engineering degree costs, on average, 16% more than a degree in social science. The cost of a humanities degree falls between the two. A significant portion of that cost difference could be attributed to the fact that it takes longer for engineering students to complete their degree requirements.
Activity-based costing isn’t a substitute for goal-setting and planning. It is a tool that can help an institution better align its resources with its goals. Another takeaway from the UCR pilot is that implementing activity-based costing is a complicated endeavor that requires a broad commitment from the institution. The process of expanding this pilot—and what administrators learn from it—bears watching.

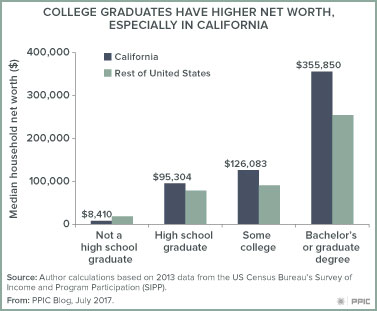 The estimates show that Californians are wealthier than adults in the rest of the nation. In 2013, median household net worth among adults age 25 and over was $135,000 in California compared to $105,000 in the rest of the United States. While many have expressed growing concern about income inequality, the distribution of wealth is even more uneven—a fact that is especially apparent when we examine wealth by educational attainment. In California, median household net worth is almost four times higher for adults with at least a bachelor’s degree ($356,000) than for high school graduates ($95,000). (In the rest of the nation, the difference is slightly more than threefold.) One in four college graduates in California is a millionaire, compared to one in fourteen high school graduates.
 For most people, wealth accumulates over time. As college graduates consistently earn relatively high incomes year after year, their wealth grows. One in five young college graduates (age 25–34) in California has negative net worth—meaning they have more debt, including student loan debt, than assets. But over time, debt recedes and wealth increases. Among college graduates who recently retired (those age 65–74) in California, half are millionaires.