Testimony: How an Integrated Data System Could Improve Education

Jacob Jackson, research fellow at the PPIC Higher Education Center, testified before the Senate Committee on Education in Sacramento today (April 11, 2018). Here are his prepared remarks:

Thank you Chair Allen, Vice Chair Wilk, and members of the committee for the opportunity to testify today. My name is Jacob Jackson and I am a research fellow at the Public Policy Institute of California. PPIC is a nonprofit, nonpartisan policy research organization and does not take positions on legislation. My comments today are about the potential benefits of a statewide, longitudinal student data system and are based on research that PPIC and others have conducted.

Right now, educational institutions and government agencies already collect plenty of data. The California Longitudinal Pupil Achievement Data System (CALPADS) tracks students from kindergarten through grade 12. Each public system of higher education (the community colleges, California State University, and the University of California) keeps track of its students while they are attending that institution. And the Labor and Workforce Development Agency collects data on the earnings of Californians over time. However, these data sources remain largely separate—which prevents the state from understanding how students move across educational institutions and into the workforce. Below are three key considerations in thinking about the potential value of an integrated data system.

A statewide longitudinal data system could help answer important questions for California. The lack of an integrated data system leaves California unable to answer basic questions about educational progress, workforce development, and equity. Such questions include:

  • Is the state’s educational pipeline working? Who applies to which colleges? Does starting at a community college hurt students’ chances of earning a bachelor’s degree?
  • How does education affect workforce outcomes? In what ways are academic coursework and performance during K–12 related to future earnings? What are the economic returns to different Career Technical Education (CTE) pathways?
  • Are state interventions working? Are districts that receive extra funding through the Local Control Funding Formula getting better at sending students to college?
  • Are state investments paying off? What are the impacts of early childhood education on long-term educational and economic outcomes?

College and career readiness is one area where a longitudinal data system could help inform policy. The Common Core State Standards and the Smarter Balanced assessments are aimed at preparing K–12 students for college and career success. PPIC projects that California will face a shortfall of 1.1 million college graduates if current trends in college-degree production and demand for college-educated workers persist. Getting students ready for college is an important goal for the state. In fact, California’s K–12 scorecard will soon start holding districts accountable for their college and career readiness. The College Career Indicator contains metrics about high school course completion and standardized test measures. But due to the lack of linked data, high schools do not actually know which of their students go to which colleges, whether students need remediation once they get there, and whether students succeed in their academic goals. High schools also lack data on if or when students enter the workforce and how successful they are in their career. A statewide longitudinal data system can connect high school performance with outcomes in college and career, which could in turn provide schools, researchers, and policymakers the feedback they need to improve college and career readiness policies and programs.

Though our current ability to link data across sectors is limited, doing so has already produced important insights. Occasionally, researchers or institutions can link together data on a project-by-project basis. Here I list two examples that uncovered important insights and that would not have been possible without longitudinal data. First, PPIC researchers Sarah Bohn and Shannon McConville’s work on Career Technical Education in health fields linked educational data from the California Community Colleges Chancellor’s Office with earnings data from the state’s Unemployment Insurance system. Their work showed that CTE credentials in health generally have sizeable economic returns. The research also indicated which certificates result in higher wages and showed that earning multiple, short-term credentials yields significant economic returns. My own research with Michal Kurlaender and Scott Carrell of UC Davis connected community college data to high school data to show that incoming student characteristics play a big role in determining college-wide outcomes and rankings. These findings are especially important given the initial conversations around performance funding for California’s community colleges.

It is clear that a statewide longitudinal data system could provide new information and insights that are not currently available or possible. There still may be concerns about organization, privacy, security, costs, and ownership of the data, but if the state is willing to meet those challenges—as many other states have done—this tool could help California evaluate and improve its system of education. Linking K–12, college, and earnings data would allow policy experts to determine which policies and programs produce the best and most efficient outcomes for students, colleges, and the state as a whole.


Video: Implementing New K–12 Science Standards

California’s K–12 schools are implementing the Next Generation Science Standards (NGSS) to improve the way science is taught. The standards, adopted in 2013, represent a paradigm shift for science education. Although awareness of the new standards is high, implementation has been uneven, according to a new PPIC report.

Report coauthor Niu Gao presented the analysis in Sacramento last week. She said many districts report that instructional materials are a big challenge, and most also struggle with inadequate science labs and equipment. Insufficiently credentialed science teachers and challenges in professional teacher training are two other ongoing concerns. These problems are exacerbated by California’s chronic teacher shortage.

Gao concluded with a brief summary of the report’s policy recommendations, which include a greater emphasis on science in the early grades and three science courses—instead of two—as a high school graduation requirement. Gao’s presentation was followed by a discussion among a panel of experts who work in this area.

Jessica Sawko, executive director of the California Science Teachers Association, explained the rationale for teaching science in the early grades. Since NGSS builds upon the previous years’ instruction, this can put older students at a disadvantage if they’re not taught science early. “If you’re not teaching science in grade two, then you’re underpreparing students” for courses taught in grades three to five, she said.

When asked about the upcoming field test of the NGSS, Trish Williams, a member of the California State Board of Education, called it a “great opportunity” to collect data and get a snapshot of where we are—and what to do next. But she acknowledged that test results could vary. With a large state like California, Williams said, we can’t expect everyone to “knock it out of the park” on the first try. She also expressed concern about economic issues that put “low-performing districts at a terrible disadvantage.”

Stacey Lerma, a professional development specialist with the Moreno Valley Unified School District, added, “It’s going to take time for teachers to be comfortable with everything the test is assessing and for students to be prepared” for the new standards. Despite the challenges ahead, Lerma expressed deep support for the NGSS. When kids are dreaming about what to do when they grow up, “they need to think of things besides teacher, fire fighter, police officer, and think astronaut, scientist, and engineer.”

Prioritizing Computer Science in California Schools

More than half of the fastest-growing and highest-paying jobs nationwide require computer science (CS) knowledge. To help students acquire the skills they need to thrive in a technology-driven world, many states have added computer science to the roster of courses that satisfy high school graduation requirements. California has a way to go before it can join these states.

Currently, California has no statewide CS requirement. Individual school districts can allow CS course credit to substitute for math, science, or some other graduation requirement. In some districts, such as San Francisco Unified, CS classes can satisfy the “college preparatory elective” requirement but can’t replace classes in core subject areas.

In 23 other states and the District of Columbia, CS courses can count toward high school math requirements; nine of these other states also allow CS classes to count toward science requirements. For example, one of three required science courses may be a CS class, as long as the other two cover traditional science subjects. Half of the states that include CS in their high school graduation requirements require three years of math, while the other half require four years. Moreover, these states require students to complete foundational coursework in math and science before they can take CS courses that count toward high school graduation.

Before California can add CS to its high school graduation requirements, it needs to make several other changes. To ensure that students have the foundational knowledge required to do CS coursework, the state must increase the number of required math and science classes—its current requirement of two years in each subject is among the lowest in the nation.

California also needs to increase the number of rigorous CS courses taught statewide. Statewide CS course offerings are low and most courses are not rigorous enough to prepare students for college and beyond. During the 2016–17 school year, fewer than half (49%) of K–12 schools offered computer education courses. Furthermore, most courses do not meet the University of California or the California State University entrance requirements.

Finally, the state needs to dedicate funding to teacher professional development. Currently, schools and districts struggle to find qualified CS teachers. From 2000 to 2016, the number of computer education teachers remained around 3,000, while the number of teachers in other subject areas has grown substantially.

California can improve and broaden computer science education in its K–12 schools. But the experience of other states underlines the need for a multi-pronged effort.


California Needs More Math and Science Teachers

Recent reforms in educational standards—including the Common Core math standards and the Next Generation Science Standards—have altered the expectations placed on California’s teachers. Other changes, such as requiring college prep courses for high school graduation, will further increase the demand for math and science teachers. The state’s teacher workforce has already changed significantly in the past 15 years, but it will need to further evolve to meet the demands of the future.

These are a few of the challenges ahead:

  • Although the number of math and science teachers has increased in the state, there are fewer of them than in other core subjects. As a result, the average class size in math and science at all levels is larger in California than in other states. For instance, the average class size for high school science in California is 27, well above the national average (22). Similarly, average enrollment in high school math is 25, which is again higher than the national average (21).
  • The teacher workforce in math and science is aging rapidly. In 2016, the median age of the state’s math and science teachers was 44, three years older than the national average. In the next five years, California will need to replace at least 11% of these teachers due to retirement. About 12% of districts will need to replace at least 20% of their teachers.
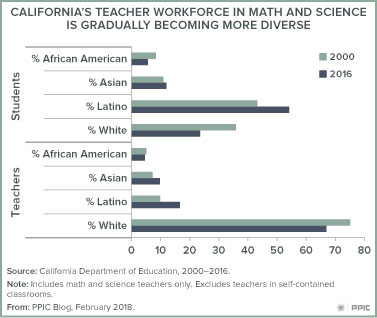
  • The composition of the teacher workforce in math and science has changed in recent years, yet it still does not reflect the diversity of California students. In the 2000–01 school year, only 10% of math and science teachers were Latino; today, 17% of them are (while 54% of the student body is Latino). The share of Asian teachers has increased slightly, while the share of African American teachers remains unchanged. Research shows that teachers of color play a critical role in helping students of color succeed.

As California’s schools continue to implement new math and science standards, the challenge of developing a larger and more diverse teacher workforce will loom large. There are examples of efforts both in California and in other states designed to address some of these challenges. For example, Call Me MISTER in South Carolina aims to recruit college students to increase the incoming teacher pool, while other programs—like Boston Public Schools’ High School to Teacher Program—reach out to students in high schools. In addition, some programs focus on recruiting members of the local community (e.g., Teach Tomorrow in Oakland, the San Francisco Teacher Residency program, and the Grow Your Own programs in Illinois).

These initiatives represent potential models, but they would need to scale up quickly to address the challenges ahead. PPIC’s ongoing research into the implementation of the Next Generation Science Standards suggests that the high demand for quality science teachers is an emerging implementation concern.


Video: John Chiang’s Priorities

John Chiang, the state’s treasurer and a candidate for governor this year, was asked last week to name the top three issues that will make the most difference for the state’s future. The question is the first one Mark Baldassare, PPIC president and CEO, asks of all gubernatorial candidates appearing before PPIC audiences. Chiang said his priorities are

  • Education
  • Housing
  • Jobs, climate change, health care—issues Chiang lumped together as the “things that are absolutely critical in everybody’s life.”

Chiang praised Governor Jerry Brown for the state’s K–12 finance formula that targets extra resources toward lower-income students, English Learners, and those in foster care. He said he would target more money toward students with special needs.

Referring to the state’s housing situation as an “extraordinary crisis,” Chiang said that even if an affordable housing bond measure passes in November, the state will need to return to the voters to get more money. He advocated reviving local redevelopment agencies, which the governor eliminated in 2011, to give local governments an economic tool to build housing.

Chiang referred to his background as treasurer, state controller, and member of the state Board of Equalization in emphasizing the need to ensure a way to pay for proposals such as single-payer health care—an idea he said he favors in concept. While describing the current system as inefficient, he said that the state can’t achieve single payer health care immediately. How long will it take? Chiang said more clarity from the federal government is crucial to understanding what the state can afford. “Let’s build what we can build. We don’t have to build a mansion at the beginning. Let’s build a starter house.” Chiang also said that the state needed to figure out how to insure an additional 2.9 million Californians who are currently uninsured.

The conversation with Chiang is part of the PPIC Speaker Series on California’s Future. PPIC is inviting all major candidates for governor to participate if they reach a certain threshold in the polls. The goal is to give Californians a better understanding of how the candidates intend to address the challenges facing our state.

Watch all candidate videos


Video: Keeping Students on Track for College

Only about 30% of California 9th graders are expected to earn a bachelor’s degree—a startling statistic in a state that faces a shortfall of college graduates. A new PPIC report finds that the vast majority fall off the path to a college degree in the last two years of high school or the first two years of college.

Report coauthor Niu Gao presented the analysis in Sacramento last week, along with recommendations for tackling the problem. Among them: updating high school graduation requirements, offering more of the college preparatory courses required for admission to California State University (CSU) or the University of California (UC), and improving placement policies in both high schools and community colleges to ensure that students take the classes needed to progress.

Gao’s presentation was followed by a panel discussion among experts who work in this area. In a conversation moderated by Hans Johnson—report coauthor, and director and senior fellow at the PPIC Higher Education Center—participants touched on challenges, as well as potential solutions.

Jorge A. Aguilar, superintendent of the Sacramento City Unified School District, noted that while more students are completing college prep courses—known as a–g courses—many aren’t making it to or through college. Part of the problem, he said, is the “fundamental disconnect between K–12 and higher education.” Having worked in both sectors, he noted there are insufficient incentives for school districts to focus on persistence in higher education and for higher education to work with K–12 on the issue.

Kimberly Rodriguez, chief education advisor to Kevin de León, state senate president pro tempore, addressed one of the report’s key recommendations: increasing state high school graduation requirements in math. She noted that requiring a–g courses for graduation has been much discussed at the state level.

“The biggest barrier has always been money,” she said. “Because once you require it, the state is on the hook.” Implementation is also complicated, she said, requiring planning and attention to infrastructure—as districts that have already adopted these requirements have found.

The third panelist, Jim Dragna, talked about a promising initiative. Known as the “graduation czar” at CSU Sacramento, he supervises the Finish in Four program. Students are asked to pledge to take 15 credits a semester—the number needed to graduate in four years—and are provided extra resources to ensure they stay on track.

“Student progression problems have been with us so long that they’ve become part of the culture,” he said. So, he continued, “we tackled the culture.”

California Needs More College Prep Courses

Most California high school graduates are not ready for college. Despite the steady improvements over the past decade, less than half of graduating seniors in the class of 2016 completed the a–g requirements, the set of courses high school students must complete to be eligible for admission to the University of California (UC) or California State University (CSU). The completion rate is substantially lower among Latino (37%), African American (34%), economically disadvantaged (37%), and English Learner (10%) students.

PPIC’s new report looks at the role of several institutional factors that may improve the completion rate, including high school graduation requirements, course placement policies and practices, and academic counseling and advising. But there is another significant barrier: not every high school in California offers the full a–g course sequence.

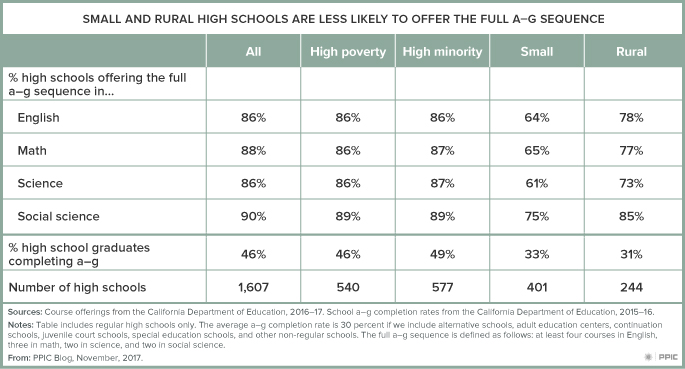
During the most recent school year (2016–17), 12% of California high schools did not offer the full math sequence, which includes algebra 1, geometry, and algebra 2. Similarly, 14% of high schools did not offer four years of a–g approved English courses. High-poverty schools (where more than 75% of students are eligible for free or reduced-price lunch) and high-minority schools (where more than 75% of students are African American or Latino) were just as likely as schools overall to offer the full sequence. But small schools (those at the bottom 25th percentile of the enrollment distribution) and rural schools were much less likely to do so. Close to 40% of small schools did not offer the full science sequence, which includes two years of approved science courses, and more than a third did not offer the full math or English sequence.

The difference in course offerings has contributed to low a–g completion rates at small and rural schools. For instance, the average a–g completion rate is 46% among all high schools, but only 30% or so among small or rural schools.

College Prep Blog Table

To improve student readiness for college, districts and schools need to increase the number of a–g approved courses. However, some schools may face capacity and resource limitations, such as not having enough qualified teachers. One solution is to establish a regional or statewide virtual school network so students in small or rural schools can enroll in online courses offered by other districts. Several states—including Florida (Florida Virtual Education), Wisconsin (Wisconsin Digital Learning Collaborative), Texas (Texas Virtual School Network), and Georgia (Georgia Virtual School)—have in recent years partnered with school districts to provide academic courses and test prep for all middle and high school students. California’s UC Scout program is a step in the right direction, providing a full set of online a–g courses accessible at no cost to students at participating schools.

K–12 Test Scores Vary Widely across Student Groups

The 2017 test results for California’s public K–12 school students were essentially unchanged from 2016. But behind the overall results, there were significant differences among student groups. Economically disadvantaged students—mostly those who are eligible for free or reduced price school meals—continued to score far below students not in this category. Students with disabilities and English Learner (EL) students performed at levels significantly below those of low-income students. Gaps in achievement among these groups were essentially unchanged in 2017.

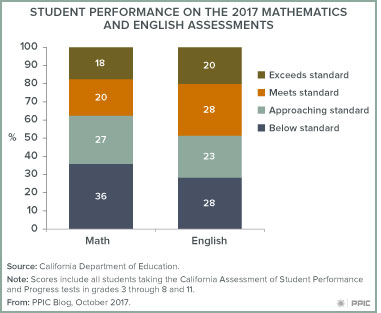
Known as the California Assessment of Student Performance and Progress (CAASPP), tests in English and mathematics are administered to virtually all K–12 students in grades 3 through 8 and in grade 11. Students take the computer-based assessments in late spring each year. The scores are reported across four performance levels. In English this year, 45% percent of students performed at the top two levels, which signal that they are working at or above the state’s standard for proficiency. About 28% of all tested students fell into the lowest performance level, “below standard.” In comparison, fewer students had mastered the mathematics skills needed to meet state standards, with 38% earning a proficient score. More than a third (36%) scored at the lowest performance level.
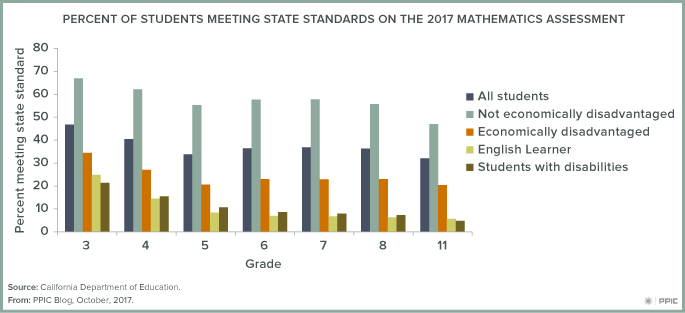
When we look at the proportion of students in each grade who scored at the two top performance levels on the mathematics test, we see that 47% of third graders meet the standard, while fewer students in subsequent grades meet state standards. By grade 11, only 34% are at the top two levels.


The state’s Local Control Funding Formula recognizes that family income is highly related to student success, and the test results reflect that relationship. Only 33% of economically disadvantaged students in third-grade and 20% in eleventh grade scored at proficient levels in mathematics. For students who are not economically disadvantaged, proficiency rates are more than twice as high—68% in third grade and 48% in eleventh grade. This divide is particularly important because 60% of students tested are economically disadvantaged.

Fewer than one-quarter of third grade students with disabilities or English Learners met the state’s mathematics standard. Performance is lower in the higher grades, and by grade 11 only about 5% of these groups are scoring at proficient levels. These data, however, understate the performance of these students. English Learner students who master English are reclassified as fluent, and are therefore no longer included in the EL group; the testing data show that reclassified students perform at higher levels than native English speakers. Also, newly arrived EL students in grades 3 through 11 tend to lower average EL test scores. These dynamics result in the data showing persistently low EL proficiency rates. A similar dynamic affects special education scores.

The new test scores reemphasize the need to boost outcomes for California’s low-income students. Students who are not considered low-income perform pretty well, yet even this group’s mathematics achievement lags in the higher grades. The data also underscore the need for better information on English Learners and students with disabilities. It is likely that the progress of these students is better than suggested by these scores. The state should consider using the individual student data to develop more accurate measures of progress for EL students and other groups.

PPIC Polling and the Immigration Debate

This post is excerpted from a presentation to the PPIC Board of Directors and guests on September 12, 2017, in Los Angeles.

One of the most important issues for Californians in the first year of the Trump administration is changing federal immigration policy. Immigrants are a significant presence in California, and even more so in Los Angeles County. Los Angeles, the state’s most populous county, is home to more than 10 million people, including more immigrants than any other California county. Twenty-seven percent of California’s population is foreign born—about twice the US percentage—while 35% of Los Angeles County population is foreign born. Moreover, about 2.6 million undocumented immigrants—about a quarter of the total number in the US—live in California. More than 800,000 of these undocumented immigrants live in Los Angeles. Major shifts in federal immigration policy that are under way thus have profound impacts on California and Los Angeles.
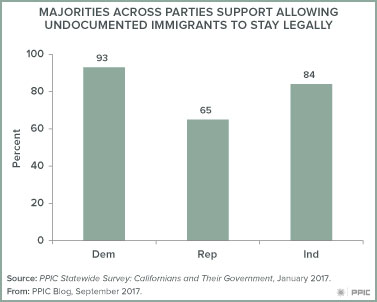
Since January, PPIC has been monitoring state and local responses to changing federal immigration policy through our public opinion polling. We have asked 11 questions about federal immigration policy in four monthly surveys, each involving 1,700 California adults, including more than 400 adults from Los Angeles County, interviewed by landline and cellphone in English or Spanish. The margin of error is +/-3% for California and +/-6% for Los Angeles. While the country is politically divided on immigration issues, we have found some bipartisan agreement in California. Here’s a sampling of our findings this year:

  • Undocumented immigrants living in the US: In our January PPIC Statewide Survey, 85% of Californians and 89% of Los Angeles residents agreed that undocumented immigrants who are living in the US should be allowed to stay legally. These results are consistent with earlier PPIC surveys. Moreover, solid majorities were in favor of state and local governments making their own policies and taking actions, separate from the federal government, to protect the legal rights of undocumented immigrants in California (65% California, 73% Los Angeles).
  • Border wall, travel ban on residents of six Muslim-majority nations: In our March PPIC survey, when asked about building a wall along the entire Mexico border, more than 7 in 10 were opposed (72% Californians, 76% Los Angeles). In the same survey, about 6 in 10 (58% California, 63% Los Angeles) opposed the president’s revised travel ban involving six Muslim countries.
  • Immigration enforcement and schools: In our April survey, 46% of Californians and 55% of Los Angeles residents said they are very concerned that increased federal immigration enforcement efforts will impact undocumented students and their families in their local public school districts. More than 6 in 10 (65% Californians, 73% Los Angeles) favored having their local public school district designated as a sanctuary safe zone in order to protect its undocumented students and their families from federal immigration enforcement efforts.
  • Worries about deportation, impact of enforcement on business and jobs: In our May PPIC survey, 30% of Californians and 34% of Los Angeles residents said they worry a lot that someone they know could be deported as a result of increased federal immigration enforcement. About half said that increased federal immigration enforcement will have a negative impact on businesses, jobs, and the economy in their part of California (49% California, 53% Los Angeles).

As the federal policy landscape shifted this year, PPIC Statewide Surveys continued to find majority support for a path to citizenship for undocumented immigrants who are living in the US: in our March survey, 68% of Californians and 71% of Los Angeles residents remained supportive. In contrast to the political divide in the rest of the nation, strong majorities across parties in California continue to agree that undocumented immigrants who are living in the US should be allowed to stay legally.

California’s path forward on immigration is a work in progress, as is the case in other areas that are undergoing federal and state policy changes. Moreover, there are uncertainties about federal actions such as the fate of the DACA program—which protects young undocumented immigrants brought to the US as children from deportation—the imposition of fiscal sanctions on sanctuary states and cities, the ban on travel from Muslim countries, and the construction of a wall along the US-Mexico border. As we have seen, California’s immigration policymaking is occurring in the context of strong public opposition to federal shifts, high levels of public concern about how these shifts are affecting undocumented immigrants and our regional economies, and strong support for actions by state and local governments to protect the legal rights of undocumented immigrants. At PPIC, we hope to foster conversations about immigration that lead to a better future for all Californians.

Learn more
Find out more about the PPIC Statewide Survey.

Regional Action to Boost College Success

California needs 1.1 million more workers with bachelor’s degrees by 2030 to keep up with economic demand, PPIC research has found. Three regions will play an especially critical role in addressing this challenge: Los Angeles County, the Inland Empire, and the San Joaquin Valley.

Improving college enrollment and graduation rates in these regions could help close more than half of this projected statewide skills gap, according to a new PPIC report, Meeting California’s Need for College Graduates: A Regional Perspective. It analyzes the challenges ahead and recommends ways to meet them. At a Sacramento event, report coauthor Kevin Cook summarized the findings and a panel of experts described promising initiatives already underway in these regions. Report coauthor Hans Johnson, director of the PPIC Higher Education Center, moderated the panel discussion.

Panelist Benjamin Duran, executive director of the Central Valley Higher Education Consortium, said his group has created a partnership of public and private colleges and universities, as well as community college districts, from Kern through San Joaquin Counties. One of the consortium’s projects involves improving remedial education, which has traditionally consisted of non-transferable classes that delay—and all too often end—students’ college careers. Under the newer approach championed by the consortium, students deemed underprepared for college work are able to enroll in college-level courses right away but also get supplementary support.

The Central Valley consortium is also working to encourage more students—particularly those in the community colleges—to take 15 units per semester or 30 per year so that more of them graduate on time. “When you’re able to go to school full time, the research is showing that you’re far less likely to drop out—you’re going to finish quicker,” Duran said.

Alma Salazar, senior vice president of the Center for Education Excellence and Talent Development at the Los Angeles Area Chamber of Commerce, said, “We do what all great organizations do—we take someone else’s idea and try to make it better.” The result, she said, is the L.A. Compact, modeled after an effort in Boston. It is a collaboration among area organizations, educational institutions, unions, and local government leaders. The focus is on three goals:

  • All students graduate from high school;
  • All students have access to and are prepared for success in college; and
  • All students have access to pathways to sustainable jobs and careers.

Ken O’Donnell, associate vice president of the Student Success Program Integration and Assessment at California State University, Dominguez Hills, talked about his campus’s success in improving its six-year graduation rate from about 30% to 42% in a few years. O’Donnell echoed the PPIC report, which finds that improving success rates for those already in college will have the greatest impact on the statewide skills gap. “You’ve already improved capacity without adding a single additional seat,” he said.


Learn more

Read the report Meeting California’s Need for College Graduates: A Regional Perspective
Visit the PPIC Higher Education Center