
In what was thought to be one of the most closely contested statewide races, incumbent Tom Torlakson defeated challenger Marshall Tuck to retain the job of state schools chief. In the post mortems, much will be made of the money that was spent on perhaps the most expensive race in this cycle. The conversation, undoubtedly, will focus in part on the significance that national groups attached to this race, which pitted the powerful teachers’ union against the “reformers.” Though there is some value to attempting to unpack the past, it is more important to look forward to the impact Torlakson could have on education in California in his second term.
Leading up to election day, commentators routinely described the state superintendent position as “powerless” or even “obscure.” And it is true that when it comes to making policy the state education chief plays a limited role. A great deal of policy has already been made, and what lies ahead is the difficult job of implementation. The superintendent could play a major part in deciding how these policies roll out. The California Department of Education (CDE) that Torlakson heads has more than 1,500 employees and a budget of $250 million dollars. How he chooses to allocate those resources could make a real contribution to supporting schools and districts as they grapple with major changes.
California has made more significant changes to K–12 education policy in the past four years than it made in the previous two decades:
- In 2010, the state adopted the Common Core State Standards, a decision that affects nearly every element of what happens in the classroom.
- In 2013, California scrapped its old system of distributing funds to schools and opted for a formula that directs additional dollars to districts with higher numbers of needy students. One consequence of this change was to put much more power in the hands of local decisionmakers.
- Accompanying the new funding strategy is a new approach to holding districts accountable for the performance of their schools.
- And if that isn’t enough, California has begun a new statewide testing regime that has, as yet, only been piloted. The first real round of tests will begin this spring, with results due out in the summer.
As my colleague Paul Warren and I recently observed, CDE has played a minimal role in guiding implementation of the new standards but there are several things it could do to ease the transition. There are also challenges ahead for the state when it comes to the new accountability requirements. Because the new rules were written broadly, they have probably raised more questions than they answered about what accountability looks like going forward. Finally, somebody needs to help students and parents prepare for the new test results. On average, scores are likely to be lower. That doesn’t mean that California’s children somehow became less smart over the past two years; it means that the tests are harder. This is an important distinction that will need to be communicated.
Policy implementation isn’t sexy. It is hard, roll up-your-sleeves work. If the superintendent embraces his role, he could have an impact on California education that goes far beyond symbolism.



 Likely voters today are feeling much better about the direction and economic outlook of the state.
  This year, likely voters are paying less attention to news about the candidates for governor than they did four years ago, when the race involved an open seat and a high-profile contest. In October 2010, an overwhelming majority were very (39%) or fairly closely (50%) paying attention to news about gubernatorial candidates. In our latest survey, just half of likely voters were doing so (18% very, 34% fairly). In addition, there is a big enthusiasm gap. Fewer voters today say they are “more enthusiastic about voting than usual” (53% 2010, 40% today).


 What is so special about this finding? We have been observing a slow but steady rise in the preference for lower taxes and fewer services since November 2012—when voters approved the Proposition 30 tax increase. In the 24 times since we first asked this question in our February 2003 poll, the preference for lower taxes and fewer services has usually been below 50 percent. Moreover, this preference has never exceeded 55 percent, placing the current reading close to the historic high.


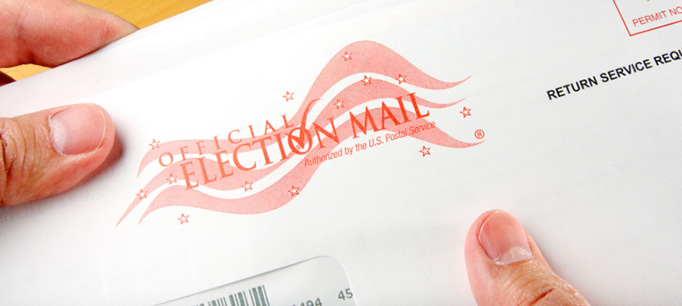
 Any such assessment must take a hard look at voting by mail. We see more voters using this option in every passing election, with the growth actually accelerating in recent primaries. If the trend continues, about 57 percent of the ballots in this fall’s election will be cast this way.