Testimony: Closing California’s Workforce Skills Gap

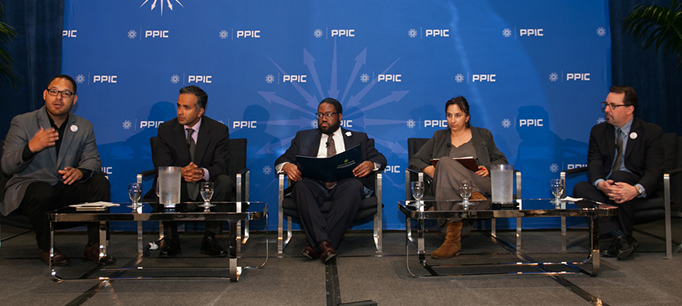
Hans Johnson, director of the PPIC Higher Education Center and PPIC senior fellow, testified before the Assembly Budget Subcommittee Number 2 on Education Finance in Sacramento yesterday (May 17, 2016). Here are his prepared remarks.


The Public Policy Institute of California (PPIC) projects that between now and 2030 California will fall 1.1 million bachelor’s degrees short of workforce demand.1 Closing this gap will require substantial improvements in access to four-year colleges, transfer rates from community colleges, and completion rates among students who enroll in college. In this testimony, PPIC identifies specific goals for access, transfer, and completion at California’s public colleges and universities, and increases in private colleges that together could close the workforce skills gap.

Our work on this issue emphasizes that closing the workforce skills gap will require strong improvements in college enrollment and completion among underrepresented groups, including low-income students, first-generation college students, Latinos, and African Americans. California cannot succeed economically unless gaps in educational attainment are eliminated or at least substantially reduced. A forthcoming report from PPIC will show how new goals for access, completion, and transfer will improve equity in California.

In our baseline scenario, which is based on current practices and procedures, California’s public and private higher education institutions will produce 3.1 million bachelor’s degrees between 2015–16 and 2029–30. This baseline scenario assumes that the state’s college enrollment rates, completion rates, and transfer rates will remain at current levels.

Our “closing-the-gap” scenario charts a course to producing 4.2 million bachelor’s degrees over the next 15 years. In this scenario, the total number of bachelor’s degrees awarded in 2029–30 would be 60 percent higher than in the baseline scenario—and it would be 72 percent higher than the number of degrees awarded in 2014–15. Such dramatic increases are not entirely without precedent. Between 2002–03 and 2014–15, the annual number of bachelor’s degrees awarded by California’s public and private universities increased almost 50 percent. Gains in earlier periods were even more impressive. For example, between 1964–65 and 1979–80 the number of bachelor’s degrees awarded at CSU increased 95 percent.

In the recent past, growth in the number of bachelor’s degrees awarded at UC and CSU was fueled primarily by increases in the number of students who enrolled in college and secondarily by increases in completion rates. Even though the share of high school graduates entering UC and CSU did not change appreciably, enrollment increased as the number of high school graduates grew.

The California Department of Finance projects that the number of high school graduates will not change substantially over the next fifteen years. This means that increasing the number of bachelor’s degrees awarded will require changes in three key thresholds in the education pipeline from high school to college to degree.

  • First, the share of recent high school graduates eligible for and enrolling in four-year colleges will need to increase.
  • Second, persistence and completion rates for students enrolled in college must increase.
  • Third, the number of students who transfer from community colleges to four-year colleges (or return to college) must increase.

The exact mix of improvements in these three areas is not set in stone. Our closing-the-gap scenario is based on empirical trends, and our current focus is on public institutions. We assume that private colleges will keep pace with those in the public sector, continuing to produce about a third of all bachelor’s degrees awarded each year. Also, we have not incorporated applied bachelor’s degrees awarded by the state’s community colleges, as those numbers are still very small. This means that UC and CSU together would need to produce an additional 730,000 bachelor’s degrees over this period and private colleges would need to produce an additional 340,000 bachelor’s degrees (a total of 1.1 million) to fully close the degree gap by 2030. Private nonprofit colleges would account for the vast majority of the additional degrees awarded by the private sector.

Our initial closing-the-gap scenario sets the following targets for the state’s public colleges and universities:

  • Eligibility will increase 5 percentage points over current levels at UC (the top 17.5 percent of high school graduates will be eligible for UC, up from the 12.5 percent share set by California’s Master Plan for Higher Education) and 6.7 percentage points at CSU (the top 40 percent will be eligible for CSU, up from the top third). These new eligibility levels will be phased in over an eight-year period.
  • The number of transfer students will increase 35 percent over baseline levels. These increases will be phased in over a five-year period.
  • Completion rates will increase 9 percentage points at UC and 17 percentage points at CSU. At UC, completion rates for students who enroll as freshmen will increase incrementally from 83 percent in 2016 to 92 percent by 2026. Completion rates for freshmen at CSU will increase incrementally from 57 percent in 2016 to 74 percent by 2030. There will be similar increases in completion rates for transfer students at both institutions.

CSU will account for most of the increase in degrees awarded over the entire projection period—it will award 481,000 additional degrees, compared to UC’s increase of 251,000. This is both because CSU is a larger institution, enrolling many more students than UC, and because CSU has much more room for improvement in graduation rates. Private nonprofit colleges would also play an important role, adding an additional 206,000 degrees. Other additional sources, such as private for-profit colleges, online degree programs, and bachelor’s degrees awarded by community colleges, will also need to play a role (see Table 1).

Most of the projected increase in degrees awarded at CSU comes from improvements in completion, while increased eligibility accounts for almost half of UC’s increase. Increased transfer rates will also be necessary to close the gap (see Table 2).

Of course, this is just one scenario for closing the workforce skills gap (our interactive model is available upon request). In the future, we expect to develop alternative closing-the-gap scenarios; we will also examine the potential impact of shortening the time it takes students to get their degrees. Additional work should assess the role that private institutions might play. Other scenarios might involve different assumptions and targets. But, however it is accomplished, closing the gap will lead to better economic outcomes for all Californians, increased state revenues, and reduced social service demands.

1. Hans Johnson, Marisol Cuellar Mejia, and Sarah Bohn, Will California Run Out of College Graduates? (PPIC, 2015).
Figure note (middle): “Other” includes online degrees, private for-profit degrees, and applied bachelor’s degrees awarded by the community colleges.
Photo credit: Public Affairs/Sacramento State

Troubled Waters for California Farmers

California farmers have been coping with major water challenges during the latest drought. We talked with Dave Puglia, executive vice president of Western Growers and a member of the PPIC Water Policy Center advisory council, about these challenges.

PPIC: What water uncertainties do California farmers face?

DAVE PUGLIA: It varies by region. In some areas, water reliability for the future is paramount. In other places, water quality requirements are more challenging. The San Joaquin Valley is facing long-term restrictions in surface water. Imperial County growers are wondering if their supply from the Colorado River will last.

In areas where water quality is key, the increasing capability to detect contaminants has led to increasing regulations to reduce pesticides, herbicides, and fertilizers. The state’s drive for perfection doesn’t recognize the realities of farming. California is treating nitrogen and nitrates as the equivalent of industrial solvents. Nitrogen is necessary to produce food, and we’re using fertilizers much more sparingly now. Many growers worry that there could one day be a virtual prohibition on the use of nitrogen, which has been used from dawn of agriculture.

Businesses hate uncertainty, and state policies on water quality and supply paint a very uncertain picture. These are multigenerational businesses with most of their assets tied up in land. They’re looking over a 20-year horizon and asking, should we continue to invest in this business in this state? They’ve experienced an immense growth in regulatory burdens in the past two decades—not just in water—and don’t see the trajectory changing. From a balance sheet perspective, it looks very dark.

I think we’ve lost regulatory balance in California. If we looked at how all these regulations work together, we could learn a lot about how these mandates add to the burden of this industry. That would force a conversation on whether we want to maintain the nation’s largest agricultural industry.

PPIC: What uncertainties does the state’s groundwater law pose for farmers?

DP: I think the biggest threat to its successful implementation rests in the fact that many growers fear they’ll lose access to adequate groundwater supplies, which won’t be replaced with surface water. In the past 20 years, the San Joaquin Valley has easily lost 2 million acre-feet a year in surface water. The biggest threat is the lack of surface water being delivered to the valley to recharge groundwater basins.

PPIC: What will it take to bridge the “fish vs. farms” divide?

DP: There is a major lack of confidence in the science used by fish agencies to make decisions on water deliveries from the Delta. The state and federal water projects are now functionally controlled by state and federal fish agencies based on the abundance of species, but their modelling seems arbitrary and questionable to many. The fish aren’t recovering, and there’s inadequate attention to other stressors that impact both salmon and smelt. Theoretically, the governor’s tunnels project has potential to break us out of this dynamic and provide adequate water reliability south of the Delta. But there’s uncertainty about it among agencies that would be required to pay for it and opposition from the environmental community. Without some big changes, I don’t see the divide getting better.

Learn more
Video: Farming’s Water Future (PPIC blog, March 2, 2016)
Visit the PPIC Water Policy Center’s water supply resource page

Video: County Jails and the ACA

A majority of inmates in California’s jail system are likely to be eligible for Medi-Cal, and providing health care coverage for them could have multiple benefits. These are the key findings of a new PPIC report, Expanding Health Coverage in California: County Jails as Enrollment Sites.

Coauthor Shannon McConville presented the report to a Sacramento audience last week. She noted that the 4 million state residents who are still uninsured will probably be the toughest to reach. The legislature has allocated money to target these Californians and increase enrollment in health coverage under the Affordable Care Act (ACA).

At the same time, counties—which have gained new responsibilities for low-level criminal offenders—have new incentives to help inmates successfully transition back into the community and avoid further contact with the criminal justice system.

“Health coverage, newly available under the ACA, could be part of a more comprehensive reentry strategy,” McConville said.

Managed care plans are also increasingly focused on better integrating physical health and behavioral health, providing more mental health and substance abuse treatment—services needed by the jail population.

These policy changes add up to an opportunity to leverage federal and state Medi-Cal resources to improve both public health and safety. Enrolling inmates could improve health care in the jail system, lower county corrections costs, and reduce recidivism.

McConville said the work to achieve these goals is just beginning. Counties are still adjusting to their new responsibilities. As a first step, they will need to identify effective enrollment strategies that improve reentry and reduce recidivism.

Testimony: California’s Exclusive Electorate & the 2016 Election

Mark Baldassare, PPIC president and CEO, testified before the Assembly Select Committee on Civic Engagement in Los Angeles today (May 13, 2016). Here are his prepared remarks.


“If the trends in voting continue, we face the prospect of an electorate making policy choices that neglect the realities and problems facing large segments of California society.” I wrote these words in a 2006 PPIC report, California’s Exclusive Electorate. The report analyzed trends in the state’s electorate from 1990 through May 2006 and polling results from the PPIC Statewide Surveys from 2005 to 2006. It revealed the gulf in political preferences between the state’s voters and the majority of its adult population, and suggested that if California’s nonvoting adult population made their voices heard at the ballot box, the political status quo could change—dramatically. In other words, the choices that voters make do not necessarily represent the preferences—or the needs—of California’s broader population. These disparities could be a problem for any state and are not unique to California.1 However, for California, a state that calls on its voters not only to elect representatives but also to make so much policy through ballot initiatives, these disparities raise real concerns.

In the years since that report, voter participation has continued to fall while the state’s population has become larger and more diverse. This troubling trend, especially notable in primaries and midterm elections, has motivated a statewide conversation about advancing civic engagement and increasing voter participation in California. Compounding this concern is our finding that California’s likely voters—who decide the fate of candidates and ballot initiatives—do not represent the demographics or the policy preferences of the state’s adult population.

At a time when new approaches to boosting voter turnout are being implemented and proposed, and as we approach the 2016 presidential election, it seemed important to update our work on the electorate. Using PPIC Statewide Survey data from 2015—drawn from about 12,000 interviews during seven monthly surveys that included voting and nonvoting adult Californians—our 2016 PPIC report paints a comprehensive picture of likely voters and their nonvoting counterparts. Once again, we find that the people who go to the polls in California are very different from those who don’t; they have different demographic characteristics—such as age, education, homeownership, immigration, income, and race/ethnicity. They also have different political attitudes and policy preferences. As California’s population continues to expand and change, the voting rolls are not keeping pace, and the state’s voters remain unrepresentative of its population.

In our 2016 report, we found a strong connection between economic inequality and political inequality. Likely voters in California tend to be older, white, college educated, affluent, U.S. born, and homeowners. They tend to identify themselves as “haves”—rather than “have nots”—when asked to choose between these two economic categories. Nonvoters tend to be younger, Latino, renters, less affluent, less likely to be college educated, and not U.S. born—and they generally identify themselves as “have nots.” Voters and nonvoters differ noticeably in their views on the role of government, taxes and spending, ballot choices, and elected officials—all of which come into play during an election year and influence governing choices in the long term.

California’s recent steps to encourage voter participation are a step in the right direction, but the divide between voters and nonvoters is deep and persistent. Why has the exclusive electorate phenomenon that we identified 10 years ago been so difficult to change? State laws that make it easier to register to vote and cast ballots are helping to expand the electorate, but only to a limited degree. When eligible adults are asked why they are not registered to vote, most cite a lack of confidence or a lack of interest in elections, a lack of trust in government, and a lack of time to vote. When registered voters are asked why they do not always vote, their top reasons are a lack of interest and time and low levels of confidence and trust.2

More fundamentally, the broad demographic and economic shifts underway in the state are shaping the divide between California’s voters and nonvoters today. Immigration is one important factor. Millions of California adults are documented and undocumented noncitizens. The share of the adult population that is undocumented is on the decline, but it is still a large segment of California society. Public and private efforts are needed to encourage more noncitizens to become citizens and join the voter rolls. Comprehensive federal immigration reform that provides a path to citizenship is another key ingredient in creating a larger and more diverse electorate. Other powerful socioeconomic factors help determine political participation. A significant share of California’s population is living in poverty, housing costs in coastal regions are high, and the state economy is likely to face a shortage of college-educated workers in the near future. Efforts to increase economic opportunity through policies that produce high-paying jobs, provide affordable housing, and increase college graduation rates would also grow and diversify the electorate.3

How will these ongoing trends in political and economic inequality affect the 2016 election cycle? As is always the case, voter turnout will increase and demographic profiles will broaden for the November presidential election. Still, we expect to see a large divide between voters and nonvoters this year. Once again, California faces the prospect of an electorate making policy decisions that neglect the realities and problems facing large and growing segments of society.

What are the larger consequences of uneven participation rates and low voter turnout? First, the fact that a relatively small group of voters is making decisions about elected representatives and public policy raises serious questions about the legitimacy of the democratic system. Next, because the haves in society are the frequent voters, and so many of the have nots are not voting or are not registered to vote, our electoral process does not reflect the broad economic and political interests of all adults. Last, likely voters and nonvoters have different perspectives on the role of government, government spending, ballot choices, and the state’s elected officials.

What might happen if voters were more representative of California’s adult population? There could be more voter support for policies that increase spending for health care and education, and for an expansion of the government’s role in improving the lives of immigrants and the less economically advantaged. If large numbers of new voters continue to register with “no party preference” and the proportion of major party voters continues to shrink, the power of independent voters in determining election outcomes could be bolstered. Finally, growth and change in the electorate could initially produce more political instability, as elected officials, candidates, political parties, and initiative campaigns reach out to a larger and more diverse electorate.4

In the long run, having a larger and more engaged electorate that is more representative of the people of California would be a source of political stability for a state that increasingly relies on the ballot box to make its major policy decisions.

1. Raymond E. Wolfinger and Steven J. Rosenstone, Who Votes? (Yale University Press, 1980); Eric Plutzer, “Becoming a Habitual Voter: Inertia, Resources, and Growth in Young Adulthood,” American Political Science Review 96 (1): 41-56, 2002; Karthick Ramakrishnan, Democracy in Immigrant America, (Stanford University Press, 2005); Mark Baldassare, At Issue: Improving California’s Democracy (Public Policy Institute of California, October 2012); Jan E. Leighley and Jonathan Nagler. Who Votes Now? (Princeton University Press, 2014).
2. Mark Baldassare, Dean Bonner, David Kordus, and Lunna Lopes, “Voter Participation in California,” Just the Facts (Public Policy Institute of California, September 2015).
3. Laura Hill and Joseph Hayes, “Undocumented Immigrants,” Just the Facts (Public Policy Institute of California, June 2015); Sarah Bohn, Caroline Danielson, and Monica Bandy, “Poverty in California,” Just the Facts (Public Policy Institute of California, December 2015); Hans Johnson, Marisol Cuellar Mejia, and Sarah Bohn, Will California Run Out of College Graduates?, (Public Policy Institute of California, October 2015); Hans Johnson and Marisol Cuellar Mejia, California’s Future: Housing, (Public Policy Institute of California, February 2015).
4. Jack Citrin, Eric Schickler, and John Sides, “What If Everyone Voted?” American Journal of Political Science 47 (1) 75-90, 2003; Mark Baldassare, At Issue: Improving California’s Democracy, (Public Policy Institute of California, October 2012); Jan E. Leighley and Jonathan Nagler, Who Votes Now? (Princeton University Press, 2014).

Assessment and Placement at Community Colleges

The assessment and placement process often represents the first point of contact between incoming students and community colleges. This process aims to evaluate students’ readiness for college-level English and math courses, and for those deemed underprepared, to determine appropriate placement into the remedial—also known as developmental—education sequence. Estimates suggest that 75%–80% of incoming community college students across the state enroll in developmental education in at least one subject.

Despite the prevalence of this process, little is known about how the state’s community colleges assess and place students into math and English courses. The last statewide survey on this topic, conducted over five years ago by WestEd, found that community colleges used placement tests extensively, but the cut-off scores for placement varied a great deal across campuses. Additionally, the survey showed that the use of other student achievement measures for placement was sparse and unsystematic.

Greater clarity regarding assessment and placement is crucial for two reasons. First, decisions made about a student’s readiness for college have significant implications for that student’s educational trajectory. In California’s community colleges, only 40% of underprepared students ever complete a degree or transfer, compared to 70% of their college-prepared peers. Research shows that developmental education may discourage students or “divert” their academic progress, as students spend considerable time and money on developmental courses, but these credits do not count toward a college degree or transfer.

Second, the possible overreliance on placement tests may be cause for concern. The Community College Research Center has found that the placement tests commonly used at colleges across the country are not strongly predictive of student success in college-level courses. In fact, these tests tended to under-place students, meaning students were placed into developmental courses when they could have passed college-level courses. This research also demonstrated that high school grades and other pre-existing student achievement data could do a comparable or better job at predicting success in college-level courses.

More comprehensive research in these areas would allow the state’s community colleges to identify assessment and placement reforms that help improve outcomes for all students. As a step forward in this effort, the Public Policy Institute of California (PPIC) is collecting survey data on the current assessment and placement policies and practices at California Community Colleges. These survey results will help pinpoint the different measures used to assess the math and English skills of incoming students and the ways in which these measures determine appropriate placement.

This research comes at an important time, since more change is underway. As part of the Common Assessment Initiative, over the next several years, community colleges will begin to use a common placement test, set locally determined cut-off scores, and enhance their use of multiple measures. PPIC’s survey will establish a benchmark of the assessment and placement process prior to the implementation of these statewide reforms.

Closing California’s Health Insurance Gap

California has made great strides toward closing the health insurance coverage gap under the Affordable Care Act (ACA). In 2014, the state reduced the share of the population that was uninsured by 5 percentage points, or about 2 million people. Early evidence suggests the state made additional gains in 2015, but more than 3 million California residents continue to lack health insurance and many are eligible for free or subsidized coverage. Reaching them may have benefits beyond meeting the state’s health coverage goals, including the potential to improve public safety and public health.

The characteristics of the remaining uninsured are striking. Younger men (those under age 45) make up less than one-fifth of California’s adult population but represent more than one-third of the uninsured. When we examine other characteristics of Californians who continue to lack coverage, we find the highest uninsured rates among those facing high levels of disadvantage. Uninsured rates among adults with low levels of income, education, or employment are above 30 percent. And when we focus more closely on young men with high levels of disadvantage, uninsured rates are well above 50 percent.

Because highly disadvantaged young men are detached from educational and labor market institutions, they are likely to be among the hardest to reach through traditional sites of enrollment. They are also disproportionately represented among people who are arrested and incarcerated in county jails and state prisons.

In our study of a subset of California counties, we find that more than three-fourths of individuals booked into jail are men under age 45. Within the counties under study, nearly half a million individuals flowed through the jail system in 2014. Given the substantial overlap in the characteristics of the uninsured and the characteristics of individuals who have contact with the criminal justice system, county jails may provide an opportunity to target a share of the remaining uninsured.

Enrolling county correctional populations in health coverage may also support efforts to improve reentry outcomes under Public Safety Realignment by reducing the likelihood of recidivism. Specifically, chemical dependency treatment and outpatient mental health programs have been associated with reductions in repeat arrests and fewer total arrests.

Many county jail systems are engaged in some form of enrollment assistance. However, approaches and resources vary across the state. Counties may take a “front door” approach, offering enrollment screening to the large group of individuals being booked into jail. Or they may take a “back door” approach, offering enrollment assistance to a much smaller group of individuals nearing the end of their sentences, as part of reentry planning. When resources are limited—and they almost certainly are—counties face trade-offs between providing some form of assistance to a large population and providing in-depth assistance to a smaller group.

This variation across counties creates an opportunity to identify best practices in providing enrollment assistance. Further, we can help counties that successfully enroll a substantial share of their correctional populations to evaluate the effects of enrollment on recidivism. This kind of research can inform efforts to make the most cost-effective use of criminal justice resources.


Chart Source: American Community Survey, Public Use Microdata Sample, 2014.
Chart Note: Insurance coverage is measured at the time of the survey. Results shown are for all California adults ages 18–64. Income levels are presented as poverty rates based on federal poverty level (FPL) thresholds related to income eligibility cutoffs for health insurance coverage programs including Medi-Cal (under 138% FPL), premium and copayment subsidies available for coverage purchased through Covered California (138%–250% FPL), and premium subsidies only for coverage purchased through Covered California (250%–400% FPL).


Regulating Marijuana as a Crop

In the 20 years since marijuana was legalized for medical use in California, it has become an increasingly legitimate crop in the state’s agricultural landscape. Yet despite relatively steady progress in moving marijuana cultivation out of the shadows, important questions remain about the crop’s impact on water and the environment, and whether the state can regulate these issues successfully.

Last year the state legislature passed laws designed to regulate medical marijuana production. Should Californians vote to legalize recreational marijuana use this fall, the state will need to take an even more active role in regulating production, as argued in a recent PPIC report.

Marijuana growing has yet to move to large-scale production, but that could change with shifts in state or federal laws. Both the total amount of marijuana produced and number of cultivation sites are difficult to estimate. An often cited but uncertain estimate is that California has about 50,000 cultivation sites. A recent effort to map grows in Humboldt County suggests that most have less than 100 plants and typically cultivate less than one acre. These small grows are usually located far from improved roads and often scattered on steep slopes. Currently, only 7 percent of grows in Humboldt County are on what could be considered prime agricultural land.

The biggest environmental concerns regarding marijuana cultivation—or any agricultural commodity, for that matter—are water use, deforestation, and water pollution. Given the small size of most grows, marijuana production currently does not appear be a major driver of deforestation in California, although building access roads may cause erosion and fragment wildlife habitat.

And although it has been reported to be a thirsty plant, recent estimates of marijuana’s water use in Humboldt County—one of the state’s biggest growing areas—suggest that under 2,000 acre feet a year is used for that county’s entire crop. This is enough to irrigate about 400 acres of almonds (for scale, California currently has more than a million irrigated acres of almonds). Some water used for marijuana irrigation comes from headwater streams that are home to sensitive species, and water use tends to increase in the fall when these watersheds are most stressed. If the crop were to be widely grown in drier areas, water impact might increase. Recent proposals for large marijuana greenhouse operations in Southern California desert communities also raise questions about water supply.

State regulations have recently given regional water quality boards and county governments better tools to manage marijuana growing. The North Coast Regional Water Board has adopted regulations requiring all marijuana operations over 2,000 square feet to enroll in a program requiring monitoring and potential cleanup for water discharge and diversions at existing marijuana operations. Humboldt County has introduced one of the state’s first land use ordinances for marijuana production, which limits cultivation size based on zoning type and square footage of the parcel.

The legal market for marijuana in California is likely to expand, especially if voters approve recreational use this fall. This presents both opportunities and challenges. The state can establish rules that make access to the market contingent upon following environmentally responsible and water-smart growing practices. The challenge is that for the regulations to be meaningful, they must be enforced. State and county officials will need to monitor the location of grows and practices, and collect information that can guide future policies to effectively reduce the crop’s impact on land and water resources. Accomplishing that will require adequate time and staff.

Learn more

Read “California Streams Going to Pot from Marijuana Boom” (PPIC blog, July 23, 2015)
Visit the PPIC Water Policy Center

Photo credit: North Cascades National Park Service

America’s College Promise: An Opportunity for California

The cost of college has become a prominent issue in the presidential campaign as tuitions increase, student debt inflates, and candidates attempt to appeal to a growing generation of younger voters. Though candidates and policymakers disagree on the specifics, providing free tuition for community colleges has emerged as one popular policy prescription. Recently, two of California’s candidates for US Senate – Kamala Harris and Loretta Sanchez—voiced support for this idea.

Last year, President Obama proposed legislation entitled America’s College Promise, which would have provided federal funding to states to make two years of community college free to academically eligible, first-time students. However, Congress blocked this program, citing the $79.7 billion price tag. Additionally, the program drew criticism from a range of stakeholders.

Many suggested that providing free tuition would do very little to help with the full cost of college. In California, only about 10% of the total cost of attending community college is related to tuition and fees because state subsidies and tuition waivers cover most of these costs. Instead, the state’s high cost of living, most notably in housing, constitutes the largest financial burden for community college students.

The most recent iteration of the program has sought to address this criticism. The president’s 2016 proposed budget includes a request for $1.6 billion as part of a 10-year, $60.3 billion program that would create a partnership with states to make a maximum of three years of community college free for eligible students. The federal government would cover three-quarters of the program’s cost and states would cover the rest. Participating states must meet certain performance requirements regarding student outcomes and state funding increases for higher education. And to avoid spending on those who can more easily afford community college, students must have an adjusted gross income below $200,000.

These changes in the program benefit states with low tuition. States will receive a payment for each eligible student equal to 75% of the national average of community college tuition. If a state’s tuition is below the national average—as California’s is—the additional funding may be used for other higher education purposes. Given that California’s tuition is low but its living expenses are high, this provision would allow the state to direct the extra funding—about $1,000 per eligible student—toward low-income students to help pay for books, transportation, housing, food, and other necessities. This extra funding could help low-income students in community colleges and at public four-year colleges afford the true cost of attending college.

In response to the proposed federal program, the state legislature has introduced a suite of bills known as the California College Promise. These bills would eliminate community college tuition and direct new funding to expand eligibility for the community college fee waiver program, increase funding for the Cal Grant program, and help community colleges establish regional coordination efforts with K-12 feeder schools and public four-year colleges and universities.

Even if federal funding for a long term program like America’s College Promise is unlikely to materialize in a presidential election year, the fact remains that reducing the cost of college has become a prominent issue. Proposals to provide free community college have clearly resonated with a broad coalition of voters, policymakers, and advocacy groups. As congressional debate continues regarding reauthorization of the Higher Education Act of 1965, which approves spending on federal financial aid programs, we can expect the conversation surrounding college affordability and access to intensify.

Chart source: NCES Integrated Postsecondary Data System (IPEDS)

Learn more

Read Higher Education in California: Making College Affordable
Visit the PPIC Higher Education Center

Early Results from Education Reforms

California’s K–12 system is implementing an unprecedented number of reforms. The state’s school funding system and curriculum standards are new, as are all statewide tests. A new school accountability system is being developed. A number of large urban districts are changing their high school graduation requirements. These reforms are designed to equalize opportunities for students and close achievement gaps among demographic groups.

It will be some time before we know what all of these changes add up to, but PPIC researchers who examined the early results of two reforms presented their findings at a PPIC event in Sacramento last week.

California’s New Standardized Tests

PPIC senior fellow Laura Hill summarized the results of California’s new standardized tests, the focus of a PPIC report she coauthored. The scores show that English Learners and economically disadvantaged students are far behind other student groups—possibly farther behind than initially thought. As the accountability system evolves in the state, the test results are an important call to action for districts and schools struggling to help high-need students, Hill said. High-need students did well in some schools and districts, and the first-year results provide an opportunity to learn from their experiences.

College Prep for All?

Julian Betts, an economics professor at the University of California, San Diego, and PPIC adjunct fellow, examined a high school graduation requirement that makes college preparatory courses mandatory for all students. Major urban school districts—including Los Angeles, San Diego, San Francisco, and Oakland—recently implemented this requirement, making it mandatory for students to complete the a–g sequence of classes required for admission to the University of California or California State University. Based on a PPIC analysis of the San Diego Unified School Districts’ Class of 2016, Betts and his coauthors concluded that this requirement is likely to help many students but damage the prospects of others. He suggested steps that San Diego and other districts can take to help lower-achieving students meet the new graduation goals.

Learn more

Visit PPIC’s K–12 education pages
Visit the PPIC Higher Education Center