The President’s Popularity and the Midterm Election

California is a battleground state in the 2018 midterm election. When it comes to determining the party that will lead the next US Congress, all eyes are on the 14 US House seats that are currently held by Republicans in the deep-blue state of California. Democrats would need to “flip” several of these seats if they have any chance of taking control of the US House, where Republicans currently now have a 26-vote margin. The party in power has typically lost some of its congressional seats in national midterm elections. Whether it is a few seats or many is closely tied to the president’s popularity. So, how is Donald Trump viewed in California at the end of his first-year anniversary in office?

The PPIC Statewide Survey has been tracking President Trump’s popularity, asking the following question in six monthly surveys in 2017, “Overall, do you approve or disapprove of the way that Donald Trump is handling his job as president of the United States?” We found majority disapproval of President Trump among California likely voters in each survey. In the January 2017 PPIC survey, conducted in his early days in office, 34% approved and 55% disapproved of his job performance. In the 2017 December PPIC survey, which is our most recent poll, 34% approved and 63% disapproved of President Trump. In the course of 2017, disapproval of the president increased as more likely voters formed opinions about his leadership.

By the end of the first year, we also found that disapproval of President Trump increased by double digits in several likely voter groups. In comparing the January 2017 PPIC survey to the December 2017 PPIC survey, disapproval increased

  • 21 points for those younger than 35 (63% to 84%)
  • 15 points among independent (i.e. no party preference) voters (50% to 65%)
  • 12 points among college graduates (62% to 74%)
  • 12 points among those who earn under $40,000 a year (57% to 69%)
  • 11 points for those who earn $80,000 or more (55% to 66%)
  • 10 points among Latinos (72% to 82%)

Moreover, from January to December 2017 disapproval became the majority response among men (49% to 58%), those age 55 and older (49% to 57%), and those with some college education (50% to 58%).
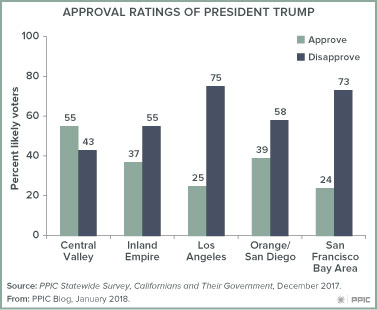
Regional trends in presidential disapproval ratings also point to a challenging environment for Republicans running in House elections this year. Predictably, there is overwhelming disapproval of President Trump in the Democratic strongholds of Los Angeles (75%) and San Francisco (73%) in the December 2017 PPIC survey. More surprisingly, over the course of 2017 disapproval of Trump’s performance increased to majority levels in Orange/San Diego (50% to 58%) and the Inland Empire (39% to 55%), where several of the House seats that are now held by Republicans are located. Coincidentally, two Republican House members in Orange/San Diego decided not to run for reelection.

There are two bright spots for Republicans in the president’s approval ratings. First, President Trump has held a solid base of support among Republican likely voters, according to a comparison of the January 2017 PPIC survey (76% approve) and the December 2017 PPIC survey (78% approve). Second, his approval increased to a majority in the Central Valley according to a comparison of the January 2017 PPIC survey (40%) and the December 2017 PPIC survey (55%). Importantly, several of the House seats now held by Republicans are in the Central Valley.

Finally, in placing the 2018 midterm election in recent historical context, it is especially noteworthy that the level of disapproval of President Trump at the end of his first year in office is relatively high compared to the past two US presidents. The December 2009 PPIC survey found that a majority of California likely voters approved of President Barack Obama (54% approve, 40% disapprove) in the midst of the Great Recession. The December 2001 PPIC survey found that overwhelming majorities approved of President George W. Bush (78% approve, 20% disapprove) in the wake of the 9/11 terrorist attack.

In California, the combination of presidential disapproval ratings (63%) and voter registration trends (45% Democrat to 26% Republican) sets the stage for the Republicans’ efforts to hold on to House seats to maintain control of the US Congress. However, the wildcard in the 2018 California election is the size and composition of the voter turnout—and in the 2014 midterm election, turnout hit a record low.

The PPIC Statewide Survey will be closely monitoring President Trump’s approval ratings, as well as indicators of the voters who are motivated to cast ballots in what will be a consequential election for California and the nation.

Video: Travis Allen’s Priorities

Mark Baldassare, PPIC president and CEO, asked Assemblymember Travis Allen, candidate for governor in 2018, to name the top three issues with major consequences for the state’s future—a question Baldassare has asked of all gubernatorial candidates appearing before PPIC audiences. Allen said his top priorities would be

  • Cutting taxes
  • Getting tough on crime, and
  • Fixing roads and expanding freeways

Allen, who is campaigning to repeal the state gas tax increase passed last year, said California is already collecting enough tax revenue to improve roads and unclog the freeways.

“We can fix our roads, we can expand our freeways, we don’t need to raise taxes further to do it,” he said. He added that voters should be the ones to decide if they want to raise taxes.

The conversation with Allen is part of the PPIC Speaker Series on California’s Future. PPIC is inviting all major candidates for governor to participate if they reach a certain threshold in the polls. The goal is to give Californians a better understanding of how the candidates intend to address the challenges facing our state.

Watch all candidate videos

Information Gaps Hinder Progress on Safe Drinking Water

The short answer to the question, “How many Californians lack access to safe drinking water?” is, “Too many.” Everyone deserves to have ready access to clean water. But understanding the extent of the problem is less straightforward. Some recent strides have been made in compiling data on communities with drinking water violations, but more work is needed to help scope solutions, prioritize actions, and track progress.

The biggest data gaps are for domestic wells or very small water systems that are not regulated by the federal Safe Drinking Water Act (SDWA). Estimates of this population vary widely—from 1 to 2 million—and the state lacks good data on how many of these residents face water safety problems. Developing tracking systems for this population is an ongoing priority.

California also has data gaps for the thousands of water systems regulated by the SDWA that serve the vast majority of the state’s residents: community water systems with more than 15 connections and other public systems such as schools. The State Water Board’s new Human Right to Water (HR2W) portal reports monthly compliance, population served, location, and pollutants present in the water. It provides an easier way to see which systems are currently failing to meet safe drinking water standards. But information gaps in the new system make it hard to translate the data into action.

As of November 2017 this portal showed that just over 300 water systems, serving roughly 490,000 people, were out of compliance. About 13% of these systems are schools, serving roughly 13,000 people; the rest are community water systems. More than 90% of the non-compliant community systems are small, serving fewer than 3,300 people; 75% serve fewer than 500 people. Small systems are more likely to violate drinking water standards and to lack the technical, financial, and managerial capacity to resolve these issues on their own.

While the HR2W portal provides a valuable snapshot, it falls short of providing the detail needed to understand and track drinking water challenges in public systems. The information is not organized to enable users to see relevant patterns, such as long-running violations or multiple violations per system. Knowledge of safe drinking water regulations is required to parse which systems are in the most trouble. This tool would be more useful if the data were summarized by water system, with an overview of how long a system has been out of compliance and how serious the violations are.

A useful model for organizing safe drinking water data comes from the US Environmental Protection Agency, which publishes Enforcement and Compliance History Online (ECHO) to track a variety of regulatory programs. ECHO reports the number of quarters within the past three years in which drinking water systems were out of compliance. It also uses a point system to reflect the seriousness of the problem. For instance, systems exceeding standards for nitrate and pathogens get 10 points per violation, since EPA considers those problems most acute. Systems exceeding less serious standards get 5 points per violation, and each monitoring and reporting violation gets 1 point. Points accumulate for issues that remain unaddressed. ECHO provides a compliance summary for each system, and enables the user to drill down into violation details.

Using information from ECHO, we find that more than 80% of California’s non-compliant drinking water systems, serving 280,000 residents, have been out of compliance for at least three years (see figure). Nearly three-quarters of these systems have at least 20 unaddressed violation points. As expected, problems are most persistent and severe in small—and especially very small—systems. And they are most prevalent in the San Joaquin Valley—home to roughly 10% of California’s population and nearly half of the state’s non-compliant water systems.

California should draw from the federal ECHO model to improve its HR2W. The state might want to customize the ECHO point system to reflect local conditions―for instance, where state standards are stricter than federal standards. The state is working on adding new metrics, such as water affordability, to HR2W. Additional priorities include providing indicators of progress in addressing violations, such as funds allocated. And instead of flagging only systems that have a safety violation, the state could track systems that are behind on monitoring and reporting because this could foreshadow future violations of water quality standards.

More accessible and transparent data would help build momentum for action. This is especially important in light of ongoing efforts to create a sustainable funding source for safe drinking water in affected communities—such as the current legislative proposal to levy surcharges on agricultural chemicals and urban water bills. Such a program would require a robust tracking system for efficient governance of the funds. With some improvements, HR2W could help prioritize actions and investments in communities that need it most.

Legislative District Data Offers Close-Up View of Poverty

Poverty varies widely across California’s 58 counties—from 13.1% in Placer County to 24.9% in Los Angeles County—according to data from the California Poverty Measure (CPM). The CPM is an ongoing collaboration between PPIC and the Stanford Center on Poverty and Inequality that adjusts for differing housing costs across counties and incorporates major social safety net programs like CalFresh food assistance and the Earned Income Tax Credit (EITC).

For the first time, PPIC recently released CPM data showing poverty rates and the effects of safety net programs not just for counties, but also for state assembly and senate districts and US congressional districts.

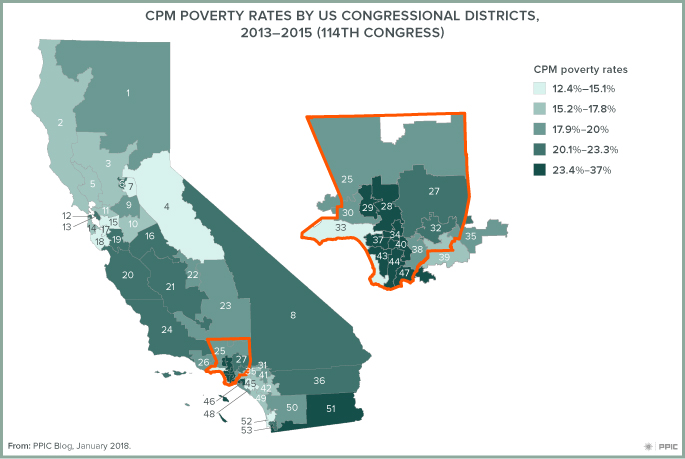
Congressional districts provide a more detailed view of densely populated areas. While counties have static geographic boundaries, California’s congressional districts are adjusted after every decennial census to equalize their populations (in 2010, each of the 53 districts contained 702,905 people). This means that Los Angeles County’s 9.9 million residents, for example, vote in 18 different congressional districts. The county’s average poverty rate of 24.9% reflects both the 13.4% in poverty in District 33 and the 37.0% in District 40, a stark difference illustrated in the map below.

As might be expected, district-level data show even wider geographic variations in poverty than county-level data, from 12.4% in District 15, which includes parts of Alameda and Contra Costa Counties, to 37.0% in District 40, in Los Angeles County. The CPM also shows that without safety net programs, the variation would be even more extreme, ranging from 16.2% in District 33 to 50.3% in District 40.

While counties often take the lead in implementing programs that mitigate poverty, many funding decisions related to social safety net programs are made at the state and federal levels. Understanding the distribution of poverty can help policymakers at all levels develop short- and long-run strategies to alleviate it in every area of the state.

A Look Back at the Year in Water Policy

A year of extreme events—from heavy rains that strained dams to high heat and massive wildfires—revealed the many ways California’s variable climate can impact water management. In 2017 the PPIC Water Policy Center explored how the state is managing such extremes and suggested improvements to help us prepare for an even more volatile future climate. Here are a few highlights.

  • Our evaluation of California’s urban water systems revealed that they have become adept at drought management thanks to diversified supplies, cooperation with neighbors, and programs to manage demand. But the state’s conservation mandate in 2015 opened a debate on how to manage water scarcity. We reviewed evolving state and local roles in urban drought management and described areas for improved cooperation to strengthen resilience.
  • Five dry years took a toll on groundwater, a critical drought reserve. Some farm areas saw steep declines in local aquifers. Our assessment of water stress in the San Joaquin Valley—California’s largest agricultural region and “ground zero” for groundwater concerns—summarizes sustainable management solutions. Our survey of groundwater recharge practices by valley water suppliers sheds light on what more can be done to advance recharge efforts.
  • The state’s headwater forests are in poor health and at increased risk of severe wildfire. Our review of current management practices explains steps needed to shift the emphasis from fire suppression to forest management and how to pay for these improvements.
  • The way California manages water for the environment is focused on responding to crises rather than building capacity to weather future dry spells. We undertook an in-depth evaluation of how to improve conditions for native fish and reduce conflict over water for the environment. We also proposed a better way to account for environmental water, with an example from the Sacramento–San Joaquin Delta.

The PPIC Water Policy Center’s efforts were collaborative in nature—involving research teams from across California and conversations with policy makers, water managers, and other stakeholders—and we broadened the conversations through a series of public events.

This year will bring major decisions on funding for safe drinking water, investing in water storage, sharing scarcity on the Colorado River, and conveying water through the Delta. To help inform the debate on these and other complex issues, we created a policy brief that summarizes problem areas and priorities for action. This brief was released in conjunction with our second annual water conference, which brought together leaders from across the state to discuss the ways forward.

Looking ahead, the water team is working on the potential effect of climate change on future droughts, pathways to water sustainability in the San Joaquin Valley, and the impact of drought on water quality and wastewater management.

The mostly dry December has left many wondering what 2018 will bring. But one thing is certain: we’re thankful for the opportunity to promote creative and collaborative solutions to California’s most difficult and pressing water challenges. And we are thankful for your support of this important work.

With best wishes for 2018,

Ellen Hanak

P.S. If you’re not yet receiving our weekly blog post by email, you can sign up here. And if you’d like to support the center’s work, learn more here.

Majority Opposition to Drilling Includes Coastal Republicans

In yet another sign that the shifting federal policy landscape is at odds with California public opinion, the Trump administration is proposing new offshore oil and gas drilling across all of the nation’s coastal waters. The five-year leasing plan includes areas previously off limits to oil and gas exploration since the 1980s. It proposes to open up 90% of the nation’s offshore reserves through new federal leases. California’s governor, lieutenant governor, attorney general, and US senators—quick to voice their opposition to this proposal—are aligned with most Californians’ views on offshore oil drilling.

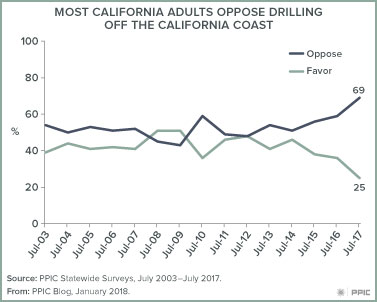
The PPIC Statewide Survey has asked the question, “Do you favor or oppose allowing more oil drilling off the California coast?” every July since 2003. In the 2017 PPIC survey, a record low 25% of California adults favored more oil drilling off the California coast while a record high 69% opposed it. What’s most remarkable is the agreement over time on the topic of offshore oil drilling. Since the early 2000s, a slim majority has been in favor of drilling only twice (51% in 2008 and 2009); in most years a majority has opposed it. Moreover, public consensus on this topic has grown. Since July 2012, support for more oil drilling has dropped by 23 points (48% to 25%) while opposition has grown by 21 points (48% to 69%).
In the 2017 PPIC Survey, a surprising level of agreement on the topic occurred across all major demographic categories of California residents. Majorities were opposed across age, education, gender, income, and racial/ethnic groups. Strong majorities across the state’s major regions opposed more drilling. That includes coastal Californians (23% favor, 72% oppose) and inland Californians (29% favor, 64% oppose) alike.

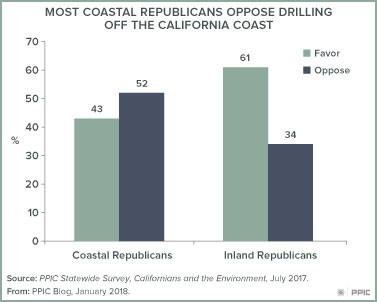
It is often said that the Trump administration is “playing to its base” in a polarized environment by proposing policies that are clearly at odds with Californians’ views. However, we found in the 2017 survey that majorities of conservatives, moderates, and liberals alike (55%, 71%, 83%, respectively) opposed more oil drilling off the coast. Democrats (14% favor, 81% opposed) and independents (30% favor, 68% opposed) were strongly opposed, while Republicans were divided (50% favor, 45% oppose). However, majorities of coastal Republicans joined with other regional and political groups in opposing more offshore oil drilling.
What’s behind the solid public opposition to more offshore oil drilling in California? In the 2017 PPIC Survey, 73% of California adults said that the condition of the ocean and beaches was very important to the economy and quality of life for California’s future. We found that those who held these views—and they were widely held across political, demographic, and regional groups—were overwhelmingly opposed to more offshore oil drilling.

Stay tuned as the PPIC Statewide Survey monitors this topic and other issues—such as the Affordable Care Act, climate change and energy, federal tax reform, marijuana legalization, and immigration—as changing federal policies may have big effects on California. We are planning for an interesting and important year for PPIC polling in 2018!

Flood Prevention 101: Stay Out of the Floodplain

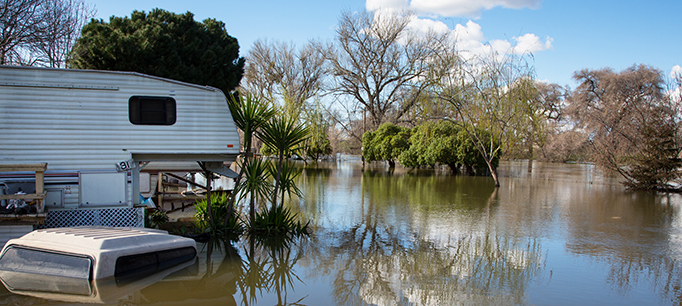
What did the catastrophic hurricane season of 2017 tell us about how we’re managing flood risk? We talked to Nicholas Pinter—a flood and floodplains expert at the UC Davis Center for Watershed Sciences and a member of the PPIC Water Policy Center research network―about improving flood management.

PPIC: Why did Hurricane Harvey result in so much damage to Houston?
Nicholas Pinter: Houston has had very bad land use planning—it is built on flood-prone land, and its inadequate storm drainage makes flooding worse. Combine these glaring flood-management flaws with the unprecedented rainfall that Harvey brought and you’ve got a truly epic flood disaster. Harvey’s damage is clearly a product of both human choices and the storm’s intensity.

The number and magnitude of recent extreme storms are consistent with predictions for a changing climate. There’s a nagging feeling among some of us who study flood disasters that maybe we’ve reached a sort of tipping point, with short-duration storms dumping unprecedented rainfalls.  Harvey may be an example of this.  And if it is happening, our window of opportunity to improve flood systems may be shrinking.

PPIC: What are your top priorities for reducing flood risk?

NP: One thing that scientists, floodplain managers, and many politicians agree on is that we must limit floodplain development. A lot of the damage from Harvey was supposed to be prevented by the National Flood Insurance Program (NFIP). But the program failed in Houston in large part due to the failure of its primary goal—to discourage development in floodplains.

With the enactment of the NFIP in 1968, the US government agreed to provide subsidized flood insurance in exchange for local controls on building in floodplains. Communities that prohibit development on their floodplains can get underwritten insurance through the program (private flood insurance options are very limited).

But enforcement of the NFIP’s floodplain rule is very mixed across the US. A good example is Illinois. For the past 25 years, that state has aggressively enforced floodplain regulations and limitations. On other end of spectrum is Texas, where they embraced development and seemed to see floodplain limitations as job killers. Differences in enforcement explain many of the documented differences in flood damages and flood resilience.

PPIC: How are we doing on flood management in California?

NP: California is doing a lot of things right, and is learning from its past mistakes. A lot of money has been invested in improving levees. California is enforcing NFIP standards and trying to limit new construction on its floodplains (though with exceptions). But the Oroville crisis was a big wake-up call. If the emergency spillway had failed—and we were within hours of it—Oroville could have been a lethal disaster similar to Katrina. All eyes are now on aging dams as well as levees.

One issue I’d like to see improvement on is flood insurance. While many other states are net recipients of NFIP, California receives something like 14 cents on every dollar it pays in premiums to the program.  This appears to reflect California’s more rigorous effort to limit flood damage in its floodplains.

FEMA (the Federal Emergency Management Agency) recognizes wide differences in NFIP enforcement nationwide and has proposed a national disaster deductible to push back on states with poor enforcement and benefit those doing a good job. A second option being considered is a state-by-state rating system. And yet another option is for California to create its own flood insurance vehicle.

PPIC: Is there an argument for learning to live with flooding and rebuild after disaster strikes?

NP: A century ago the strategy was largely to live with floods. People clustered near rivers and had a tolerance for getting their feet wet occasionally. Fast forward to current times: a big leap in the density and value of infrastructure has greatly diminished that tolerance.

It’s very easy to creep forward gradually onto floodplains and much harder to back away from the flood hazard this brings. So the first and most valuable lesson is to stop creeping forward and strictly limit new floodplain development.  In some cases, opportunities exist to set back levees and reconnect rivers to their floodplains. These kinds of efforts often can provide valuable, multi-layered benefits.

California’s Brain Gain

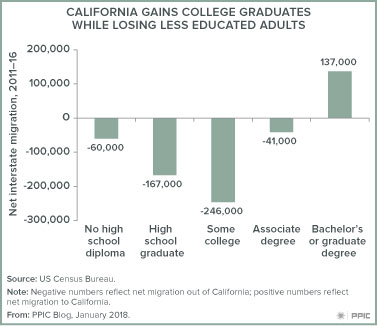
Recently released data from the US Census Bureau show that even as California continues to experience large net losses of residents moving out of state, the state is still a net importer of college graduates from other states. This interstate migration pattern—gaining large numbers of college graduates while losing large numbers of less educated adults—is unique among the states. Over the past five years, California has attracted 137,000 more college graduates (adults with at least a bachelor’s degree) from other states than it has sent to those states. For comparison purposes, the University of California (UC) awarded about 250,000 bachelor’s degrees at its nine undergraduate campuses over this same time period. In other words, interstate migration provides California with half as many college graduates as the entire UC system.

College graduates come to California from all over, but seven states send California substantially more college graduates than they get in return. Between 2011 and 2016, net gains of college graduates from New York (45,000), Illinois (32,000), New Jersey (20,000), Pennsylvania (17,000), Michigan (15,000), Florida (14,000), and Massachusetts (14,000) totaled more than 150,000. California experienced sizable net losses of college graduates to just four states: Texas (-26,000), Oregon (-20,000), Nevada (-14,000), and Arizona (-11,000).
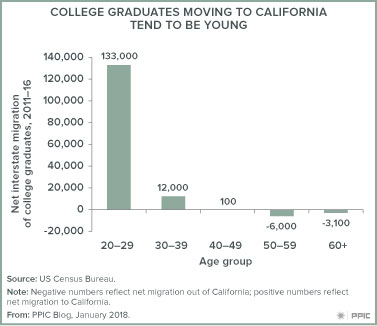
The new migrants to California tend to be quite young. Indeed, college graduates age 20–29 account for almost all of the net gains. (In contrast, California experiences small net losses of older college graduates.) From a labor market perspective, attracting young college graduates is especially advantageous. Young adults with college degrees are at the start of their careers and provide the state with much-needed highly educated workers. The largest gains are in majors that are in relatively high demand in the labor market, including engineering (22,000), social sciences (19,000; mostly economics and political science), computer science (17,000), communications (17,000), biology and health sciences (14,000), and business (13,000).

The migration of young college graduates to California is a consequence of the state’s growing demand for highly skilled and highly educated workers. But the numbers are not high enough to meet the state’s changing needs. PPIC’s research has shown that by 2030 California will face a shortfall of 1.1 million college graduates. Failing to keep up with the demand for skilled workers could curtail economic growth and limit economic mobility—resulting in a less productive economy, lower incomes, less tax revenue, and increased dependence on the social safety net. Although many college graduates move to California from other states, the most important source of highly educated workers in California are the state’s colleges and universities. Policies and practices to improve college access and completion in the state will ensure that more Californians are able to help create and benefit from a strong economy.

Commentary: Will California’s Pot Law Limit Illegal Marijuana Sales?

This commentary was published in Newsweek on January 2, 2018.

The new year brings with it a new age of legal marijuana: As of Monday, the growing, sale and use of recreational cannabis in California is now legal for individuals over the age of 21. But will it change much in the state?

Read the full commentary on newsweek.com.

High Housing Costs Hurt College Affordability

A majority of Californians say affordability is a problem in the state’s public colleges and universities, according to the PPIC Statewide Survey. In addition, three-quarters of residents in the survey agree that the price of college prevents students who are qualified and motivated from going to college. Not surprisingly, state leaders are exploring new strategies to help students and families better cope with college costs. Most current approaches, such as state and institutional financial aid, focus primarily on tuition relief. This makes sense, as tuition more than doubled at California universities from 2006 to 2012—and is on the rise again.

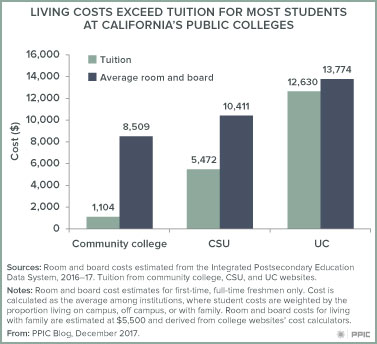
However, housing costs also play a significant role in the total cost of attending college. Californians are well aware of the issue: 85% of residents in the PPIC survey say colleges and universities should do more to make sure that all students have affordable housing options. Indeed, even with the rapid increases in tuition, living costs for many students exceed tuition at California’s public institutions—the state’s community colleges, California State University (CSU), and the University of California (UC). Average room and board costs also differ substantially across the three systems, from $8,509 per year at the community colleges to $13,774 at UC.

These differences in costs are related to whether students live on campus, off campus on their own, or off campus with family. Estimated average costs of housing and food for students living on campus top $13,000 per year, and those living off campus pay an average of $10,000 to $13,000 in room and board. The costs associated with living with family are not estimated in the available federal data, but most college websites suggest these costs range from $5,000 to $6,000—about half the cost of living on or off campus.

Students’ housing choices also partially depend on where they go to school. Only nine cities in California have UC campuses (excluding UCSF which only enrolls graduate students), and most UC freshmen live on campus in their first year. Historically, the 113 community colleges and 23 CSU campuses have been seen as local and low-cost options. Indeed, both systems show about 30% or more of freshmen living with their families, which helps keep average room and board costs lower than at UC. But it is worth noting that the share of CSU freshmen living on campus may grow. More dorms are being built on CSU campuses as administrators see on-campus housing as a strategy to increase graduation rates. Data on students’ living arrangements are based on institutional reporting on freshmen who receive some sort of federal financial aid, which includes more than 60% of students at most institutions.

As state leaders reexamine the goals in the 1960 Master Plan for Higher Education and consider changes to financial aid, they should take into account the role that living costs play in the total cost of education.

Learn moreRead the PPIC Statewide Survey: Californians and Higher Education
Visit the PPIC Higher Education Center