The Top Two and Turnout in California’s Primary

California voters face many decisions on a long and crowded June 5 primary ballot. None will be more closely watched than the choices made in the top-of-the-ticket governor’s race that will determine the top two candidates in the November election runoff. Six candidates—four Democrats and two Republicans—have been serious contenders in this race. In the May PPIC Survey, Democrat Gavin Newsom continues to lead the pack, with little separation between Republican John Cox and Democrat Antonio Villaraigosa for the coveted second-place finish. It’s a toss-up if the gubernatorial race will include two Democrats or a Democrat and a Republican. Why does this matter so much?

It is likely that a Democratic candidate will prevail—no Republican has won a statewide election since 2006. Since then, the gap in partisan registration has ballooned to 19 points (44% Democrat, 25% Republican; Secretary of State, April 2018). The issue today is turnout. The partisan makeup of this November’s electorate has consequences for the Democrats’ efforts to flip several Republican House seats in competitive California districts (Cook Report, May 10) to gain party control of the US Congress. Without a candidate at the top of the ticket, Republicans have one less reason to vote.

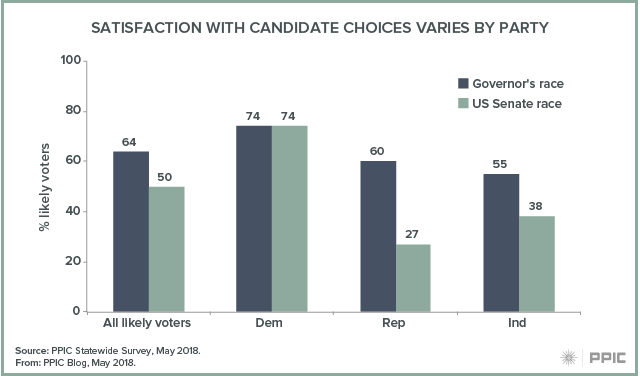
Californians have warmed up to the current gubernatorial contest. The May PPIC Survey finds that likely voters’ interest in news about the gubernatorial candidates has almost doubled since January (30% to 58%). Equal proportions of likely voters across parties are very or fairly closely following election news today (58% Democrats, 61% Republicans, 60% independents). Moreover, likely voters’ satisfaction with the candidate choices has grown since January (54% to 64%)—especially among Republicans, who were the least satisfied earlier this year. Majorities of likely voters across parties are now satisfied with their choices (74% Democrats, 60% Republicans, 55% independents). In addition, more likely voters have found a candidate to support for governor since January (76% to 85%), and by similarly large margins across parties (86% Democrat, 86% Republican, 81% independent) today. Democratic pluralities are favoring Newsom, Republican pluralities are supporting Cox, and independents are dividing their support across two parties and four candidates.

By contrast, we need to look no further than the US Senate primary to foreshadow the impact of a one-party governor’s contest this fall. Democratic US Senator Dianne Feinstein is on the ballot with Democratic California State Senator Kevin de León. There are no major candidates from the Republican ranks in this race. In the May PPIC Survey, likely voters’ satisfaction with senate candidate choices (50%) is much lower than in the governor’s race (64%), with vastly different satisfaction levels across parties (74% Democrat, 27% Republican, 38% independent). More importantly, fewer voters have found a candidate to support in the senate race (64%) than in the governor’s race (85%), and this trend is especially pronounced among the GOP likely voters (87% Democrats, 41% Republicans, 53% independents) today.
The top-two system was created in 2010 to encourage the growing ranks of independent voters to participate in the June primary. Third parties countered that their voters would be shut out of the November election, an outcome that has largely proven true. With the dwindling ranks of Republicans today, another flaw that impacts the two-party system has surfaced—lack of participation from those feeling unrepresented on the ballot. And with deepening partisan divisions in the country, voters cannot be counted on to cross party lines and choose a candidate from outside their ranks. Republicans face an unprecedented obstacle of unknown proportions if a one-party governor’s race depresses their turnout. In the long run, California’s democracy has a bigger problem if many voters are feeling disenfranchised by the top-two primary results and choose not to participate in a statewide election. To fully assess the significance of these issues, PPIC surveys will continue to track voter interest, candidate satisfaction, and ballot choices in this consequential election.

Video: California Primary Preview

In the run-up to California’s June 5 primary, Democrat Gavin Newsom remains the top choice among likely voters in the governor’s race, according to the latest PPIC poll. Republican John Cox is in a close race with Democrat Antonio Villaraigosa to gain the second spot on November’s general election ballot. Senator Dianne Feinstein holds a wide lead over fellow Democrat Kevin de León.

Dean Bonner, PPIC associate survey director, detailed these findings and more at a recent Sacramento briefing.

The survey shows Newsom (25%) leading among likely voters, followed by Cox (19%), Villaraigosa (15%), Republican Travis Allen (11%), and Democrats John Chiang (9%) and Delaine Eastin (6%). Fifteen percent of likely voters are still undecided. Results were similar in an April PPIC poll (26% Newsom, 15% Cox, and 13% Villaraigosa). Cox’s support has more than doubled since the January (7%) PPIC poll.

Other highlights of the survey include:

  • A majority of likely voters (63%) favor Governor Brown’s final budget, and overwhelming majorities like his idea of additional one-time spending on infrastructure, homelessness, and mental health programs.
  • Immigrants are viewed as a benefit to the state by a majority of likely voters (67%) because of their hard work and job skills. The vast majority (80%) favor a way for undocumented immigrants to stay in the US legally—if certain requirements are met.
  • Californians are divided on the motivation of the Russia investigation, but a strong majority of likely voters (74%) think the Russian government tried to influence the outcome of the 2016 presidential election.
  • Californians distrust both the state and federal government—just 18 percent of likely voters say you can trust Washington to do what’s right.

Video: Californians and Education

In the wake of the Parkland, Florida, killings, the latest PPIC survey finds an overwhelming majority of Californians are concerned about a possible shooting in their local schools. But most oppose having teachers carry guns in school facilities.

Lunna Lopes, PPIC researcher, detailed these and other key findings at a Sacramento briefing last week.

When asked about school shootings, 73 percent of California adults and 82 percent of public school parents say they are very or somewhat concerned. Yet two-thirds of adults (67%) and public school parents (68%) oppose allowing more teachers and school officials to carry guns in schools. Strong partisan differences emerge on this issue. An overwhelming majority of Democrats (86%) and a strong majority of independents (69%) are opposed to arming teachers and school officials, while a solid majority of Republicans (60%) favor the idea.

A few other survey highlights include:

  • Californians (65%) support having local school districts declared sanctuary safe zones for undocumented students, but there are deep partisan divisions.
  • California adults and likely voters continue to see the state’s K–12 funding as inadequate. Solid majorities (60%) of likely voters favor local school bonds, while fewer (48%) support local parcel taxes for schools.
  • Across parties, majorities of likely voters agree that gubernatorial candidates’ positions on K–12 education are very important.
  • Among likely voters in the gubernatorial race, Democrat Gavin Newsom maintains his lead (26%), followed by Republican John Cox (15%) and Antonio Villaraigosa (13%). Nearly a quarter of likely voters (22%) remain undecided.

The Gender Gap in California Politics

In the past year, women have led large-scale political protests nationwide and an increasing number are running for elected office. In California, likely women voters have a numeric edge over men (53% to 47%), according to PPIC’s analysis. With the midterm elections quickly approaching, will women make a pivotal difference?

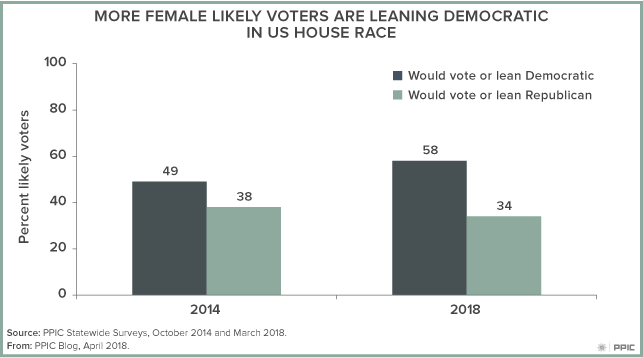
PPIC’s March 2018 survey offers some insight: nearly six in ten women (58%) support the Democratic candidate on the generic ballot for the U.S. House of Representatives—a 9-point increase since 2014. Preferences among men are unchanged.

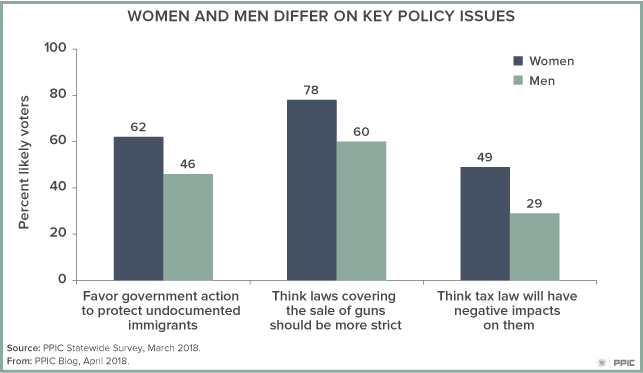
Although PPIC surveys show female likely voters are much more likely than their male counterparts to disapprove of President Trump (67% to 52%), issues like immigration policy, gun control, and taxes also reveal degrees of a gender gap. Examples include:

  • Immigration policy. Six in ten female (62%) likely voters are in favor of state and local governments making their own policies—separate from the federal government—to protect the rights of undocumented immigrants; fewer than half of men (46%) are in favor.
  • Gun control. While solid majorities of men and women think laws covering the sale of guns should be stricter, more women (78%) than men (60%) hold that view.
  • Federal tax law. Differences are also apparent between women (49%) and men (29%) who believe that the tax laws will have a negative impact on their families in the coming years.

However, it is important to note the role that party plays in policy preferences. For each of the aforementioned issues, there are sizable differences between Democratic women and Republican women. It’s also notable that among Republican likely voters, more women (54%) than men (38%) think gun laws should be stricter.

California is often mentioned as a battleground state in the 2018 elections, and tension between the federal and state governments is palpable. California’s government stands in opposition to many policies coming out of Washington and several of its congressional seats could be up for grabs—potentially determining the party that will lead the next US Congress. As a result, the nation will be watching California. And the PPIC Statewide Survey will continue to follow the perceptions and preferences of California’s likely voters, with particular interest in the gender gap.

California’s Immigrants and the 2018 Election Context

This piece is excerpted from a presentation at the USC Annenberg School for Communication and Journalism given on March 30, 2018, in Los Angeles.

Many eyes will be on California in this midterm election year, especially since control of Congress may hinge on the outcome of 10 competitive House races in the Golden State. Currently, more than a quarter of the state’s residents are born outside the US—and one in five immigrants make up what we consider likely voters in California elections. With federal immigration policy playing a lead role in today’s polarized political discussions, will California’s immigrants have an impact—and to who’s advantage—in the 2018 election?

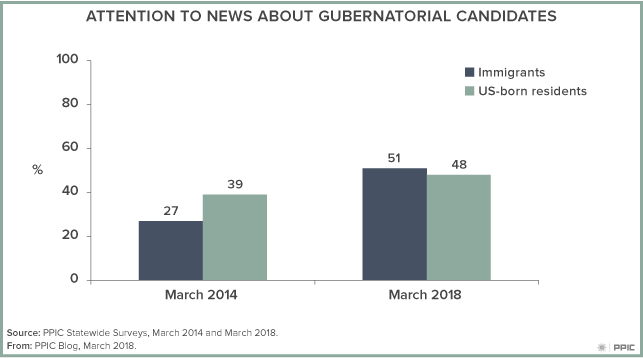
Typically, California’s immigrants are less interested in politics than their US born counterparts. But not when it comes to the 2018 election cycle. Among likely voters in our current survey, immigrants and nonimmigrants are similarly likely to be following the news about gubernatorial candidates “very” or “fairly” closely (51% immigrants, 48% US born). Both groups say that voting this year is more important than in past midterm elections (47% immigrants, 51% US born). Perhaps most telling for this year, both likely voter groups mention immigration and illegal immigration when asked about the issue that they would most like to hear the gubernatorial candidates talk about before the June primary (23% immigrants, 23% US born).

When it comes to current candidate choices, we do see some divergence between immigrant and US-born likely voters:

  • Democrat Gavin Newsom slightly trails Democrat Antonio Villaraigosa among immigrants (17% to 23%), while he is favored by three to one over Villaraigosa among nonimmigrants (30% to 9%).
  • Republican John Cox does equally well with both groups (15% immigrants, 14% US born).
  • Democrat Dianne Feinstein is favored by large margins over Democrat Kevin de León both among immigrants (50% to 18%) and nonimmigrants (40% to 16%). She has a higher approval rating among immigrants than nonimmigrants (68% to 51%).
  • Immigrants are more likely than nonimmigrants to favor the Democratic candidates in their local House races (63% to 51%) and less likely to favor the Republican candidates (30% to 41%). Immigrants also give higher approval ratings than nonimmigrants to their current local House member (59% to 51%).

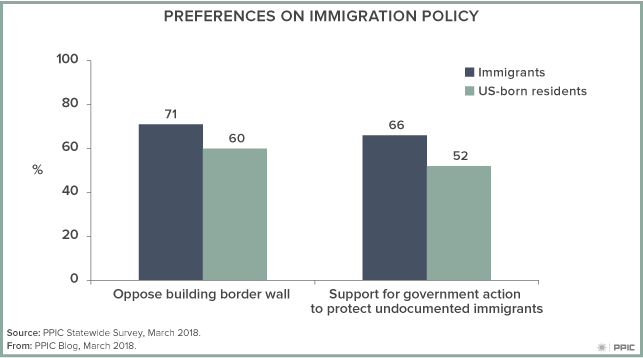
Despite these differences, immigrant and nonimmigrant Californians are aligned in their views of the current policy landscape. Majorities in both likely voter groups disapprove of President Donald Trump (63% immigrants, 60% US born), oppose the new federal tax law (65% immigrants, 56% US born), want gun laws to be stricter (82% immigrants, 67% US born), and oppose building a wall along the entire border with Mexico (71% immigrants, 60% US born). When it comes to state and local governments making their own policies and taking action separate from the federal government, majorities in both likely voter groups say they are in favor of protecting the legal rights of undocumented immigrants (66% immigrants, 52% US born).

One of the political wildcards in this California mid-term election is whether the strong opposition to federal immigration policy will motivate more naturalized citizens to vote and more noncitizens to become citizens and register to vote. As noted earlier, immigrants make up a larger share of the state’s population than is reflected in the likely voter group—leaving much room for growth that could transform the state’s electorate. The PPIC Statewide Survey will be closely monitoring the trends in political engagement and ballot choices in this consequential election for California and the nation.

Video: Preview of the California Primary

As California’s June 5 primary approaches, the latest PPIC survey finds Democrat Gavin Newsom gaining ground over Antonio Villaraigosa in the governor’s race, while support for Republican John Cox rises among likely voters. In the US Senate race, Dianne Feinstein holds her double-digit lead over fellow Democrat Kevin de León.

Dean Bonner, PPIC associate survey director, detailed the findings at a Sacramento briefing last week.

The survey shows Newsom (28%) as the top choice among likely voters, followed by Cox (14%), Democrat Villaraigosa (12%), Republican Travis Allen (10%), and Democrats John Chiang (6%) and Delaine Eastin (5%). Yet a quarter of likely voters are still undecided, which raises questions about what will happen in the top-two primary.

A few other highlights include:

  • Governor Jerry Brown’s approval rating (54%) has held steady, despite state-federal tension over immigration policy. The legislature’s approval rating (45%) has also stayed consistent, in spite of sexual misconduct reports last fall.
  • The top issue voters would like gubernatorial candidates to talk about before the June primary is immigration, followed by guns or school safety.
  • Nearly half of Republicans (48%) are now joining an overwhelming number of Democrats (87%) and independents (68%) in saying there should be stricter gun controls.
  • Bipartisan support emerged for a water bond measure, with two-thirds of likely voters saying they would vote yes. Partisans were more divided on affordable housing projects.

Video: Assessing California’s Redistricting Commission

The creation of the Citizen Redistricting Commission (CRC) in 2008 marked a radical departure for California. This shift of responsibility for drawing state assembly, state senate, and US congressional districts from the state legislature to an independent commission also put California ahead of the national curve. Very few states have adopted a similar model, though many may be considering it—particularly in light of two US Supreme Court cases that could establish a legal standard for partisan gerrymandering. For California and for other states, partisan fairness and competitiveness should be important aims of redistricting reform.

A new PPIC report examines whether the commission’s first plan achieved these aims by analyzing recent election outcomes and putting them in national context. Researcher Eric McGhee described his analysis in Sacramento last week and outlined some key findings.

  • The CRC largely satisfied expectations that it would draw state legislative and congressional districts that are fair to the major parties and increase electoral competitiveness.
  • While Democrats have a greater advantage under the CRC plan than they did under the 2001 plan drawn by the legislature, this advantage is very small.
  • The CRC districts are somewhat more competitive than the districts drawn by the legislature. Competitiveness in state legislative districts remains low compared to other states, but the CRC congressional plan is among the most competitive in the country.

The report also notes that the CRC has moved California in the opposite direction from the rest of the country: other state plans are on average more favorable to Republicans and less competitive than plans from the last round of redistricting.

McGhee recommends that future commissions use more data to help them produce competitive and fair maps. He also recommends using sophisticated methods for automatically drawing redistricting plans.

Californians and Sacramento’s Handling of Misconduct

During fall 2017, the #MeToo movement took the entertainment, sports, and business worlds by storm. Statehouses across the nation were also affected. Here in California, allegations of sexual harassment came to light and have led to resignations, including the recent resignation of State Senator Tony Mendoza, who was on the precipice of a formal expulsion vote. No member of the California Legislature has been expelled since 1905.

In our January survey, prior to this latest development, we found that nearly half of Californians are following news about sexual harassment and misconduct in the state legislature very (18%) or fairly (28%) closely. Women (49%) and men (43%) are similar in how closely they were following the news.

Interest in this topic is bipartisan: most Democrats (56%) and Republicans (56%) are closely following this story. However, Democrats are about twice as likely to be following it very closely.

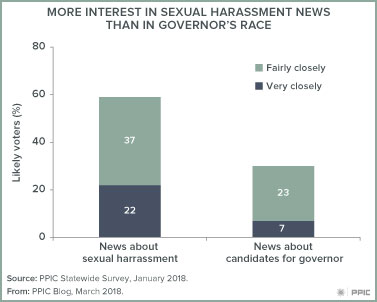
Interest is also widespread: more likely voters (59%) are closely following news about sexual harassment than about candidates for governor (30%).

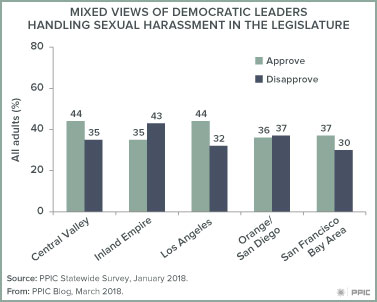
How are Democratic leaders handling the issue of sexual harassment in the statehouse? Californians’ opinions are divided (39% approve, 36% disapprove), with 25 percent unsure. Notably, women (40% approve) and men (38% approve) hold similar views. Similarly, fewer than half of Californians across regions and age, education, income, and racial/ethnic groups approve of the way Democratic leaders are handling the issue. Not too surprisingly, Democrats (52%) are nearly twice as likely as independents (28%) and three times as likely as Republicans (18%) to approve.

So far, the issue of sexual harassment in Sacramento hasn’t played a large role in the primary races. Stay tuned to see if that changes as the June election draws closer.


Video: Countdown to the Primary

Less than four months before the June primary, Democrats Gavin Newsom and Antonio Villaraigosa are in a virtual tie among likely voters in the gubernatorial race. But a quarter of likely voters are undecided—as many as support either of the front-runners in the top-two contest. In the US Senate race, Dianne Feinstein continues to lead fellow Democrat Kevin de León by double digits, with a third of likely voters undecided.

These are among the key findings in the January PPIC Statewide Survey, presented by researcher Lunna Lopes at a Sacramento briefing last week.

Among other highlights of the survey:

  • Likely voters are divided on two ideas that may be on the fall ballot: repeal of the recently passed increase in the state gasoline tax and a change in the strict limits on commercial property taxes imposed by Proposition 13. Under the property tax proposal, commercial properties would be taxed according to their fair market value but limits on residential property taxes would remain in place.
  • Most Californians favor the governor’s proposed budget and believe the governor and legislature will be able to work together and accomplish a lot. However, expectations of cooperation are low for the president and Congress.
  • Many Californians closely following news about sexual misconduct in the state legislature, and they are divided about how Democratic leaders are handling this issue so far.
  • Californians are most likely to name immigration as the top issue facing the state today, and majorities across parties favor the DACA protections.

Learn moreRead the January PPIC Statewide Survey: Californians and Their Government
Find out more about the PPIC Statewide Survey


The President’s Popularity and the Midterm Election

California is a battleground state in the 2018 midterm election. When it comes to determining the party that will lead the next US Congress, all eyes are on the 14 US House seats that are currently held by Republicans in the deep-blue state of California. Democrats would need to “flip” several of these seats if they have any chance of taking control of the US House, where Republicans currently now have a 26-vote margin. The party in power has typically lost some of its congressional seats in national midterm elections. Whether it is a few seats or many is closely tied to the president’s popularity. So, how is Donald Trump viewed in California at the end of his first-year anniversary in office?
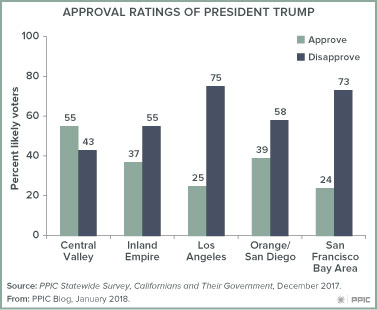
The PPIC Statewide Survey has been tracking President Trump’s popularity, asking the following question in six monthly surveys in 2017, “Overall, do you approve or disapprove of the way that Donald Trump is handling his job as president of the United States?” We found majority disapproval of President Trump among California likely voters in each survey. In the January 2017 PPIC survey, conducted in his early days in office, 34% approved and 55% disapproved of his job performance. In the 2017 December PPIC survey, which is our most recent poll, 34% approved and 63% disapproved of President Trump. In the course of 2017, disapproval of the president increased as more likely voters formed opinions about his leadership.

By the end of the first year, we also found that disapproval of President Trump increased by double digits in several likely voter groups. In comparing the January 2017 PPIC survey to the December 2017 PPIC survey, disapproval increased

  • 21 points for those younger than 35 (63% to 84%)
  • 15 points among independent (i.e. no party preference) voters (50% to 65%)
  • 12 points among college graduates (62% to 74%)
  • 12 points among those who earn under $40,000 a year (57% to 69%)
  • 11 points for those who earn $80,000 or more (55% to 66%)
  • 10 points among Latinos (72% to 82%)

Moreover, from January to December 2017 disapproval became the majority response among men (49% to 58%), those age 55 and older (49% to 57%), and those with some college education (50% to 58%).

Regional trends in presidential disapproval ratings also point to a challenging environment for Republicans running in House elections this year. Predictably, there is overwhelming disapproval of President Trump in the Democratic strongholds of Los Angeles (75%) and San Francisco (73%) in the December 2017 PPIC survey. More surprisingly, over the course of 2017 disapproval of Trump’s performance increased to majority levels in Orange/San Diego (50% to 58%) and the Inland Empire (39% to 55%), where several of the House seats that are now held by Republicans are located. Coincidentally, two Republican House members in Orange/San Diego decided not to run for reelection.

There are two bright spots for Republicans in the president’s approval ratings. First, President Trump has held a solid base of support among Republican likely voters, according to a comparison of the January 2017 PPIC survey (76% approve) and the December 2017 PPIC survey (78% approve). Second, his approval increased to a majority in the Central Valley according to a comparison of the January 2017 PPIC survey (40%) and the December 2017 PPIC survey (55%). Importantly, several of the House seats now held by Republicans are in the Central Valley.

Finally, in placing the 2018 midterm election in recent historical context, it is especially noteworthy that the level of disapproval of President Trump at the end of his first year in office is relatively high compared to the past two US presidents. The December 2009 PPIC survey found that a majority of California likely voters approved of President Barack Obama (54% approve, 40% disapprove) in the midst of the Great Recession. The December 2001 PPIC survey found that overwhelming majorities approved of President George W. Bush (78% approve, 20% disapprove) in the wake of the 9/11 terrorist attack.

In California, the combination of presidential disapproval ratings (63%) and voter registration trends (45% Democrat to 26% Republican) sets the stage for the Republicans’ efforts to hold on to House seats to maintain control of the US Congress. However, the wildcard in the 2018 California election is the size and composition of the voter turnout—and in the 2014 midterm election, turnout hit a record low.

The PPIC Statewide Survey will be closely monitoring President Trump’s approval ratings, as well as indicators of the voters who are motivated to cast ballots in what will be a consequential election for California and the nation.