PPIC Polling and the Immigration Debate

This post is excerpted from a presentation to the PPIC Board of Directors and guests on September 12, 2017, in Los Angeles.

One of the most important issues for Californians in the first year of the Trump administration is changing federal immigration policy. Immigrants are a significant presence in California, and even more so in Los Angeles County. Los Angeles, the state’s most populous county, is home to more than 10 million people, including more immigrants than any other California county. Twenty-seven percent of California’s population is foreign born—about twice the US percentage—while 35% of Los Angeles County population is foreign born. Moreover, about 2.6 million undocumented immigrants—about a quarter of the total number in the US—live in California. More than 800,000 of these undocumented immigrants live in Los Angeles. Major shifts in federal immigration policy that are under way thus have profound impacts on California and Los Angeles.

Since January, PPIC has been monitoring state and local responses to changing federal immigration policy through our public opinion polling. We have asked 11 questions about federal immigration policy in four monthly surveys, each involving 1,700 California adults, including more than 400 adults from Los Angeles County, interviewed by landline and cellphone in English or Spanish. The margin of error is +/-3% for California and +/-6% for Los Angeles. While the country is politically divided on immigration issues, we have found some bipartisan agreement in California. Here’s a sampling of our findings this year:

  • Undocumented immigrants living in the US: In our January PPIC Statewide Survey, 85% of Californians and 89% of Los Angeles residents agreed that undocumented immigrants who are living in the US should be allowed to stay legally. These results are consistent with earlier PPIC surveys. Moreover, solid majorities were in favor of state and local governments making their own policies and taking actions, separate from the federal government, to protect the legal rights of undocumented immigrants in California (65% California, 73% Los Angeles).
  • Border wall, travel ban on residents of six Muslim-majority nations: In our March PPIC survey, when asked about building a wall along the entire Mexico border, more than 7 in 10 were opposed (72% Californians, 76% Los Angeles). In the same survey, about 6 in 10 (58% California, 63% Los Angeles) opposed the president’s revised travel ban involving six Muslim countries.
  • Immigration enforcement and schools: In our April survey, 46% of Californians and 55% of Los Angeles residents said they are very concerned that increased federal immigration enforcement efforts will impact undocumented students and their families in their local public school districts. More than 6 in 10 (65% Californians, 73% Los Angeles) favored having their local public school district designated as a sanctuary safe zone in order to protect its undocumented students and their families from federal immigration enforcement efforts.
  • Worries about deportation, impact of enforcement on business and jobs: In our May PPIC survey, 30% of Californians and 34% of Los Angeles residents said they worry a lot that someone they know could be deported as a result of increased federal immigration enforcement. About half said that increased federal immigration enforcement will have a negative impact on businesses, jobs, and the economy in their part of California (49% California, 53% Los Angeles).
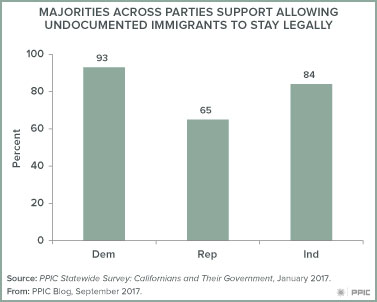
As the federal policy landscape shifted this year, PPIC Statewide Surveys continued to find majority support for a path to citizenship for undocumented immigrants who are living in the US: in our March survey, 68% of Californians and 71% of Los Angeles residents remained supportive. In contrast to the political divide in the rest of the nation, strong majorities across parties in California continue to agree that undocumented immigrants who are living in the US should be allowed to stay legally.

California’s path forward on immigration is a work in progress, as is the case in other areas that are undergoing federal and state policy changes. Moreover, there are uncertainties about federal actions such as the fate of the DACA program—which protects young undocumented immigrants brought to the US as children from deportation—the imposition of fiscal sanctions on sanctuary states and cities, the ban on travel from Muslim countries, and the construction of a wall along the US-Mexico border. As we have seen, California’s immigration policymaking is occurring in the context of strong public opposition to federal shifts, high levels of public concern about how these shifts are affecting undocumented immigrants and our regional economies, and strong support for actions by state and local governments to protect the legal rights of undocumented immigrants. At PPIC, we hope to foster conversations about immigration that lead to a better future for all Californians.

Learn more
Find out more about the PPIC Statewide Survey.

Video: Pessimism about Nation’s Direction

Californians have grown more pessimistic about the direction of the nation and the US economy since the beginning of the year, the May PPIC Statewide Survey shows. Underscoring that sentiment: just 27 percent of residents approve of the way President Trump is doing his job. Only 26 percent approve of Congress—a 10 point decline from March.

Researcher David Kordus presented these and other key findings at a survey briefing in Sacramento last week. On other federal issues, the survey found that most Californians disapprove of the House health care bill, and half expect negative effects from increased immigration enforcement.

Californians are feeling better about the state of their state by some measures: a solid majority favor Governor Brown’s budget plan, and fewer adults than in past years see the state budget situation as a big problem. But the state faces important challenges. Housing is one of them, with 59 percent of all adults saying affordability is a big problem in their part of the state. And solid majorities of Californians say the gap between rich and poor is getting larger. Majorities support state action to address these issues.

Learn more

Read the PPIC Statewide Survey: Californians and Their Government
Find out more about the PPIC Statewide Survey

California Farmers Face Labor Drought

This year’s rains brought a welcome respite to California’s farmers, who had grappled with surface water supply shortages for the previous four years. But now farmers are increasingly worried about the availability of another crucial element to their farms’ productivity―farm labor. The connection between farm labor and immigration patterns was among the topics covered in a recent conference at UC Davis.

California is the nation’s largest farm state and a world market leader. This impressive productivity relies largely on an immigrant farm labor force. According to a federal survey, 9 of 10 crop farm workers in California are foreign born, largely from Mexico. More than half of crop farmworkers (56%) are undocumented immigrants.

Contrary to popular belief, immigration from Mexico to California has declined over time. In the early 2000s, close to a third of the crop farm workers were “newcomers”―foreign-born workers whose first arrival to the United States occurred within the year of the survey. The share of newcomers has fallen drastically in the last several years, and was down to 1% in 2013–14.

These immigration trends bring up short- and long-term concerns about the farm labor supply. In the long run, farm employers will have to figure out how to deal with declining immigration. The more immediate worries surround undocumented workers currently in California and the potential effects of the Trump administration’s stepped-up enforcement of immigration laws.

According to UC Davis’ Philip Martin, farmers have been employing a “4-S” strategy―satisfy, stretch, substitute, and supplement―to deal with fewer newcomers in the farm labor force. Satisfying current workers includes providing bonuses, low-cost health care, and training farm labor supervisors to improve working conditions. Stretching current workers includes providing mechanical aids to make farmworkers more productive, while substituting means replacing workers with machines where possible―or switching to less labor-intensive crops (almonds, for instance). Finally, some growers have been supplementing their workforce by using the temporary guest worker visa program. Which combination of these four strategies is likely to prevail will depend on the effects of another upcoming change―an increase in the statewide minimum wage, which will incrementally rise from $10.50 to $15 an hour by 2022.

Experts at the conference agreed it is likely that the new federal administration will build on the Obama era efforts, when a record two million foreigners were deported over eight years. A panelist at the conference argued that mass deportations are highly unlikely, mainly due to capacity constraints in the federal agencies responsible for deportations. However, the effects of increased enforcement mechanisms (such as requiring all employers to check the legal status of new hires through the online E-verify system) and other factors might shrink California’s farm labor force supply 6–9% in the short term. These effects will not be due to undocumented immigrants leaving the US (“self-deporting”) but due to their “hunkering-down”―perhaps working less hours than usual or moving from farm to farm for seasonal work less than before, in an effort to reduce their chances of deportation.

Senator Dianne Feinstein has introduced a bill that aims to shield undocumented farmworkers from deportation by putting them on a pathway to legalization. The Agricultural Worker Program Act would also provide a path to legal permanent residency to some undocumented farmworkers in the US. But immigration reform is not an easy lift, and the bill’s fate is uncertain. In the meantime, farmers will have to hope the 4-S plan can keep the crops moving from farm to table.

Learn morERead “Undocumented Immigrants in California” (PPIC fact sheet, March 2017)
Read the report Water Stress and a Changing San Joaquin Valley (March 2017)
Read California’s Water: Water for Farms (from the California’s Water briefing kit, October 2016)

Video: Taking the Pulse of Californians’ Views of Schools

California public schools serve more than 6 million children, more than half of them economically disadvantaged and nearly a quarter of them English Learners. Achievement gaps across socioeconomic and demographic groups of students persist despite significant progress on state standardized tests in recent years.

The state has taken steps to address these challenges by changing its school finance system and its curriculum. Implementation of these reforms is proceeding against a backdrop of uncertainty at the federal level. The annual PPIC Statewide Survey: Californians and Education examined the views of state residents generally and public school parents, in particular, of this rapidly changing environment.

The survey finds that most Californians and public school parents alike give their local public schools a grade of A or B. At the same time, majorities in each group see the current level of state funding as inadequate. Most Californians say that the wiser use of existing funds is at least part of the formula to improve school quality. In this context, majorities of residents and public school parents favor providing parents with tax-funded vouchers to send their children to any school they choose.

Asked about the impact of stepped-up federal immigration enforcement, most residents and parents express concern about the effects of these efforts on undocumented students and their families. Majorities say they favor their local district declaring itself a “sanctuary safe zone” to indicate that it will protect its undocumented students and their families.

Learn more

Read the PPIC Statewide Survey: Californians and Education
Learn more about the PPIC Statewide Survey

Video: Californians’ Views of Trump and Key Proposals

Californians show their partisan colors when asked how they feel about the job performance of President Trump and a number of his proposals—building a wall on the Mexican border, reducing regulation of business, and banning travel to the US by people from six majority Muslim countries. The March PPIC Statewide Survey shows majority approval by Republicans and majority disapproval by Democrats of the president and these policies.

But there is one significant exception. As associate survey director Dean Bonner points out in a briefing on the survey, majorities of Democrats and Republicans say that undocumented immigrants living in the US should be able to stay legally rather than required to leave.

Learn more

Read the March PPIC Statewide Survey: Californians and Their Government
Learn more about the PPIC Statewide Survey

Video: An Early Look at Views of President Trump

The January PPIC Statewide Survey asked Californians for to assess their new leaders in Washington and found that just a third of Californians, or 30%, approve of the way President Trump is doing his job. Californians gave Congress a similar rating.

Dean Bonner, associate survey director, presented these and other key findings at a briefing in Sacramento. The survey also examined contentious issues that are the focus of national debate.

  • Solid majorities of Californians favor state action—independent of the federal government—to protect the rights of undocumented immigrants and to address global warming.
  • About half of Californians have favorable opinions of the Affordable Care Act, and a slight majority oppose repealing it.
  • Most Californians—across political parties—say the government should not interfere with a woman’s access to abortion.

The survey also looked at views of Governor Brown’s job performance and his proposed budget. The governor job approval rating is at a record-high 66%. But his budget proposal and his plan to fund maintenance of the state’s roads, highways, and bridges fares less well. Just under half of residents support his budget plan and 41 percent support his transportation proposal.

Learn more

Read the January PPIC Statewide Survey
Learn more about the PPIC Statewide Survey

Worlds Apart: California’s Partisan Divide and the 2016 Election

With the June 7 primary behind us, it’s time to reflect on what we have learned about California’s likely voters as we look ahead to the November 8 election.

The December 2015 PPIC Statewide Survey reported a profound schism between Republicans who wanted “new ideas and a different approach” and Democrats who favored “experience and a proven track record” in a presidential candidate. Last Tuesday’s election provided more evidence of these attitudes. Donald Trump, a businessman with no political experience, won the Republican primary while Hillary Clinton, with a long record of public service, won the Democratic primary. It is now obvious that Californians’ candidate preferences are just one example of a deep partisan fissure that has emerged in the 2016 PPIC Statewide Surveys.

We found another example of this divide when we asked about the mood of the California electorate in 2016. Most Republican likely voters (78%) said the state is going in the wrong direction while most Democratic likely voters (67%) said it is going in the right direction in our May PPIC Statewide Survey. We found a similar divide in views about the direction of the US and about whether California and the US are headed into good economic times or bad ones next year.

The job approval ratings of elected officeholders also largely depend on one’s partisan stripes. President Obama has an 84% approval rating among Democratic likely voters and an 85% disapproval rating among Republican likely voters. This party split is also clear in the approval ratings of the US Supreme Court, California US Senators Barbara Boxer and Dianne Feinstein, Governor Jerry Brown, the California Legislature, and even local House members and state legislators. The only area of consensus is the overwhelming disapproval of the US Congress (84% Republican, 81% Democrat).

There are also large and consistent partisan divides over the role of government. The vast majority of Republicans—83%— want a smaller government with fewer services, while a strong majority—69%—of Democrats say they prefer a bigger government with more services.

Similar partisan differences are evident when Californians are asked about gun laws, government regulation, and economic inequality. While 64% of Republicans say the government goes too far regulating guns, 79% of Democrats say it does not do enough. A majority of Republicans—66%—say government regulation does more harm than good, while 76% of Democrats say government regulation is necessary to protect the public. And 68% of Republicans say the government should not be doing more to reduce the gap between the rich and poor, while 79% of Democrats say it should be.

Last but not least is the partisan gulf on immigration and race. There are also different perspectives on the proposal to build a wall along the entire Mexico border (60% Republicans favor; 87% Democrats oppose) and whether immigrants are a burden (66% Republicans) or a benefit (78% Democrats) to California. Most Republican likely voters (58%) say there is equal treatment in the criminal justice system while most Democratic likely voters (80%) say that blacks and minorities do not get equal treatment.

Looking ahead to the November ballot, there are starkly different views on extending a temporary income tax on the wealthy, with 68% of Republicans opposing the extension of this Proposition 30 tax and 80% of Democrats in favor of it. The results are similar when our survey asked about a state school bond (50% Republicans no, 82% Democrats yes) and marijuana legalization (56% Republicans oppose, 69% Democrats favor).

How will California’s partisan divide impact the November election? Democrats now have an 18-point edge over Republicans in voter registration (45% to 27%).The PPIC Statewide Surveys this year also indicate that independent voters are leaning in the same direction as Democratic voters in their presidential, US Senate, and ballot choices, and their overall outlook, approval ratings, and policy preferences. In this context, the May PPIC Statewide Survey found that the state’s likely voters favor the presidential candidate who stands for experience and a proven track record over the presidential candidate who stands for new ideas and a different approach. Still, Republicans overwhelmingly support their party’s standard bearer and appear to be aligned with his perspectives and policies.

California seems poised to maintain its blue status this fall. However, the geo-political segregation of the state —with Republican pockets of strength in California’s northern, inland, and rural regions—means that federal and state legislators will be elected to represent the views of voters who are worlds apart. Indeed, the political polarization and antipathy of this year’s election may result in a California Congressional delegation that will contribute to Washington gridlock and a California Legislature that will struggle to find common ground on solutions to the many challenges facing California’s future.

Video: Survey Looks at Candidates & Issues

The most recent PPIC Statewide Survey found a tightening primary race between Democratic presidential candidates Hillary Clinton and Bernie Sanders, and strong majority support for Donald Trump among Republican primary likely voters.

Dean Bonner, associate survey director, presented the findings at a Sacramento briefing last week. In addition to examining views of presidential candidates, the survey asked California likely voters for their choices in the election for US Senate—and it looked ahead at potential matchups for November in both races.

The survey offers a snapshot of Californians’ views on two key topics being widely debated nationally:

  • Immigration policy. A strong majority of likely voters oppose building a wall along the entire border with Mexico, as Trump has promised to do. There is a stark partisan divide: 86% of Democrats and 72% of independents oppose building a wall, while 59% of Republicans favor it. Asked whether or not undocumented immigrants living in the United States should be allowed to stay legally, 75% of likely voters favor allowing them to stay. Majorities across partisan lines say undocumented immigrants should be allowed to stay.
  • US Supreme Court. At a time when the court has issued rulings on a number of polarizing topics, California likely voters are divided in how they rate the court: 46% approve of the way the court is handling its job and 44% disapprove. Should the Senate should confirm Obama’s nominee, Merrick Garland, to the court? About half of likely voters (51%) say yes, and 33% say no.
Learn more

Read the May 2016 PPIC Statewide Survey: Californians and Their Government
Visit the PPIC Statewide Survey pages

Testimony: California’s Exclusive Electorate & the 2016 Election

Mark Baldassare, PPIC president and CEO, testified before the Assembly Select Committee on Civic Engagement in Los Angeles today (May 13, 2016). Here are his prepared remarks.


“If the trends in voting continue, we face the prospect of an electorate making policy choices that neglect the realities and problems facing large segments of California society.” I wrote these words in a 2006 PPIC report, California’s Exclusive Electorate. The report analyzed trends in the state’s electorate from 1990 through May 2006 and polling results from the PPIC Statewide Surveys from 2005 to 2006. It revealed the gulf in political preferences between the state’s voters and the majority of its adult population, and suggested that if California’s nonvoting adult population made their voices heard at the ballot box, the political status quo could change—dramatically. In other words, the choices that voters make do not necessarily represent the preferences—or the needs—of California’s broader population. These disparities could be a problem for any state and are not unique to California.1 However, for California, a state that calls on its voters not only to elect representatives but also to make so much policy through ballot initiatives, these disparities raise real concerns.

In the years since that report, voter participation has continued to fall while the state’s population has become larger and more diverse. This troubling trend, especially notable in primaries and midterm elections, has motivated a statewide conversation about advancing civic engagement and increasing voter participation in California. Compounding this concern is our finding that California’s likely voters—who decide the fate of candidates and ballot initiatives—do not represent the demographics or the policy preferences of the state’s adult population.

At a time when new approaches to boosting voter turnout are being implemented and proposed, and as we approach the 2016 presidential election, it seemed important to update our work on the electorate. Using PPIC Statewide Survey data from 2015—drawn from about 12,000 interviews during seven monthly surveys that included voting and nonvoting adult Californians—our 2016 PPIC report paints a comprehensive picture of likely voters and their nonvoting counterparts. Once again, we find that the people who go to the polls in California are very different from those who don’t; they have different demographic characteristics—such as age, education, homeownership, immigration, income, and race/ethnicity. They also have different political attitudes and policy preferences. As California’s population continues to expand and change, the voting rolls are not keeping pace, and the state’s voters remain unrepresentative of its population.

In our 2016 report, we found a strong connection between economic inequality and political inequality. Likely voters in California tend to be older, white, college educated, affluent, U.S. born, and homeowners. They tend to identify themselves as “haves”—rather than “have nots”—when asked to choose between these two economic categories. Nonvoters tend to be younger, Latino, renters, less affluent, less likely to be college educated, and not U.S. born—and they generally identify themselves as “have nots.” Voters and nonvoters differ noticeably in their views on the role of government, taxes and spending, ballot choices, and elected officials—all of which come into play during an election year and influence governing choices in the long term.

California’s recent steps to encourage voter participation are a step in the right direction, but the divide between voters and nonvoters is deep and persistent. Why has the exclusive electorate phenomenon that we identified 10 years ago been so difficult to change? State laws that make it easier to register to vote and cast ballots are helping to expand the electorate, but only to a limited degree. When eligible adults are asked why they are not registered to vote, most cite a lack of confidence or a lack of interest in elections, a lack of trust in government, and a lack of time to vote. When registered voters are asked why they do not always vote, their top reasons are a lack of interest and time and low levels of confidence and trust.2

More fundamentally, the broad demographic and economic shifts underway in the state are shaping the divide between California’s voters and nonvoters today. Immigration is one important factor. Millions of California adults are documented and undocumented noncitizens. The share of the adult population that is undocumented is on the decline, but it is still a large segment of California society. Public and private efforts are needed to encourage more noncitizens to become citizens and join the voter rolls. Comprehensive federal immigration reform that provides a path to citizenship is another key ingredient in creating a larger and more diverse electorate. Other powerful socioeconomic factors help determine political participation. A significant share of California’s population is living in poverty, housing costs in coastal regions are high, and the state economy is likely to face a shortage of college-educated workers in the near future. Efforts to increase economic opportunity through policies that produce high-paying jobs, provide affordable housing, and increase college graduation rates would also grow and diversify the electorate.3

How will these ongoing trends in political and economic inequality affect the 2016 election cycle? As is always the case, voter turnout will increase and demographic profiles will broaden for the November presidential election. Still, we expect to see a large divide between voters and nonvoters this year. Once again, California faces the prospect of an electorate making policy decisions that neglect the realities and problems facing large and growing segments of society.

What are the larger consequences of uneven participation rates and low voter turnout? First, the fact that a relatively small group of voters is making decisions about elected representatives and public policy raises serious questions about the legitimacy of the democratic system. Next, because the haves in society are the frequent voters, and so many of the have nots are not voting or are not registered to vote, our electoral process does not reflect the broad economic and political interests of all adults. Last, likely voters and nonvoters have different perspectives on the role of government, government spending, ballot choices, and the state’s elected officials.

What might happen if voters were more representative of California’s adult population? There could be more voter support for policies that increase spending for health care and education, and for an expansion of the government’s role in improving the lives of immigrants and the less economically advantaged. If large numbers of new voters continue to register with “no party preference” and the proportion of major party voters continues to shrink, the power of independent voters in determining election outcomes could be bolstered. Finally, growth and change in the electorate could initially produce more political instability, as elected officials, candidates, political parties, and initiative campaigns reach out to a larger and more diverse electorate.4

In the long run, having a larger and more engaged electorate that is more representative of the people of California would be a source of political stability for a state that increasingly relies on the ballot box to make its major policy decisions.

1. Raymond E. Wolfinger and Steven J. Rosenstone, Who Votes? (Yale University Press, 1980); Eric Plutzer, “Becoming a Habitual Voter: Inertia, Resources, and Growth in Young Adulthood,” American Political Science Review 96 (1): 41-56, 2002; Karthick Ramakrishnan, Democracy in Immigrant America, (Stanford University Press, 2005); Mark Baldassare, At Issue: Improving California’s Democracy (Public Policy Institute of California, October 2012); Jan E. Leighley and Jonathan Nagler. Who Votes Now? (Princeton University Press, 2014).
2. Mark Baldassare, Dean Bonner, David Kordus, and Lunna Lopes, “Voter Participation in California,” Just the Facts (Public Policy Institute of California, September 2015).
3. Laura Hill and Joseph Hayes, “Undocumented Immigrants,” Just the Facts (Public Policy Institute of California, June 2015); Sarah Bohn, Caroline Danielson, and Monica Bandy, “Poverty in California,” Just the Facts (Public Policy Institute of California, December 2015); Hans Johnson, Marisol Cuellar Mejia, and Sarah Bohn, Will California Run Out of College Graduates?, (Public Policy Institute of California, October 2015); Hans Johnson and Marisol Cuellar Mejia, California’s Future: Housing, (Public Policy Institute of California, February 2015).
4. Jack Citrin, Eric Schickler, and John Sides, “What If Everyone Voted?” American Journal of Political Science 47 (1) 75-90, 2003; Mark Baldassare, At Issue: Improving California’s Democracy, (Public Policy Institute of California, October 2012); Jan E. Leighley and Jonathan Nagler, Who Votes Now? (Princeton University Press, 2014).

Video: Survey Looks at Taxes and Pensions

As interest groups work to turn their ideas into initiatives for next year’s statewide ballot, the September PPIC Statewide Survey examined Californians’ views in two areas that may be put before voters in 2016: taxes and public employee pension reform.

Mark Baldassare, PPIC president and CEO, and Dean Bonner, associate survey director, presented the findings at a briefing in Sacramento last week.

Among the survey findings:

  • Half of likely voters favor extending the tax increases in Proposition 30 temporarily, but just a third favor making them permanent.
  • There is bipartisan support for raising taxes on cigarette purchases.
  • A majority of likely voters favor changing Proposition 13 to tax commercial properties according to their current market value.
  • Solid majorities of Californians see public pension spending as a problem, and most think voters should weigh in on changes to the system.
  • Most likely voters favor placing new public employees in a defined contribution system, similar to a 401(k) plan, rather than a defined benefits system.

The survey shows that Californians give their state leaders—the governor, legislature, and their own legislators—high approval ratings at the close of the legislative session. Baldassare offered his explanation at the briefing: there was little drama around the budget, the economy’s going well, and very few respondents in the survey mentioned fiscal issues as the most important ones.

Congress, on the other hand fares far less well in Californians’ eyes. Its 17% rating is not only much lower than the ratings likely voters give their state leaders, it is much lower than those of President Obama, Senators Barbara Boxer and Dianne Feinstein, and Californians’ own representative in the US House.

“Congress is a government institution that needs work, according to most Californians,” Baldassare said.