Housing Costs and Higher Education

Homeownership FigureOwning a home has long been part of the American dream. But with the state’s high housing costs, homeownership is difficult for many Californians to achieve. In a recent PPIC Statewide Survey, more than half of renters say the cost of housing is making them seriously consider moving away from the part of California they live in now, with most of those indicating that they are thinking of leaving the state.

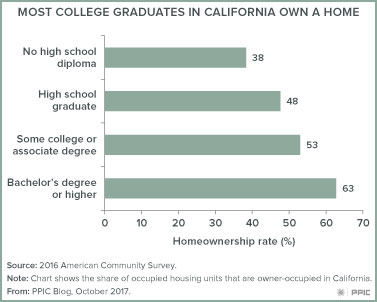
Homeownership rates are substantially lower in California than in the rest of the United States (54% vs. 63% in 2016, according to the American Community Survey). But one group in California fares relatively well with respect to homeownership: college graduates. Among heads of household with at least a bachelor’s degree, almost two-thirds own rather than rent, compared to less than half of high school graduates. The higher rates of homeownership among college graduates are a consequence of their economic success. As shown in other PPIC research, college graduates have much higher incomes and lower unemployment rates than other Californians, enabling many of them to purchase a home.  Owning a home, in turn, often leads to greater wealth. Indeed, the higher net worth of college graduates in California is strongly tied to homeownership.

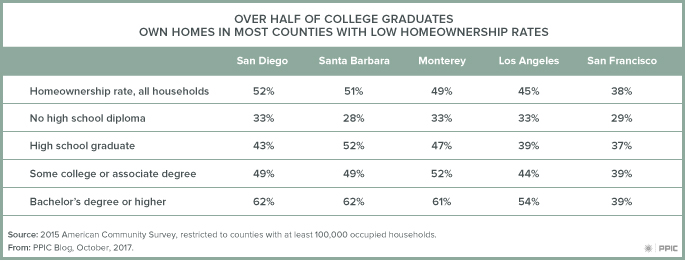
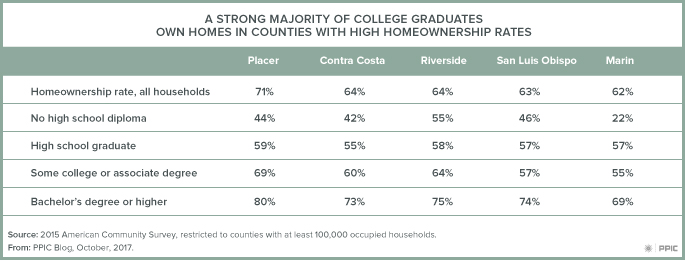
Of course, housing markets are regional, and the coastal areas of California are less affordable for everyone. The five counties with the lowest homeownership rates are all in coastal areas with high housing prices. But even in those counties—with the notable exception of San Francisco—over half of college graduates own a home. At the other extreme, counties with the highest homeownership rates are primarily suburban counties, including some with high housing costs. About 70% or more of college graduates in these areas own a home.


California policymakers have recently enacted a series of measures designed to increase the supply of housing, with a focus on affordable housing units. Certainly, the state’s housing crisis cannot be alleviated without building more housing. But while higher education is not often considered part of a housing agenda, it has played an important role in shielding many Californians from the state’s dramatic increases in housing costs. Because of the labor market advantages experienced by college graduates, many have been able to purchase a home, giving them more stability in their housing costs and allowing many of them to build wealth.

Commentary: California’s Forests are Dying—They Need Better Care

This commentary was published in the San Francisco Chronicle on October 14, 2017

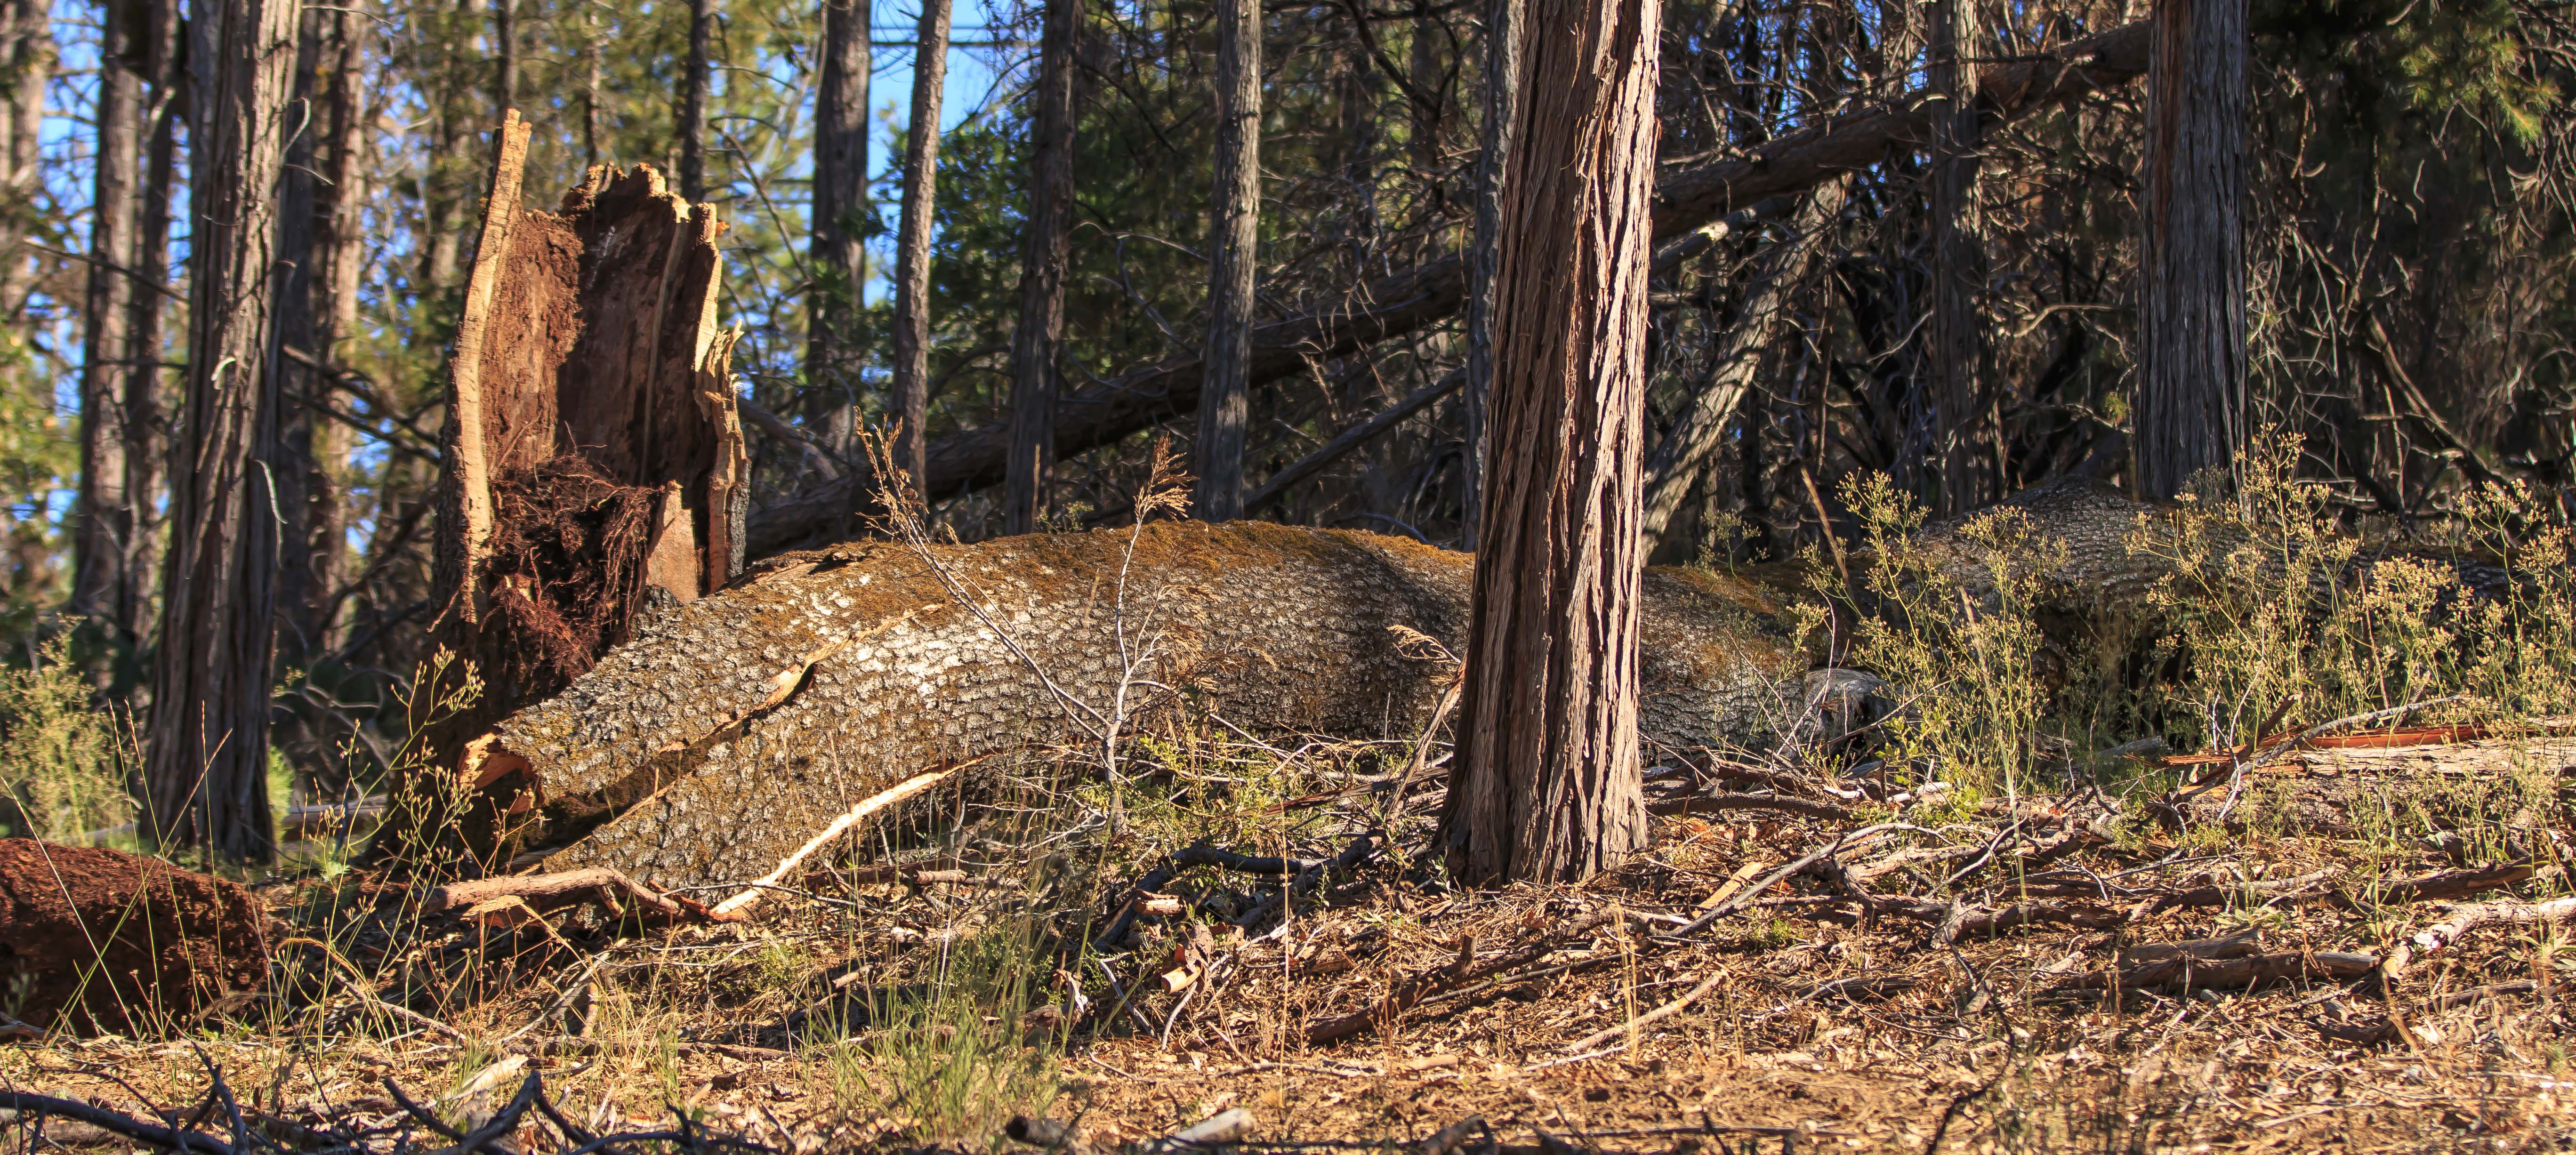
California’s forests are on fire, with tragic consequences for communities around the state. While the firestorm in the Wine Country has made international headlines, many small mountain communities also were aflame or on high alert.

The focus now is on saving lives and protecting property, but when the fires are out, the state will have to face up to a major problem: Our forests are too dense and dry, and, in some areas, dying. We need a new way to manage this vital natural resource.

Read the full commentary on sfchronicle.com.

Testimony: Cybersecurity Needs and Higher Education

Hans Johnson, director of the PPIC Higher Education Center and PPIC senior fellow, testified at the Joint Legislative Oversight Hearing on Cybersecurity Education and the Needs of the Workforce before the Assembly Committee on Higher Education in Sacramento today (October 10, 2017). Assemblymember Jose Medina chairs the Higher Education Committee and Assemblymember Jacqui Irwin chairs the Select Committee on Cybersecurity. Here are Johnson’s prepared remarks.

Thank you Chair Medina, Chair Irwin, and committee members.  My name is Hans Johnson, and I am the director of the Higher Education Center at the Public Policy Institute of California. My role today is to provide a brief overview of cybersecurity labor market needs in the state. First, I’ll define cybersecurity occupations, next I’ll provide data on labor market trends, and finally I will discuss educational awards related to cybersecurity. Sources of information and data used in this testimony include the United States Department of Labor, the California Employment Development Department, the United States Census Bureau, and reporting by California colleges and universities to the United States Department of Education.

As an occupation, cybersecurity is identified by the US Department of Labor as “information security analyst” and resides within a broader set of computer and mathematical occupations. In this testimony, I will focus on the information security (IS) analyst occupation. However, it is important to note that other computer and information technology occupations include individuals who work at least partly on security issues. According to the US Department of Labor: “Information security analysts plan and carry out security measures to protect an organization’s computer networks and systems. Their responsibilities are continually expanding as the number of cyber attacks increases.”

The IS analyst occupation is a high wage, high demand occupation. It is growing but still relatively small. Increasingly, employers are hiring workers with at least a bachelor’s degree to fill IS analyst jobs, but a notable share of jobs are still filled by workers with less than a four-year degree.  California colleges and universities have substantially increased the capacity of their institutions to award degrees in computer science and related fields. Even so, unemployment rates remain very low—an indication that employers could be having a hard time finding workers.

In California, EDD estimates the state was home to about 8,000 IS analysts in 2014, with that number projected to increase to 10,100 by 2024, a growth rate (26%) slower than other computer occupations (29%) but much faster than the state’s overall employment growth rate (15%). Still, it is important to note that IS analysts make up less than 1% of employment in computer occupations in California and less than 2% in the nation (see chart below). IS analysts work in a broad range of industries, including technology, banks, higher education, insurance, and health.

EDD estimates that IS analysts in California had a median wage of $53 per hour in the first quarter of 2017, which amounts to $110,000 on a full-time annual basis. Nationwide, the unemployment rate for IS analysts has been around 2% for several years now (based on my analysis of American Community Survey data from 2012 through 2015), with similarly low unemployment rates in California. Unemployment rates that low are a sign of high labor market demand.


Of critical concern for workers, and for these committees, are the education and training requirements for IS analysts. According to the U.S. Department of Labor:

Information security analysts usually need at least a bachelor’s degree in computer science, programming, or a related field. As information security continues to develop as a career field, many schools are responding with information security programs for prospective job seekers. These programs may become a common path for entry into the occupation. Currently, a well-rounded computer education is preferred.

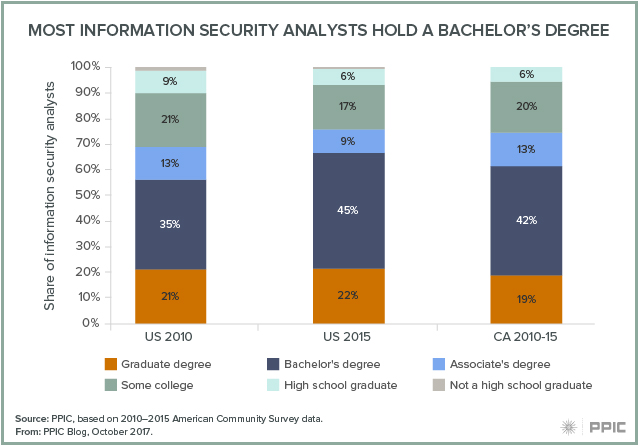
The number of IS analysts has increased nationwide in the last five years and so has their educational attainment. In the US, 67% of IS analysts had at least a bachelor’s degree in 2015 compared to 56% in 2010. In California, about two-thirds of analysts have at least a bachelor’s degree. The share of IS analysts in the US with an associate’s degree has declined from about 15% to less than 10%. The vast majority with a bachelor’s degree majored in one of three fields: computer science (including information systems), engineering (including electrical engineering and computer engineering), and business (including management information systems). In California, annual average earnings for IS analysts with a bachelor’s degree are about 70% higher than for those with some college or an associate’s degree, who in turn earn about 20% more than those with only a high school diploma. Unemployment rates are low for IS analysts, especially those who have some postsecondary education and those who have a bachelor’s or graduate degree.

California is home to dozens of colleges and universities that offer degrees in computer and information sciences. The state’s universities, especially the University of California, have quickly responded to the strong demand for these degrees (see chart below). The total number of bachelor’s degrees awarded increased from less than 3,000 in 2010 to 6,000 by 2016, with UC and CSU accounting for 65% of the total in 2016. The most common major is computer science, followed by computer and information science.


California’s community colleges also offer postsecondary training in computer and information sciences, ranging from short-term certificate programs to associate’s degrees. Importantly, they also provide lower division courses necessary for transfer to a four-year college or university. The total number of associate’s degrees in computer and information sciences and support services doubled between 2010 and 2016, from 719 to 1,490. The number of short-term certificates (completed in less than one academic year) increased from 1,605 in 2010 to 1,838 in 2016, and the number of longer-term certificates (completed in at least one but less than two academic years) increased from 225 to 321. In all, the number of postsecondary awards totaled more than 3,600 by 2016. PPIC is currently developing research that explores information technology awards at the community colleges and is working with the Employment Development Department and the Chancellor’s Office of the California Community Colleges to secure access to student and wage data.

In thinking through the roles of the different segments of higher education in California, it is important to keep in mind that the segments are designed to work as a system. The strong demand, both on the part of students and employers, in technology fields should be met by each institution and by the segments working together. For example, improving transfer from community colleges to UC and CSU in technology fields through better articulation—including Associate Degrees for Transfer—is necessary if students are going to fully realize the economic benefits of these fields. Moreover, cybersecurity occupations are but one part of a larger technology sector. Developing a larger industry-wide and cross-system approach to meeting demand is necessary. Innovations—such as locating some CSU bachelor’s degree programs at community college campuses—offer the promise of reaching more students, including those underrepresented at our four-year colleges. California can best serve the growing number of students who want to pursue technology jobs by taking advantage of the strengths of each segment of its public higher education system—and helping those segments work together to meet the economic need for these highly skilled workers.

Learn moreVisit the PPIC Higher Education Center

Reforming Remedial Education in Community College

Reforming developmental, or remedial, education is essential to improving student outcomes in community colleges. Why? Developmental education is supposed to help underprepared students, but currently it may be one of the largest impediments to success. As PPIC research has shown, 80 percent of incoming California community college students—and a disproportionate share of students of color—enroll in at least one developmental course, but relatively few successfully move on to complete a college-level course. The good news is that over the last few years, there has been a tremendous amount of support for reform.

Reforming Assessment and Placement
Assessment and placement reforms generally involve moving away from the traditional reliance on standardized tests and toward a more holistic measure of prior achievement such as high school course grades. Research finds that test-based assessment and placement policies assign many students into remediation unnecessarily. Indeed, students’ high school performance as measured by GPA and course grades—even when self-reported by students—is a much more accurate indication of student readiness. A recent report by the California Acceleration Project shows that the use of high school measures has dramatically broadened access to and completion of college-level math and English courses, significantly reduced equity gaps, and has had little impact on course success rates.

But implementation is key. Several decisions will determine the impact of new policies in increasing access to college-level courses and reducing unnecessary remediation: What GPA or course grades will qualify a student for access to college-level courses? If a college uses multiple measures, how will they be combined into a single placement decision? Will colleges accept students’ self-reports of their GPA and grades? Furthermore, as campuses expand access to college-level courses, it is critical that they provide supports to students who need to brush up on their math or English skills. Guidance provided by the Multiple Measures Assessment Project, the California Acceleration Project, and others will be central to helping colleges make these important decisions.

Reforming Developmental Courses
Changes to developmental coursework can also help more students progress to college-level courses.  Some colleges are transforming traditional developmental education into accelerated pathways that are relevant to students’ programs of study using the design principles of guided pathways introduced by Bailey, Jaggars, and Jenkins, which allow colleges to cluster hundreds of programs of study into a handful of broad areas (e.g., liberal arts, STEM, business, and health). For example, in math, there are statistics, quantitative reasoning, and STEM/precalculus pathways. In English, reforms often entail integrating reading and writing courses and contextualizing classes within broad fields of study. Additionally, colleges have shortened developmental pathways or offered concurrent support courses instead of requiring students to take prerequisites. This reduces the number of students who drop out because they fail to reenroll in long developmental course sequences, while providing just-in-time support to help students succeed in college-level work.

Across the state, PPIC has found that a growing number of developmental education reforms are underway—led by the California Acceleration Project and the Carnegie Foundation, among others. These initiatives are well positioned to implement reforms using the guided pathways framework. Emerging research suggests that providing accelerated math pathways that are more aligned with students’ programs of study helps improve early academic outcomes, including completion of college-level math. Less is known about the impact of developmental English reforms on student outcomes, but recent evidence on compressed and co-requisite English courses is encouraging.

Research and Policy Opportunities
Support for developmental education reform and guided pathways at community colleges has been spearheaded by the multimillion-dollar investments made through the Community College Chancellor’s Office, the governor’s annual budget, and legislative proposals, including AB 705 and SB 539. As colleges continue to adopt and scale placement and course reforms, it will be imperative to assess students’ perspectives and outcomes to determine if new policies improve student success and reduce equity gaps.

What Recent Hurricanes Mean for Flood Insurance in California

Three exceptional hurricanes—Harvey, Irma, and Maria— caused staggering damages from floods, winds, and storm surge in recent weeks. It’s likely they will make the record books as the most costly natural disasters in US history.

Although California doesn’t get hurricanes, it does get large storms (called “atmospheric rivers”) that can be just as damaging to people and property. Currently, one in five Californians and close to $600 billion worth of structures are vulnerable to flooding.

One way for residents and businesses to reduce the financial risks of flooding is to carry insurance. Millions of Californians depend on the National Flood Insurance Program (NFIP), managed by the Federal Emergency Management Agency (FEMA). But at almost 50 years old—and facing an uncertain reauthorization this December—it has many problems.

The most immediate concern is the imbalance between premiums and claims. Currently, the NFIP is more than $25 billion in debt―a figure that will certainly grow once all the recent hurricane claims are processed.

“The program never charged prices that would cover a year like Hurricane Katrina, where it paid out more than it had over the life of the program.  And the string of storms since then—Ike, Sandy, and now Harvey, Irma, and Maria—have only worsened its debt,” says Carolyn Kousky, director of policy research for the Wharton Risk Center and a member of the PPIC Water Policy Center research network.  “Realistically, the program will not be able to repay this debt, so the best thing may be for Congress to simply forgive it, while also putting in place a new approach to pay for catastrophic events.”

Another problem is that too many people at risk of flooding do not enroll in the program. In Houston, approximately 80% of Harvey-flooded homes were not insured.  And here in California, just 10% of flood-prone Sacramento county households and only half of those in high-risk areas have flood insurance.  Among the reasons so few people purchase insurance, Kousky says, are “unwillingness or inability to pay, a misunderstanding about the role of insurance, an unsubstantiated faith in disaster aid, and importantly, no information or even misinformation on flood risks.”

Inadequate perception of risk stems, in part, from the way FEMA maps flood hazards and mandates insurance. Currently, FEMA requires (but does not sufficiently enforce) flood insurance for homes with a 1-in-100 chance of flooding in any given year (the so-called 100-year flood). For homes in the floodplain but out of this high-risk zone, insurance is optional.

Nicholas Pinter—the associate director of the UC Davis Center for Watershed Sciences and a member of the PPIC Water Policy Center research network―notes that this gives a false impression that those outside this zone are safer than those within it. His laboratory found that roughly half the flooding from Harvey was outside of Houston’s 100-year floodplain zone.

“The picture in California is much better than in Texas,” Pinter says. “But updating flood maps here still takes many years, and California still largely works within FEMA’s framework of the ‘all or nothing’ 100-year floodplain.”

But the state may not be getting a good deal from the NFIP.  According to Pinter, California pays much more into the program than it is getting back.  He notes that California has gotten just 14 cents in return for every dollar of premiums paid.  The Central Valley—the most flood vulnerable area of the state—got just 9 cents per dollar.

“For a variety of reasons, California may be overpaying for its actual flood risk,” Pinter suggests. “The state needs to explore whether it is cheaper to develop its own flood insurance program and to invest the savings—estimated to be at least $150 million per year—in reducing flood risk across California.”

With this year’s unprecedented string of flood disasters and uncertainty for national insurance, it’s time for real policy reforms to ensure Californians are prepared to weather the growing risk of floods. Fixing our flood insurance problems is one way to start.

Learn more
Read Floods in California (PPIC fact sheet, September 2017)
Watch our 3-minute video “Floods”
Read Financing Flood Losses by Carolyn Kousky (February 2017), and her related blog post, “Flooding and the Economics of Risk Reduction” (August 30, 2017)

Video: How Californians View National Issues

With the nation focused on a range of contentious issues, the September PPIC Statewide Survey provides a California perspective. Dean Bonner, associate survey director, shared the key findings at a Sacramento briefing last week.

Among them:

  • A record-high share of Californians have a favorable opinion of the Affordable Care Act, and most want Republicans to work with Democrats to improve the law. While most Californians say it is the federal government’s responsibility to make sure that all Americans have health coverage, just a third favor a single-payer, government-run national health insurance system.
  • Three-fourths of Californians—also a PPIC record high—view immigrants as a benefit rather than a burden. There is broad and bipartisan support for protections provided by DACA, which shields from deportation some undocumented immigrants brought to the US as children and allows them to get a work permit if they pass a background check.
  • Half of Californians say they are very concerned about the possibility of North Korea having a nuclear missile that could reach the state.
  • Two-thirds of Californians view possible Russian interference in the 2016 as a serious issue.
  • Half of Californians say race relations have gotten worse in the United States over the last year. They are less pessimistic when it comes to race relations in the state.

Sentence Enhancements: Next Target of Corrections Reform?

Senate Bill 180, which has passed through the legislature and is currently on the governor’s desk, aims to change a sentence enhancement related to dealing drugs. The bill would repeal the three-year enhancement for a prior conviction related to drug sales, except in cases where a minor is used in the crime. The repeal would affect just 2.3% of the people who entered prison between October 2015 and September 2016. In light of the state’s efforts to downsize its prison and jail populations, however, the bill’s passage could create momentum for similar reforms.

California’s best-known sentence enhancement mechanism is the Three Strikes Law, passed in 1994. The law doubles the sentence of any offender convicted of a second serious or violent crime. A third conviction results in a sentence of between 25 years to life. There are roughly 38,000 second and third “strikers” in California prisons, a little more than one-third of the prison population.

Overall, California has more than 100 separate code sections that enhance sentences based on the current offense or the offender’s record. For example, using a firearm while committing a violent and/or sexual felony adds anywhere from 10 to 25 years. A gang-related felony results in 2 to 10 additional years, depending upon the seriousness of the offense.

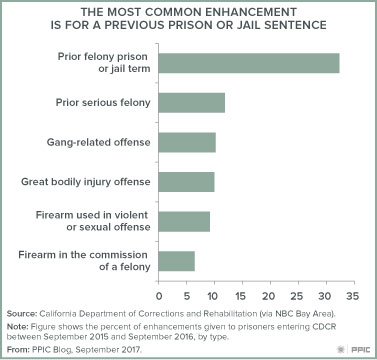
Figure jail sentence enhancementAs of September 2016, 79.9% of prisoners in institutions operated by the California Department of Corrections and Rehabilitation (CDCR) had some kind of sentence enhancement; 25.5% had three or more. Aside from second and third strikes, the most common enhancement adds one year for each previous prison or jail term.

Research on sentence lengths offers little support for the idea that the threat of longer sentences deters people from committing crimes. Physically removing a person from society does prevent him or her from engaging in criminal activity, which is part of the appeal of enhancements. However, research shows that this “incapacitation effect” varies across different types of offenders and that longer prison stays are wasteful when applied to people who are “low frequency” offenders.

When considering this bill and similar proposals, the state has the difficult task of balancing the costs of keeping people in custody— in terms of tax dollars spent on expensive prison beds as well as collateral costs borne by families and communities—against the potential cost to public safety.

Video: Improving the Health of California’s Headwater Forests

Forests in the Sierra Nevada benefit all Californians―they provide timber, wildlife habitat, recreational landscapes, two-thirds of the state’s surface water, and other benefits. But their health is in decline from drought, insect infestation, changes in management practices, and overcrowding. These changes have raised the risk of catastrophic wildfire and tree die-off. Improving forest health will require thinning trees, which will make forests more resilient.

These were some of the observations from experts gathered in Sacramento to discuss a new PPIC report on improving forest management.

Van Butsic―an assistant cooperative extension specialist from the University of California, Berkeley, and a coauthor of the  report—gave an overview of the crisis in forest health and solutions to it. A panel discussion followed, moderated by the PPIC Water Policy Center’s Jeffrey Mount. The panelists were David Edelson, Sierra Nevada project director at the Nature Conservancy; Barnie Gyant, deputy regional forester for resources for the Pacific Southwest Region of the US Forest Service; and Susie Kocher, natural resources advisor for the Central Sierra Region at the University of California Cooperative Extension.

“We looked at prescribed fire, managed wildfire, and mechanical thinning, and we realized these three treatments were actually effective,” said Butsic. “But they’re hard to use in California because of a complex management environment.”

Some essential takeaways from the event included:

  • About two-thirds of the land in California’s headwaters is federally owned, making the federal government a key player in solving this crisis.
  • Policy and budgets prioritize fire suppression over forest management. More than half of the US Forest Service budget is for fire suppression.
  • Revenue-generating logging on forest management projects can make these projects financially viable.
  • Treatments to thin forests can negatively affect species and habitat—but catastrophic wildfire is even more harmful.
  • Climate change makes solving the crisis in our forests challenging but not impossible.

Jeff Mount wrapped up the event by noting that the forest health crisis presents an “exceptional opportunity” to stakeholders and decision makers. “We’re seeing an awakening and awareness at a level we’ve never experienced,” he said. “It’s an extraordinary moment that is not to be wasted.”

Learn more
Read Improving the Health of California’s Headwater Forests (PPIC, September 2017)
Read California’s Water: Protecting Headwaters (from the California’s Water briefing kit, October 2016)
Visit the PPIC Water Policy Center’s drought resource page

Crime Rates Stable Overall, But Some Counties See Big Changes

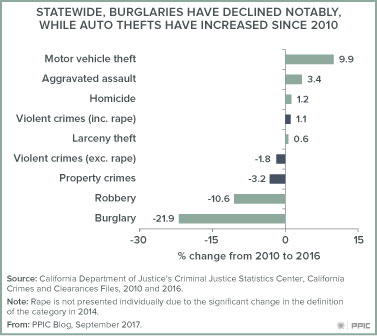
In 2011, California embarked on a series of criminal justice reforms, decreasing the state’s reliance on costly incarceration—and raising fears about the impact on public safety. A look at recently released crime numbers from the California Department of Justice show that while auto thefts are up almost 10%, the state has not seen a broad surge in crime since the reforms started. The violent crime rate is up 1.1% (and when adjusted for an important definitional change, is in fact down about 1%), while the property crime rate is down 3.2%. However, these statewide numbers mask substantial differences across counties.

Prompted by a federal court mandate to reduce the population of the state’s overcrowded prisons, California enacted public safety realignment in 2011. This historic reform shifted the management of lower-level felons from state prison and parole systems to county jail and probation systems. Since then—with the state still unable to meet the federal mandate—voters have passed three significant initiatives: Proposition 36 in 2012, Proposition 47 in 2014, and Proposition 57 in 2016. Due to the combined impact of these reforms, the state’s incarceration rate has declined dramatically and is now at a level not seen since the early 1990s.

While reforms were unquestionably needed—the state faced a possible federal order to release more than 30,000 prisoners early—critics have voiced concerns that public safety may be negatively affected and have asked whether less incarceration would reverse California’s long-term decline in crime rates.
Have reforms affected crime in California? A comparison of 2016 crime rates to those of 2010, the year before any of these reforms were implemented, provides a useful starting point.

The 2016 violent crime rate of 444 per 100,000 residents is up somewhat (1.1%) from the 2010 rate of 439 per 100,000 residents. However, the FBI implemented a change in 2014 that expanded the definition of sexual crimes that constitute rape. According to the FBI’s Uniform Crime Report, the new definition added about 38% to the number of reported rapes in 2014 in California, increasing the violent crime rate by about 8 more violent crimes per 100,000 residents. If we adjust the 2016 violent crime rate accordingly, from 444 to 436 per 100,000 residents, we find that this more comparable measure indicates a slight drop in violent crime (of about 1%) between 2010 and 2016.

The property crime rate in 2016 of 2,545 per 100,000 residents is down 3.2% from 2010 and is the second lowest rate observed since 1960 (the lowest was 2,459 per 100,000 residents in 2014). While the rate of auto theft is up 9.9%, burglaries have been decreasing noticeably since 2012 and are now down 21.9% from 2010. Larceny theft has changed very little (up less than 1%).

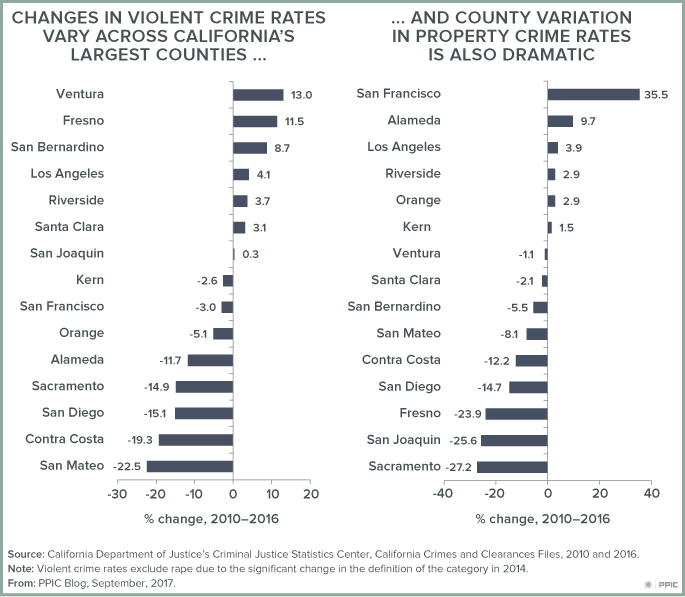
The picture is more complicated at the county level. A look at the 15 largest California counties shows that five saw double-digit drops in their violent crime rates between 2010 and 2016: San Mateo, Contra Costa, San Diego, Sacramento, and Alameda. But Ventura and Fresno Counties experienced increases of more than 10%. And while the property crime rate dropped more than 20% in three counties—Sacramento, San Joaquin, and Fresno—it went up a staggering 35.5% in San Francisco. Alameda County saw an increase of almost 10%.

How can we explain these differences? Before rushing to conclusions, there are several questions that need to be answered first. How have reforms affected factors such as arrests and incarceration? Do these differ across counties and what is their relationship to crime rates? Also, California’s crime trends may be affected by factors unrelated to recent reforms. How do statewide trends compare to what other states are seeing? Finally, have California’s reforms improved outcomes for those released from our jails and prisons? If so, this could help lower crime rates in the coming years. Our goal at PPIC is to address these important questions in our upcoming research.
Storing Water for Dry Days

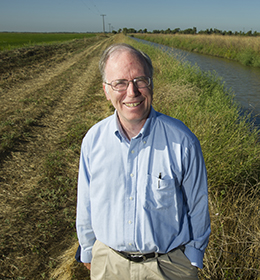
Where would California be without the ability to store water? We talked to Jay Lund―an adjunct fellow at the PPIC Water Policy Center and director of the Center for Watershed Sciences at UC Davis—about the often contentious and always complex topic of water storage.

Jay LundPPIC: What should every Californian know about storing water?

Jay Lund: Thanks to our Mediterranean climate, California has a very long dry season, which is when we use most of our water, and a fairly short wet season, when we try to gather and store water. To put water storage in perspective, California every year has a worse drought–in the form of a long dry season—than most of the country has ever seen. California has always relied on water storage, and in droughts today we rely on it even more. Almost all the water people use in summer has been stored someplace—either in a reservoir or groundwater. The state’s natural storage system of groundwater and snowpack is now augmented with reservoirs, pipelines, and groundwater pumping. This storage and conveyance system has been critical to California’s prosperity, particularly to its agricultural economy.

You often hear calls for more storage, and of course we do have some limitations in water storage capacity. But no matter how large a reservoir you build, you’ll never be able to reliably get more water out than that stream’s average flow into it. In much of the state the problem is that there’s not enough water available to store or that we can’t get water to the places where it’s needed most. The bottlenecks are often inadequate conveyance rather than storage.

PPIC: What did we learn about water storage from the recent drought and subsequent record-breaking wet winter?

JL: The drought highlighted the importance of groundwater storage. Surface storage in reservoirs is very important in the first couple years of a drought, but with longer droughts we rely more and more on groundwater storage. Groundwater will always be our primary storage for long droughts. California has 400–500 million acre-feet in groundwater storage, compared to about 42 million acre-feet in total surface reservoir capacity. Water quality is a bigger challenge with groundwater than with surface water, since pollutants can be washed into aquifers and accumulate there.

California’s geography is fortunate—we have huge aquifers under the Central Valley. Farmers made up for about 70% of reduced water supply during the drought by pumping groundwater. The longer the drought, the more important groundwater becomes. If we don’t manage to recharge enough water during wet years, there won’t be enough in drought years.

The wet year brought us the Oroville Dam spillway crisis. All of the dam’s outlet structures were compromised or broken for much of the winter. It was a good reminder that we have to maintain these structures and systems, and find funding for maintenance and independent inspections. Good inspectors will always find some concerns and problems, but few problems rise to the level of crisis. With California’s extensive water infrastructure system, if you’re not finding any problems you’re not looking hard enough.

PPIC: What will it take to made good use of groundwater recharge and storage?

JL: You need three things to recharge groundwater: porous land above an aquifer, enough water available above that land, and enough empty space under that land to store it. While local conditions are important, the big limitation for the areas of California experiencing groundwater problems is lack of surface water available for recharge. During this wet winter, people were trying to recharge as much as possible and being very creative about it. But this was a record wet year. We often lack enough water to get good recharge.

To improve recharge locally, we need a better accounting system to improve incentives. We also need more legal protections for local agencies that want to do recharge, and faster authorizations to recharge in wetter years.

Learn moreRead Dams in California (PPIC fact sheet, September 2017).
Read California’s Water: Storing Water (from the California’s Water briefing kit, October 2016).
Read “Expanding Water Storage Capacity in California” (California Water Blog, February 22, 2012).
Visit the PPIC Water Policy Center.