How Community College Reforms Could Help English Learners

[vc_row][vc_column][vc_column_text]Due in large part to their mission of access and affordability, community colleges play a key role in educating immigrant students, especially those who are English Learners. In 2016–17, more than 58,000 first-time community college students in California enrolled in English as a Second Language (ESL) courses.

For many students, taking ESL courses may be linked to the desire to improve their socioeconomic prospects. Indeed, community college students who earn a credential or transfer to get a four-year degree are well positioned to climb the economic ladder. In an economy that increasingly demands skilled workers, there is tremendous untapped potential in increasing the educational attainment—and economic trajectories—of ESL students.

California’s community colleges have undertaken several reforms that aim to improve student success and close equity gaps. These reforms—spurred by AB 705 and the new Guided Pathways framework—present a ripe opportunity to help more ESL students get on the path to completing college composition, a requirement to earn a college credential or transfer.

These initiatives are primarily focused on addressing the needs of students who intend to pursue a degree or transfer. However, our most recent research finds that about two-thirds of ESL students (66%) are not on track to do so—and may consequently be left out of the reforms. (We consider students on track if they take any ESL course required to access college composition and at least one course other than ESL or English.)

ESL students who are not on track are more likely to come from historically underrepresented groups. For instance, we find that compared to students taking ESL courses needed for college composition, those not taking these courses are more likely to be older and Latino. They are also more likely to have unknown citizenship status (a possible signal of being undocumented) and to have not graduated high school.
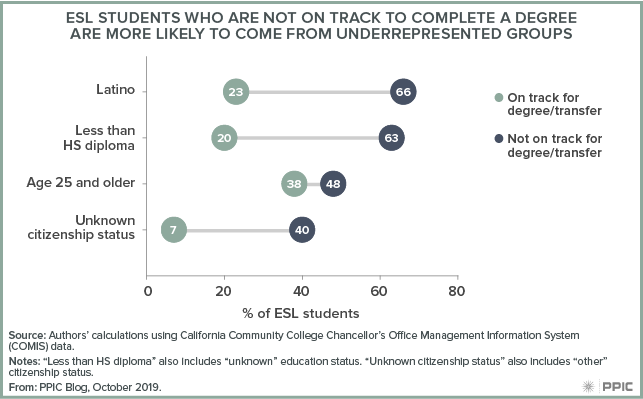
figure - ESL Students Who Are Not on Track To Complete a Degree Are More Likely To Come from Underrepresented Groups

As colleges across the state reform their ESL sequences and programs of study, it will be critical to ensure that all students have the opportunity to earn a degree or transfer. The two-thirds of ESL students currently not on track to do so are the most vulnerable. These students have already taken the major step of enrolling in college. To improve their likelihood of advancing, colleges could provide clearer and more effective ESL sequences and degree and transfer pathways, as well as stronger student supports, including advising, placement, and information about available degrees and certificates.

Some colleges are already working on these issues. Initiatives like the Guided Pathways ESL Milestone certificates at Cypress College—the result of AB 705 and Guided Pathways efforts—present a unique example of how colleges can structure ESL programs and certificates to help English Learners get on a pathway toward a college credential.

Finally, it is important to acknowledge that there are some ESL students who take ESL coursework for reasons unrelated to a degree. As colleges redesign their ESL programs, working alongside non-credit ESL programs, adult education schools, and community-based ESL programs could help ensure that colleges are keeping the diverse needs of ESL students in mind.[/vc_column_text][/vc_column][/vc_row]

Video: Key Factors in Arrest Trends and Differences in California’s Counties

Police officers make more than a million arrests per year in California. Arrests to enforce laws and protect public safety can have wide-ranging consequences for individuals and communities, and there have long been concerns about racial disparities. But little is known about the factors that contribute to arrest trends across the state. At a recent event in Sacramento, PPIC researcher Brandon Martin outlined major findings from a new report on arrests, and a panel of experts offered state and local perspectives.

Martin pointed out that arrest rates have fallen significantly over the past few decades, largely in tandem with declining crime rates. He also noted that arrest rates are higher in relatively poor counties, while racial disparities are largest in more affluent counties. These and other findings add up to a broad view of arrests that can inform efforts to reduce overall rates and racial disparities.

Shirley Weber, who represents California’s 79th Assembly District, said that the racial disparity findings are not new to the African American community. She noted that African Americans who commit offenses are “more likely to be arrested and incarcerated . . . rather than just being picked up and talked to,” and that confrontations that lead to uses of force are also more likely. These disparities have significant effects on employment and family stability, among other things.

Edgar Boyd, pastor of First African Methodist Episcopal Church in Los Angeles, emphasized the need for police and communities to reduce disparities: “When you look at . . . the conflict that exists between communities and law enforcement across the state, you’ll find that there’s a possibility of less negative impact, if it’s worked on.” Tod Sockman, chief of police for the city of Galt, agreed: “Law enforcement spends a lot of time doing community outreach. I think that’s key to everything we’re doing.”

The panelists also agreed that while local efforts are critical, the state has an important role to play in monitoring disparities. Weber—who championed Assembly Bill (AB) 392, a measure that sets statewide standards for police use of force—said that it would be irresponsible for state lawmakers to view criminal justice challenges as local matters. After AB 392 passed, a number of police officers told her that they were pleased because “they had ideas of working to de-escalate . . . and now this bill says we gotta do it, and so they can blame it on me. And that’s OK! Because sometimes there are things at the local level that prevent you from moving in a direction.”

Recent criminal justice reforms have led to further reductions in arrest rates, seemingly without a major impact on public safety. But there is still room for improvement. Sockman pointed to increases in theft and the continuing challenge of addressing addiction and mental illness, and Weber noted the difficulty of changing course after decades of reliance on incarceration.

Boyd, who serves on the state’s Racial and Identity Profiling Advisory Board, made the case for ongoing dialogue: “Our work on this, our dialogue together . . . is all important. Every one of us has a role and a responsibility in that.”

Californians and the 2020 Election

This post is excerpted from my opening remarks at PPIC’s annual Sutton Family Speaker Series event, “2020 Election Preview“ earlier today, in Sacramento.

All eyes will be on California when voters make their choices in the upcoming presidential primary on March 3. Last year, California experienced a surge in voter registration and voting. On the heels of record low turnout in 2014, the 2018 election had the highest turnout for a midterm in California since 1982. Still, PPIC colleagues report that turnout is low compared to other states.

To help make sense of the state’s voting patterns, PPIC has just released a new report titled California’s Exclusive Electorate: A New Look at Who Votes and Why It Matters, which analyzes data from the last nine waves of PPIC Statewide Surveys and includes responses from nearly 15,200 California adults. These latest findings, built on a PPIC study that was first published in 2006 and then updated in 2016, help us to set the context for this 2020 election preview event. While much is changing in the electorate, many patterns stubbornly persist.

Growth in political participation has been strong in the wake of significant changes in our state’s election laws and because we live in such interesting times for national politics. However, it is noteworthy that about 5 million California adults are not eligible to vote, while about 5 million eligible adults are not registered and about 7 million registered voters did not cast a ballot in November 2018. If past trends are any indication, only about half of California’s approximately 31 million adults will vote in the November 2020 general election, and far fewer will cast ballots in the March 2020 primary.

Importantly, the demographic makeup of the electorate is not representative of the people of California. Voters in California tend to be white, affluent, college educated, and homeowners. Nonvoters are more likely to be younger, Latino, renters, lower income, less educated, and to self-identify as the “have nots” in society. While some gaps have narrowed, a wide gulf remains between voters and nonvoters.

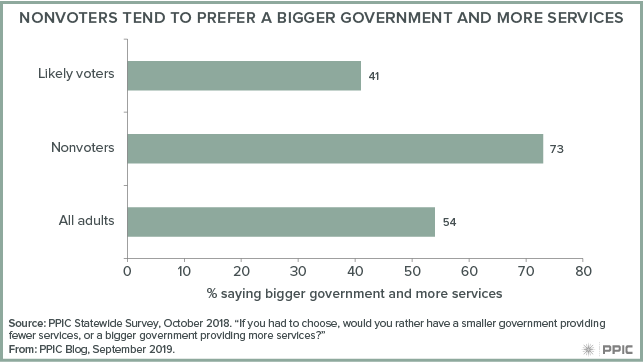
Because of their stark differences, voters and nonvoters are not aligned in their views of the role of government. For instance, only 41 percent of likely voters prefer a bigger government that provides more services, while 73 percent of nonvoters and 54 percent of all adults do so. Preferences vary in similar ways when asked if the government should be doing more to reduce the gap between the rich and the poor, or if the government should do more to make sure that all people have an equal opportunity to get ahead.

figure - Nonvoters Tend To Prefer a Bigger Government and More Services

What would change if more nonvoters turn out for the March primary and November election? Presidential candidates who favor a more expansive government role would get a boost, and so would proponents of state bond measures and citizens’ initiatives to raise taxes on the wealthy. President Trump’s approval rating here is much lower among nonvoters than likely voters (24% to 38%) and, thus, a higher turnout would also help the Democratic candidates in competitive US House races—as it did in 2018.

Expanding the electorate might also inject some idealism into the cynicism and divisiveness of politics today. Nonvoters are more optimistic about the prospect that Americans of different political views can still come together and work out their differences. California still has a long way to go, but the movement toward a more representative electorate that we are starting to see is a step in the right direction for a state that calls on voters to make decisions that impact all of its residents.

In the meantime, PPIC Statewide Surveys will continue to poll all adults so that elected officials can take into account the needs and wants of all of the people they were elected to represent, and not only the likely voters, in a consequential 2020 election year.

Video: School Resources and the Local Control Funding Formula

The Local Control Funding Formula (LCFF) was enacted in 2013-14 with three major goals: to simplify California’s K–12 school finance system, increase local control over spending, and provide additional funding to districts with large shares of high-need students—those who are low income, English Learners, homeless, and/or foster youth. At a lunchtime event in Sacramento last Thursday, PPIC researcher Julien Lafortune shared key findings from a new report that looks at increased spending under the LCFF. Then, a panel of experts offered state and local perspectives on the successes and challenges of directing funding to high-need students.

The PPIC report offers new statewide evidence on how school resources have been affected by LCFF; it also examines the extent to which these resources are reaching the highest-need students. It finds that LCFF funding is, for the most part, reaching the high-need students for whom it was intended. But the funding formula imperfectly targets high-need students in lower-need districts.

Kent Kern, superintendent of schools for the San Juan Unified School District, highlighted the challenges of serving high-need students in a district with wide disparities across schools. At 54.5%, his district’s share of high-need students is just below the LCFF’s “high need” funding threshold; however, 19 of its 64 schools have shares of high-need students that are 80% or above. “One of my schools that’s actually at the 99th percentile is a mile away from a school in another district. If we received the same funding as that district got, [our] school would be generating $1.4 million more.”

Not surprisingly, Kern would welcome a change to the LCFF that could benefit the high-need students in his district: “I think there would be some threshold that would allow schools with high-need concentrations to get more money.”

From a statewide perspective, however, the LCFF’s district-level approach is important. Michael Kirst, professor emeritus at Stanford and a key LCFF architect, emphasized the importance of providing additional funding to districts with the highest concentrations of need, to help them address particularly difficult educational challenges: “I would continue to support the theory of concentration, though I realize there are tradeoffs.” Samantha Tran, senior managing director at Children Now, pointed out that when the LCFF was being developed, many stakeholders were concerned that a school-level funding model could create perverse incentives: “If a border line could be drawn that allows for deeper concentration that draws down more state dollars . . . that is not the policy we want in place. We don’t want to perpetuate segregation.”

Asked what they would change about the LCFF, Kirst and Tran agreed on the need for more money as well as greater transparency on spending. Kirst noted that “it takes more than money” to retain teachers and improve student outcomes, but there are clear links between spending and achievement. And Tran said that while she has “no interest in bean counting,” the state needs a clearer understanding of trends in spending and outcomes.

From both the state and the local perspective, the LCFF has been successful in focusing attention on high-need students. As Tran put it, “We’re actually having a conversation about high-need schools . . . that’s a success.” One of the biggest challenges, from Kern’s perspective, is that people expect “too much change too fast. . . . I think we just need to stay the course.”


Video: Understanding Poverty in California

[vc_row][vc_column][vc_column_text]

Despite a booming economy, millions of Californians live in or near poverty. In this video, PPIC research associate Tess Thorman gives an overview of poverty and child poverty in the state, using the latest figures from the California Poverty Measure (CPM).

The CPM is a joint research effort by PPIC and the Stanford Center on Poverty and Inequality that provides a comprehensive look at economic well-being in our state. By accounting for cost of living differences across the state as well as earnings and other family resources—including safety net benefits—the CPM offers valuable insights into the ability of Californians to meet basic needs and be financially secure.[/vc_column_text][/vc_column][/vc_row][vc_row visibility=”hidden-phone”][vc_column][vc_video link=”https://youtu.be/tPh4xE7QLGo” el_width=”70″ align=”center”][/vc_column][/vc_row][vc_row visibility=”visible-phone”][vc_column][vc_video link=”https://youtu.be/tPh4xE7QLGo”][/vc_column][/vc_row][vc_row][vc_column][vc_column_text]To learn more about poverty in California, visit ppic.org/poverty.[/vc_column_text][/vc_column][/vc_row]
A New Look at College Enrollment Rates

California’s K–12 districts and schools are responsible for preparing students for college and career. But until recently, data has not been available to determine their success in actually getting students to apply to and attend college. Now, however, the California Department of Education has published data on college enrollment among recent high school graduates, using information from the National Student Clearinghouse. Initial findings show wide disparities in college enrollment across racial/ethnic groups and throughout the state’s regions—including within school districts themselves.

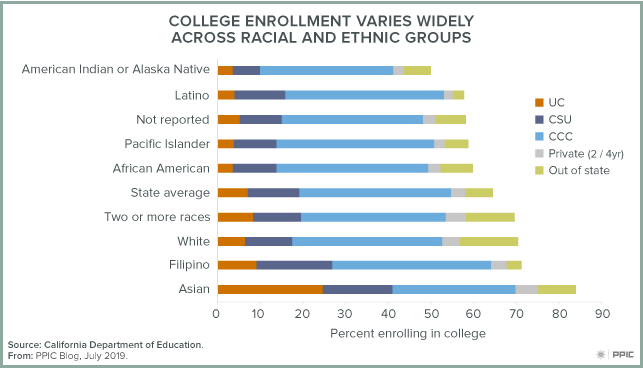
According to the data, about 65% of California’s high school graduates attended college within a year of graduation in 2017–2018 (the most recent data available). But there are wide differences. For instance, Latino students—the majority of K–12 students—have a relatively low rate of college enrollment (58%), while rates for Asian American students (84%) are quite high. Asian American students are also much more likely to attend a University of California campus than other students. African-American students have a similar enrollment pattern as Latino students, except many more opt to go to college in another state. White and multi-racial students also enroll in out-of-state colleges or universities at rates above the state average.

Figure - College Enrollment Varies Widely Across Racial and Ethnic Groups

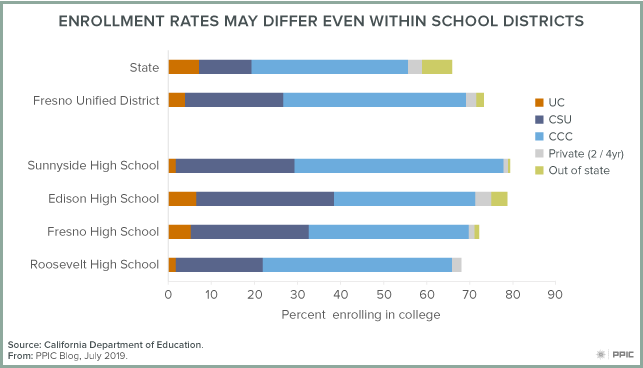
Differences by school, district, and region are also available in the data (you can check your local district’s college enrollment rates here). Fresno provides a good example. Fresno County has higher college enrollment rates than the state, but students are much less likely to attend a UC and much more likely to attend a CSU or community college—perhaps because of the strong presence of Fresno State and local community colleges, as well as the greater distance to most UC campuses.

Figure - Enrollment Rates May Differ Even Within School Districts

Among the many districts in Fresno County, students from Fresno Unified School District are relatively more likely than others to attend college. But there is plenty of variation within the district. Sunnyside High has very high enrollment rates; however, rates are lower than the district average for UC and much higher for community college. By contrast, Edison High has much higher than district average enrollment at UC, private, and out-of-state schools.

Enrolling in college or university is a goal for many high school students. But because the existing K–12 and higher education data systems are not linked in California, this is the first time in over a decade that the state has good information about whether high school students are meeting that goal. With the passage of SB75, California has begun the process of building a statewide longitudinal data system that will connect the existing student data systems between K–12 and higher education. The new enrollment data provide the first glimpse of the promise of a connected education data system. Linking data across segments could yield useful new information—such as whether students were successful in their college courses—which would fit nicely in the state’s dashboard on college readiness.

Motivating Californians to Fill Out the 2020 Census

The 2020 Census will determine the distribution of billions of dollars in federal funds and the accuracy of political representation at the local, state, and federal levels. Emphasizing the benefits to local communities is likely the best way to encourage participation and counteract the concerns many Californians have about confidentiality.

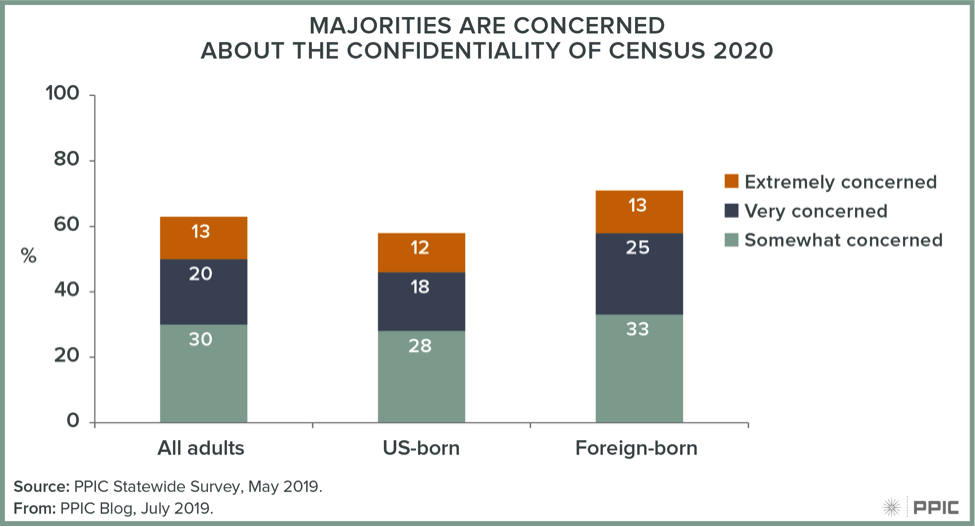
The latest PPIC Statewide Survey shows that 63% of Californians are concerned about whether the Census Bureau will keep their responses confidential, as the law requires. The concern is more acute among Latinos (74%) and African Americans (74%) than among Asian Americans (64%) or whites (52%). Immigrants are also much more likely to be concerned than US-born residents.

Figure: Majorities Are Concerned About the Confidentiality of Census 2020
The Census Bureau conducted an extensive survey and a set of focus groups to identify key reasons for people’s possible reluctance to participate in the census, as well as potential motivating factors that could improve participation. The focus groups revealed that merely informing people of the Census Bureau’s data protection policies was unlikely to assuage concerns.

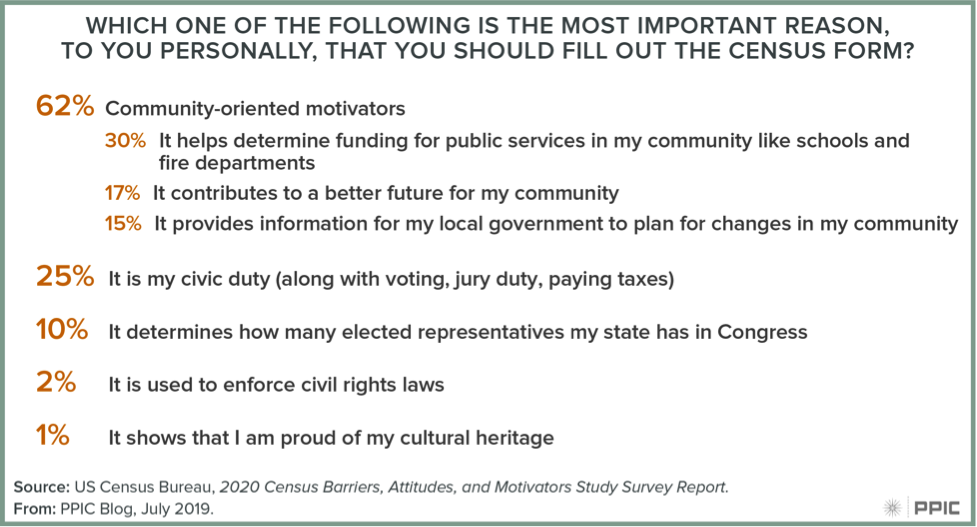
Focus group participants across all demographic groups identified the census’s role in providing federal funding for communities as the main motivator for responding to the census. And 62% of survey respondents said that benefits to the community—determining funding (30%), contributing to a better future for the community (17%), and providing information for local planning (15%)—are the most important reason to fill out the census.

Figure: Most Important Reason to Fill Out the Census Form

But fewer than half of survey respondents knew that the census is used to determine local funding levels, suggesting that this information could go a long way toward motivating participation. Focus group participants—who were chosen from demographic groups deemed likely to respond at low rates—also indicated that hearing directly from trusted voices in their own communities would be important.

Community organizations and elected officials are already acting on this information. On April 1, Los Angeles city and county officials convened a rally to promote the census, emphasizing the link to federal tax dollars for local programs. The Hispanic Federation’s messaging also highlights the census’s role in allocating federal funds.

More efforts are underway. Governor Newsom has pledged an investment of $187 million for outreach activities to boost participation. Meanwhile, the California Complete Count Office has begun issuing grants to help local organizations communicate directly with hard-to-count populations.

Focusing on local funding and community benefits is a promising approach, but a strong outreach strategy will have to go further. A complete and accurate count will likely depend on hard-to-count populations working to develop and deliver the most effective messages for their own communities.

California’s Brain Gain Continues

[vc_row][vc_column][vc_column_text]California’s heyday of rapid population growth—the post-World War II era—was fueled by millions of migrants coming to the state from the rest of the country. Those days are long gone. California’s population continues to grow (through births and international migration), but every year it loses tens of thousands of people to other states. And yet there is one group that California continues to attract: college graduates.

This interstate migration pattern—gaining large numbers of college graduates while losing large numbers of less educated adults—doesn’t happen anywhere else in the country. Over the past five years, California has attracted 162,000 more college graduates (adults with at least a bachelor’s degree) from other states than it has lost. Over the same period, the University of California (UC) awarded about 300,000 bachelor’s degrees at its nine undergraduate campuses. In other words, interstate migration provides California with half as many college graduates as the entire UC system.

figure - California Gains College Graduates While Losing Less Educated Adults

College  graduates  come  to  California  from  all  over,  but  eight  states send California substantially more college graduates than they get in return. Between 2012 and 2017, net gains of college graduates from New York (51,000), Illinois (31,000), Pennsylvania (24,000), New Jersey (20,000), Massachusetts (20,000), Florida (16,000), Michigan (13,000), and Ohio (11,000) totaled more than 186,000. California experienced smaller but still sizable net losses (totaling 80,000) to five states: Texas (29,000), Oregon (16,000), Nevada (13,000), Arizona (12,000), and Washington (10,000).

The new migrants to California tend to be quite young. Indeed, college graduates age 20–29 account for almost all of the net gains. (In contrast, California experiences small net losses of older college graduates.) From a labor market perspective, attracting young college graduates is especially advantageous. Young adults with college degrees are at the start of their careers and provide the state with much-needed highly educated workers.

figure - College Graduates Moving To California Tend To Be Young

In fact, college graduates moving to California are more likely to be employed than those leaving the state. The largest gains are primarily in majors that are in relatively high demand in the labor market, including engineering (33,000), communications (18,000), business (18,000), and computer science (17,000).

The migration of young college graduates to California is a consequence of the state’s growing demand for highly skilled and highly educated workers. But the numbers are not high enough to fully meet the state’s changing needs. Although many college graduates move to California from other states, the most important source of highly educated workers in California are the state’s own colleges and universities. Policies and practices to improve college access and completion in the state will ensure that more Californians are able to help create and benefit from a strong economy.[/vc_column_text][/vc_column][/vc_row]

Video: Career Pathways and Economic Mobility at California’s Community Colleges

About a third of future jobs in California will require more than a high school diploma but less than a bachelor’s degree. By training workers for these jobs, career education—also known as career technical education or vocational training—plays an integral role in meeting California’s workforce needs and improving students’ economic well-being.

At an event in Sacramento last week, PPIC researcher Shannon McConville outlined the findings of a new report on career education and economic mobility, and a panel of experts discussed the implications for students, colleges, and the state as a whole.

McConville noted that completing a career education credential at a California community college confers a 20% wage gain, on average. But economic benefits vary greatly across program areas. For instance, returns to health credentials tend to be substantial, while business and IT credentials yield lower returns.

The panelists began by highlighting current efforts to improve students’ labor market outcomes. Marty Alvarado, executive vice chancellor for educational services at California’s community colleges, explained the system’s “two-pronged approach” to making sure programs connect to in-demand, high-return careers. One area of focus is regional infrastructure, which includes regional labor market centers that provide colleges with data on local industries. The second area includes tools to help students better navigate their program choices, “while also trying to make transparent the earnings projections for students as they move into these career options.”

Supporting students—especially low-income students from underrepresented demographic groups—in completing high-return credentials was another topic of conversation. Alvarado discussed efforts at the community colleges to streamline processes that may be creating “unnecessary barriers for students,” while Assemblymember Autumn Burke emphasized the importance of access to social safety net services so students can focus on their career.

Alma Salazar, senior vice president of the Center for Education Excellence and Talent Development at the Los Angeles Area Chamber of Commerce, noted that all stakeholders need to be involved. “How do we get the system as a whole to take ownership in helping us collectively solve for these problems? . . . It has to go beyond Sacramento. It has to go beyond the system’s leadership. It has to get to the institutional level and the people who work [there], who have to be equally committed.”

While many see the evolving nature of work and increasing automation as challenges, Assemblymember Burke was optimistic about providing a “just transition” for workers who may lose jobs in fast-changing industries. “We can train people for this new economy [and] prepare them now. . . . It’s a shortcoming to worry about losing minimum-wage jobs, because there’s so much opportunity on the other side.”

Interview: Citizenship and the 2020 Census

This post is part of a series examining challenges involved in the 2020 Census and what’s at stake for California. 

photo - Eric McGheeAfter a heated legal battle, the Supreme Court has ruled that the Trump administration cannot for now include a question on the 2020 Census asking if residents are US citizens. We spoke with PPIC senior fellow Eric McGhee about what this decision means for California.

PPIC: Why is the citizenship question controversial?

Eric McGhee: First, the question could significantly discourage responses among immigrants, who might fear the data would be used to target them. It didn’t go through the normal testing process for new questions, and many Census Bureau employees recommended against adding it because of concerns about data quality.

Second, the Trump administration says the question is necessary to properly enforce the Voting Rights Act. But advocates for immigrant communities dispute this justification and argue that current citizenship data is sufficient to protect against voting discrimination.

Third, it could have a huge impact on political representation and how congressional and state legislative districts are drawn. Districts are currently drawn based on total population. But this question could make it possible for states to use citizens or voting-eligible residents instead, which would tilt representation in favor of those groups.

PPIC: What does all this mean for California?

EM: Response rates will likely be better if the question is not added. But there’s also concern that the damage has already been done—immigrants still might not be inclined to respond. Immigrants make up about a quarter of California’s population, so we’re particularly vulnerable.

A large undercount could result in less federal funding for California. We’re also the only state at risk of losing a congressional seat from an undercount—other states with high immigrant populations like Arizona and Texas might not gain as many seats, but they probably won’t lose a seat they already have, even if there’s a bad count.

Households with undocumented members are the most likely to be undercounted. PPIC research looked at the possibility of a 10% undercount of these households, a reasonable assumption based on existing research. It would mean missing about half a million Californians.

The reality is that census data is thoroughly protected, even from law enforcement agencies like the FBI and ICE. But our May PPIC survey—conducted before the Supreme Court decision—found 63% of Californians were concerned the Census Bureau will not keep responses confidential. Latinos (74%), immigrants (71%), and African Americans (70%) were especially likely to be concerned.

There are other uncertainties too. The 2020 Census will use a new internet-based approach, which hasn’t been comprehensively tested. And people in general are becoming more reluctant to respond to the census. This means the bureau has to do more follow-up, which is expensive and increases the likelihood of problems arising.

PPIC: What can California do to ensure a complete and accurate count?

EM: California is way ahead of other states in terms of funds it has dedicated to census outreach. The state has already appropriated about $100 million to support a better count, and Governor Newsom has proposed another $50 million or so. Philanthropic organizations have chipped in about $30 million. There’s been a great deal of planning at the state and local levels to get the best count possible.

Addressing concerns about confidentiality could go a long way toward encouraging people to respond. Research also suggests that raising awareness about the census’s role in funding public services like health care, roads, highways, and fire and police departments is another promising approach.