Hans Johnson, director and senior fellow at the PPIC Higher Education Center, testified today, February 6, 2018, before the Assembly Budget Subcommittee No. 2 on Education Finance and the Assembly Higher Education Committee. The master plan defined a strategy to meet the state’s education needs in 1960—but today, California faces new challenges. The topic of today’s hearing: how to meet the state’s future economic need for more college graduates. Here are his prepared remarks.
PPIC’s work has revealed a serious gap between the number of highly educated workers that California’s future economy will need and the number the state is on pace to produce. We call this the workforce skills gap—and it’s quite large. To meet economic demand and secure a more prosperous future for our state, California’s higher education institutions will need to produce 1.1 million more college graduates by 2030.
Admittedly, doing so is an ambitious goal. But there is significant room for improving how many students graduate from college—especially if we consider that currently only about 30 percent of California’s 9th graders will earn a bachelor’s degree.

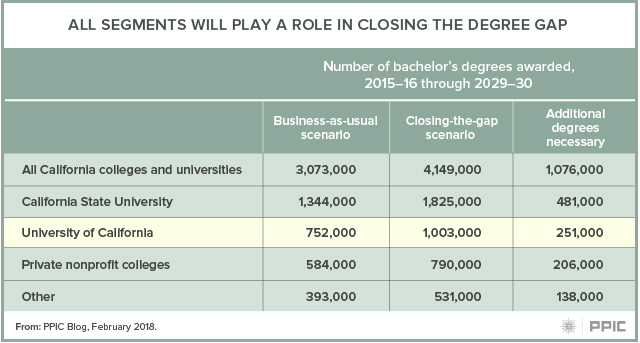
PPIC has quantified the role of each university segment—the University of California, the California State University, and private nonprofit colleges in California—in closing the workforce skills gap. Overall, the number of bachelor’s degrees would need to increase by about one-third over baseline projections. Almost half of the gains would need to occur at CSU, the nation’s largest public university system. UC and private nonprofit colleges would also play an important role.
Most immediate to today’s conversation about goal setting for the state’s public systems, PPIC has identified the combination of increases in freshman eligibility, transfer, and completion rates necessary to close the gap.
Our preferred approach—a closing-the-gap scenario—combines increases in eligibility, transfer, and graduation rates, as shown below. Along with increases in enrollment and completion at private institutions, reaching these targets would fully close the workforce skills gap.
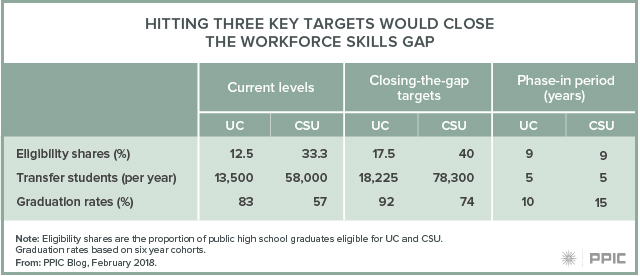
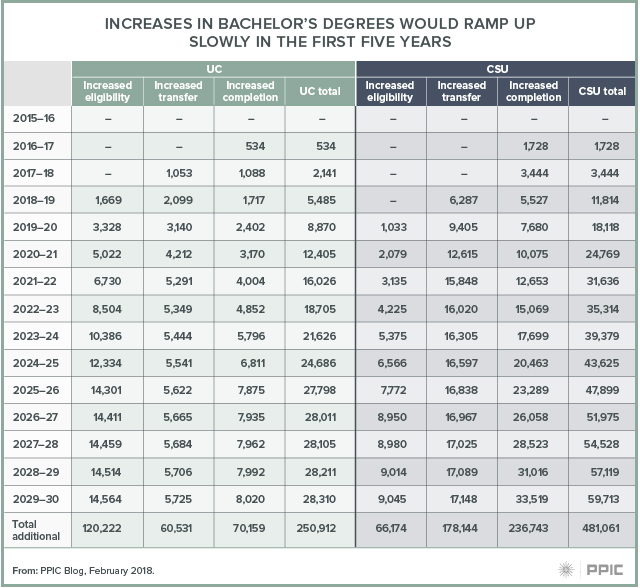
In our scenario, each target would be reached gradually through a phase-in period. In the first few years, projected increases would be minimal as the systems would enroll more students and implement policies to improve completion and transfer. But within five years, the increases would become quite large. By 2020–21, CSU would award almost 25,000 additional bachelor’s degrees; UC would award more than 12,000.
For the purposes of setting annual goals, we are identifying annual targets in new freshmen enrollment, transfer, and completion rates that would match the closing-the-skills gap degree targets. Enrollment and transfer targets depend on graduation rates and time to degree—meaning that enrollment increases could be lower if graduation rates improve and students complete their degrees more quickly. For example, students who take 12 units per semester will take five years of continuous enrollment to earn the 120 units necessary for graduation. If those students instead took 15 units per semester, they would graduate in four years and free up additional space for other students.
It has been a couple years since PPIC first developed our projections, and we’ve now been able to chart early progress by the systems. Later you will hear in detail from the segments about their plans, but right now I am happy to report some good news: the number of bachelor’s degrees awarded at UC and CSU is actually higher than our initial scenario called for.
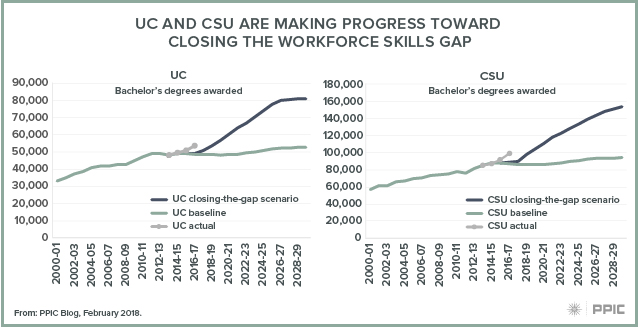
Of course, we are just at the start of our projection period, and to close the gap the numbers must ramp up quickly after the first few years. Nonetheless, growth in graduation rates and enrollment has led to a notable expansion in degrees awarded at both systems. Over the past two years, UC and CSU combined have awarded 295,000 bachelor’s degrees—21,000 more than in our closing-the-gap-scenario and 23,000 more than in our baseline scenario. In addition, the number of transfer students has increased 8%, also higher than in our closing-the-gap scenario.
In addition, community colleges and CSU have adopted new goals for student success that are entirely consistent with PPIC’s closing-the-gap scenario. CSU’s new graduation initiative calls for reducing time to degree and increasing both four-year and six-year graduation rates. CSU’s goal of a 70% six-year graduation rate by 2025 is in line with and in fact slightly more ambitious than our scenario. In their new “Vision for Success,” the community colleges have adopted a goal to increase transfer to UC and CSU by 35% over the next five years, a goal that is entirely consistent with our work.
There is an important additional benefit of meeting these goals: reducing equity gaps. Today, students who have been underrepresented in higher education—including Latino, African American, low-income, and first-generation students—make up a majority of California’s high school graduates. Strong increases in college preparation among the state’s high school graduates are expanding the pool of potential college graduates, with the share of students—including African American and Latino students—completing the college preparatory requirements of UC and CSU reaching an all-time high. Ensuring that the growing number of prepared high school graduates have meaningful access to and success in higher education will not only help California meet its economic challenges, it will ensure that higher education continues to serve as a ladder of economic and social mobility.
Our focus at PPIC has been on college graduates with at least a bachelor’s degree, but we acknowledge the importance of other postsecondary training. We have a series of reports and ongoing projects that identify successful vocational pathways and high value awards (certificates and associate degrees) offered by the state’s community colleges. Lande Ajose of California Competes will discuss in more detail the need for sub-baccalaureate post-secondary education. We also acknowledge the importance of post-baccalaureate education, including professional and academic graduate degrees offered primarily by UC and the state’s private nonprofit colleges. Those degree holders have the best labor market outcomes in the state.
Figuring out how to pay for all these increases is no easy task and will be discussed later in this hearing. Let me alert you to two projects underway at PPIC that will help shed light on this issue. One will examine the role that tuition policy could play and the other will focus on capital finance. In addition, we will continue to monitor affordability issues, including student debt, identified by respondents to the PPIC Statewide Survey as the number one higher education issue.
Finally, it is worth noting that the governor has proposed a funding formula for the community colleges that for the first time will provide additional funding based on student outcomes and enrolling low-income students. PPIC has argued that this approach has the potential to incentivize investment by the state’s higher education systems in areas that further state priorities.


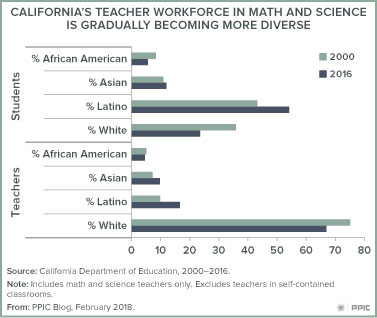 As California’s schools continue to implement new math and science standards, the challenge of developing a larger and more diverse teacher workforce will loom large. There are examples of efforts both in California and in other states designed to address some of these challenges. For example,
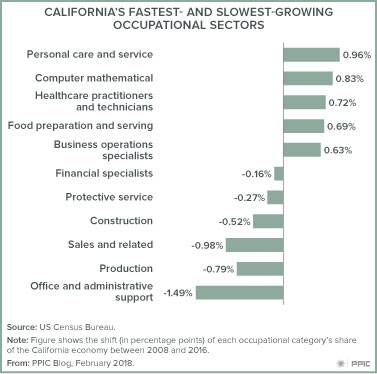 Overall, California’s workforce is becoming more educated: the share of the full-time year-round workforce with at least a bachelor’s degree grew from 31% in 2008 to 35% in 2016. Highly educated workers got more than half of the jobs created in the five fastest-growing occupational categories (based on increases in the share of total full-time year-round workers) between 2008 and 2016:
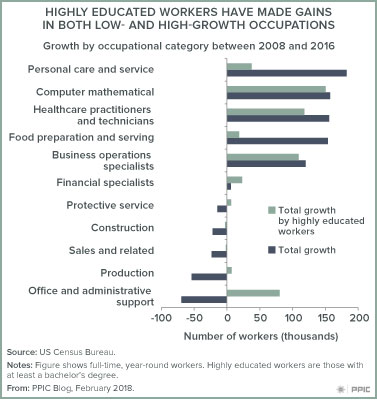 Workers with at least a bachelor’s degree also made gains in the five slowest-growing occupational categories: