New Approaches for the PPIC Statewide Survey

As the polling world knows, times—and survey methods—are changing. The rise of cell phones and decline in landline use has had an enormous effect on telephone polling methods. So have internet surveys. The PPIC Statewide Survey has kept abreast of these changes, evaluating and incorporating best practices throughout our 20-plus years in the business. The most recent update involves using online polling techniques for our next survey.

Online polling was initially viewed with great skepticism by experts in the field. However, significant progress has been made in this area. Today, a rigorous online survey using a random probability sample is widely accepted as an alternative to a rigorous live telephone survey using a random probability sample. Our research into this methodology—including extensive conversations with colleagues at peer organizations who are also using online and live telephone surveys, such as the Kaiser Family Foundation, Langer Research Associates, and the Pew Research Center—has provided us with strong assurances of quality.

Last fall, we conducted a simultaneous online and telephone poll to compare our results. We found that the online method we chose yielded results with the same high quality as our telephone polling (which includes both landline and cellphone participants).

This spring, we are conducting our first fully online-only survey, on the topic of Californians and education. This method will allow us to delve into more issues and in greater depth than we do in a live telephone survey. We are excited about this approach and looking forward to the results.

At the same time, the PPIC Statewide Survey will continue to rely on landline and cellphone polling techniques for the bulk of our work for the forseeable future, given the current limits in random probability samples for large online surveys in California and the reliability and proven track record of live telephone surveys.

As we move toward new frontiers, our survey methods will always place quality first and be completely transparent, with clear methodological explanations and detailed results available on our website. Most important, we will continue to provide a voice for all Californians—voters and nonvoters alike—raising awareness, encouraging discussion, and informing policymakers on critical issues of the day.

Leveling the Playing Field in College Admissions

Recent news of wealthy parents allegedly paying bribes to get their children into elite colleges has raised a lot of questions about the college admissions process. While fewer than 100 students were involved—out of more than 1 million new college freshmen every year—the scandal brings up larger issues of equitable college access and high income inequality in California.

More than half of Californians (53%) say qualified students from low-income families have less opportunity than other students to get a college education, according to a 2018 PPIC survey. Even without resorting to bribery, there are many advantages that students from high-income families have in college admissions, including living in safer neighborhoods, attending better high schools, and having more help preparing for the application process (e.g., paying for SAT or ACT prep courses). Admission practices at most private colleges also favor students who can pay the full price of attending.

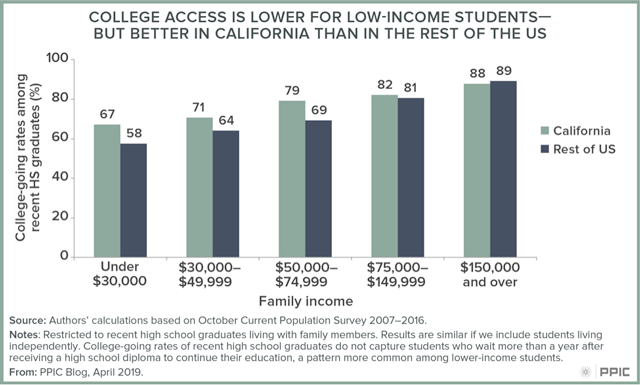
Our recent report on economic mobility and higher education highlights the challenges facing low-income students in California—but also offers some hope. Although recent high school graduates from low-income families are less likely to enroll in college than students from higher-income families, a greater percentage of low-income students go to college in California (67%) compared to other states (58%). Enrollment gaps between low- and high-income students in California (21 percentage points) are also substantially lower than in the rest of the country (31 percentage points).

Figure 1: College Access is Lower For Low-Income Students--But Better in California Than In the Rest of the US

California’s large public higher education system is key to ensuring broad access. The University of California (UC) enrolls more low-income students than any other public research university system in the country. Indeed, applicants from disadvantaged backgrounds are given extra consideration in UC’s “holistic review” process. Thirty-eight percent of UC undergraduates in 2016–17 received Pell grants (federal grants to low-income students), compared to 26% of undergraduates at public research universities in the rest of the country.

California State University (CSU), the largest public university system in the country, provides even more access than UC. Almost half (49% in 2016–17) of CSU students receive Pell grants. California’s private nonprofit colleges also play an important role, with 29% of their undergraduates receiving Pell grants.

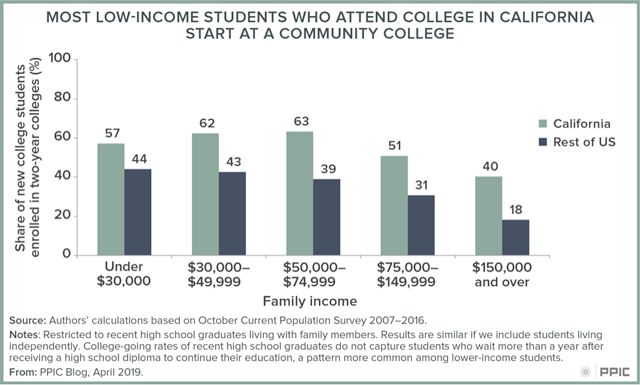
But perhaps most important are California’s community colleges. More than half of low-income students who attend college in California start at a community college.

Figure 2: Most Low-Income Students Who Attend College in California Start at a Community College

Although college access for low-income students in California is relatively good compared to the rest of the nation, more can be done. For example, improving financial aid would make college more accessible to more low-income students and would likely lead to higher graduation rates. And because so many low-income students start at community colleges, increasing transfer rates is critical to ensuring that higher education continues to serve as a ladder of economic mobility. New reforms at the community colleges—including changes in remediation and the Associate Degree for Transfer program—should lead to substantial increases in transfer and help more students achieve their academic and economic goals.

A New Reality for Federal Flood Insurance

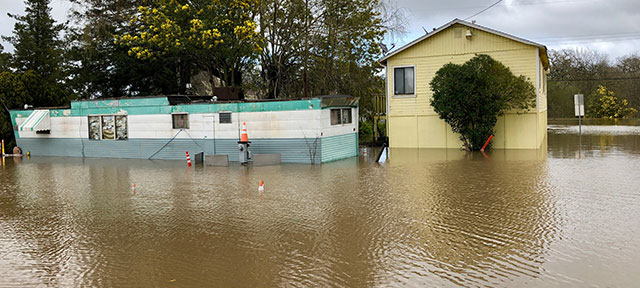
Flood damages have been rising around the country―most recently in the Midwest. The National Flood Insurance Program provides coverage to more than 5 million households and small businesses across the United States, including more than 229,000 in California. The program has been hard hit by payouts from major flood disasters in recent years and is heavily in debt. The Federal Emergency Management Agency (FEMA), which houses the program, has recently announced significant changes. We talked to Carolyn Kousky, a flood insurance expert at the Wharton Risk Center at the University of Pennsylvania and a member of the PPIC Water Policy Center’s research network, about the program.

PPIC: How is the national flood insurance program changing?

CAROLYN KOUSKY: FEMA is modernizing how it prices flood insurance policies, drawing on best practices in risk modeling. The changes are scheduled to roll out in October 2020. One big change is that new rates will be property-specific and based on factors like how close a property is to a river or its elevation. Higher-risk properties will have higher rates. Previously, everyone in a high-risk zone paid the same rates, regardless of the level of actual risk. This change should be easier to understand for residents, which is an important improvement. Economists have been calling for such an approach for a long time.

These changes will also mean that rates vary more smoothly across a community. FEMA flood maps designate so-called “100-year” floodplains. In the old system, if your house was just outside that line your rates dropped dramatically—it was like a cliff between rates. Neighbors might have differences of $1,000 or more, but of course the risk between neighboring houses was almost never that big. This new system should eliminate that cliff.

The new pricing won’t help low-income families afford insurance, so there will still be a need for an affordability program. But the new pricing will eliminate another inequity. The previous rates didn’t always take into account the value of the structure being insured. That meant that higher-value structures were paying less than they should, and lower-value ones were paying too much. So to the extent that the value of a house reflects income, poorer households were being penalized. This problem is now being fixed.

PPIC: The federal government has acknowledged that most of its flood maps don’t reflect rising risk, and now some communities have created stricter standards to help them prepare for floods in a changing climate. Will this new approach help the program prepare for climate change?

CK: In some ways, yes. One important thing the new pricing does is add flood risk from rainfall. Previously the program’s pricing largely only reflected risks from coastal storm surge and rivers overflowing their banks. Rainfall risk is increasing with climate change, so this is a very positive change in the program. We saw the damage that rainfall flooding can produce in an extreme way with Hurricane Harvey.

These annual insurance policies only price for next year’s risk―and this is how it should be. It wouldn’t make sense for property owners to have to pay today for risks 50 years down the road. So the rating changes are not about managing climate changes. But we do need to think about increasing climate risk when planning new development and infrastructure and making other longer-term investments.

PPIC: Do you think these changes will make the program fiscally sustainable for the long term?

CK: As I understand it, these changes are about making sure the prices better reflect current risks. Based on what FEMA has released so far, there’s no way to know how it will affect the program’s revenue.

This new pricing is definitely fairer and more reflective of risk. If Congress coupled that with forgiving the program’s existing debt—which is still in the tens of billions―the program could use this as a re-set on its fiscal sustainability. There is a bill in the House right now that would do this. But thinking about the long-term fiscal soundness of the program in the face of new urban development and a changing climate would likely require more than just rating changes.

That said, there are so many benefits to making these changes in the insurance program. It’s a great first step to modernizing the system.

Californians and Their Tax Burden

It’s April 15—the perfect day to explore how Californians feel about the state and local tax system and how much they pay in taxes. According to the most recent PPIC Statewide Survey, seven in ten Californians believe that California currently ranks near the top (48%) or above average (22%) in state and local tax burden per capita. The public’s perception is somewhat in line with fiscal facts: California’s state and local tax collections per capita in 2015 were 10th-highest in the nation (Tax Policy Center, September 2018).

Notably, Republicans (65%) are much more likely than Democrats (47%) and independents (48%) to say California’s state and local tax burden is near the top. The share of Californians expressing this view increases with rising income (39% under $40,000, 52% $40,000 to $80,000, 61% $80,000 or more) and this view is more common among whites (57%) than among other racial/ethnic groups (47% Asian Americans, 44% African Americans, 38% Latinos).

Half of Californians (52%)—a record-high share—say that the state and local tax system is either not too fair (25%) or not at all fair (27%). This marks a 10-point increase since March 2017 and a 21-point increase since the first time we asked this question in June 2003. There are notable differences along partisan lines. More than two in three Republicans (69%) see the state and local tax system as not too or not at all fair, as do nearly six in ten independents (58%), compared to about four in ten Democrats (43%).

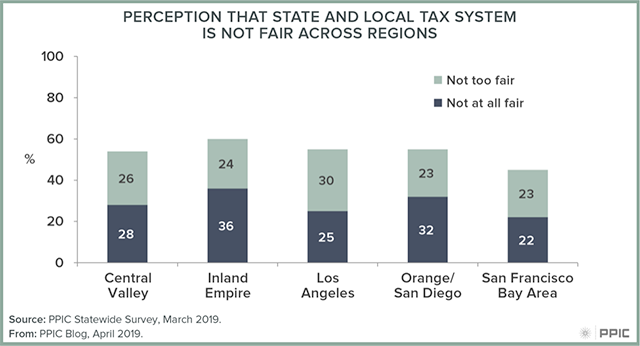
The belief that the system is not fair is widely held across regions, ranging from a high of 60% in the Inland Empire to 45% in the San Francisco Bay Area. Lower-income adults (46%) are somewhat less likely than more-affluent adults (60% $40,000 to $80,000, 54% $80,000 or more) to say that the current state and local tax system is not fair.

Figure 1: Perception That State and Local Tax System is Not Fair Across Regions

A record-tying 60% of Californians say they pay much more (39%) or somewhat more (21%) than they should in state and local taxes. The share saying they pay much more than they should is a record high and has increased 13 points since we first asked this question in February 2003. This view is widely held across regions and demographic groups. Notably, Republicans (61%) are more than twice as likely as Democrats (25%) and much more likely than independents (42%) to say they pay much more than they should.

Figure 2 - Shares Saying They Pay Much More in State and Local Taxes Than They Should

That said, California voters have passed tax increases in recent years, including extending the Proposition 30 income tax increases in 2016 and rebuffing an effort to repeal the recently passed increase to the state gas tax in 2018. Further, voters across the state have been more than willing to pass local tax measures. With a new governor and a supermajority of Democrats in the state legislature, are new taxes on the horizon? Stay tuned as the PPIC Statewide Survey gauges public support for any new proposals.

Video: A Conversation with Chief of Staff Ann O’Leary

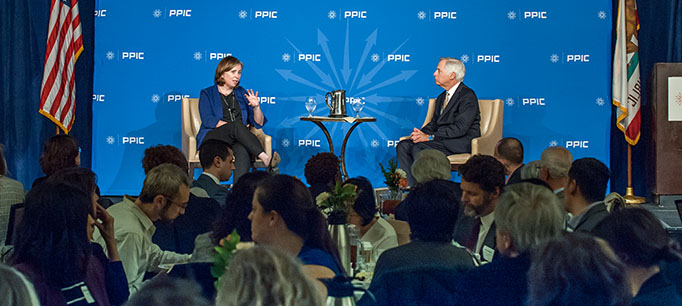
As the Newsom administration lays out its initial plans, PPIC invited chief of staff Ann O’Leary to discuss some of the governor’s top priorities. In a wide-ranging discussion with PPIC president Mark Baldassare last week, O’Leary identified the “cost crisis” in California as one of the main challenges that Governor Newsom plans to address.

“By ‘cost crisis,’ I mean how do we make sure that people in California can have affordability and the opportunity to really take advantage of the California dream?” O’Leary said. “I think too many people in California are really seeing that slip away. They’re not able to afford homes, they’re not able to afford child care, and they’re not able to pay for college for their children as they grow older.”

O’Leary pointed out that confronting this cost crisis would take many forms, such as taking on health care affordability, investing in “cradle to career” education, and addressing housing production and rising rents.

She underscored that the governor’s first proposed budget reflects his vision for promoting affordability and opportunity while ensuring the state’s long-term financial stability. Newsom’s plan includes a mix of one-time and ongoing funding as well as a robust rainy day fund, but “we also go further than that. We have a reserve fund for the safety net, and we also look at how we could use some of the surplus to pay down pension liabilities.”

The governor has also focused on other key challenges—for example, responding to wildfires and tackling the unmet need for safe drinking water in many parts of the state.

On wildfires, O’Leary noted that the governor wants to “make sure that we’re continuing with those recovery efforts to help communities that have been harmed, but also to prepare for future wildfires.” On drinking water, O’Leary said that the governor has already worked with the legislature to provide $20 million in emergency funding to address this issue.

Navigating the PG&E bankruptcy filing is another immediate priority. O’Leary said that over the next 60 days the governor’s team would be creating a roadmap for the state to “protect wildfire victims, protect employees who are out there every day trying to make sure we’re safe, and make sure fundamentally that we have safe and affordable power and that we’re meeting our clean-energy goals.”

O’Leary also discussed the federal-state relationship and how the governor plans to manage it. While pointing out that the state and federal governments need to work together as much as possible, O’Leary also underscored that California must stand up for its values when fundamental disagreements exist, especially on issues such as immigration and family planning. “These are differences of opinion. And it’s a needle we have to thread, but we’re going to do our best.”

Interactive: A Look at Child Poverty across California

[vc_row][vc_column][vc_column_text]Governor Newsom’s first budget proposal included notable efforts to address poverty—especially child poverty—by increasing CalWORKs cash assistance grants, expanding assistance to low-income parents pursuing higher education, and further expanding the state’s Earned Income Tax Credit (CalEITC, which he proposed renaming the Working Families Tax Credit).

California has a troublingly high child poverty rate of 21.3%, or about 1.9 million children, according to our latest estimates from the California Poverty Measure (CPM). The CPM is a joint research effort between PPIC and the Stanford Center on Poverty and Inequality that, unlike official poverty metrics, takes into account the cost of living and benefits from social safety net programs.

While poverty rates in the state are also high, child poverty rates tend to be even higher, particularly in the most populous counties. For example, in Los Angeles County, 24.3% of all residents—but 27.8% of children—live in poverty. Altogether, 17 counties, 29 congressional districts, 21 senate districts, and 42 assembly districts have child poverty rates of more than about 20%.

State and federal policies play an important role in lowering child poverty. Our estimates indicate that over a third (35.3%) of children would be in poverty, were it not for programs like CalFresh food assistance, the federal and state Earned Income Tax Credits, and CalWORKs cash assistance. PPIC research also shows that new policies could reduce child poverty even further, although effects vary across the state. We will continue to track and analyze poverty and child poverty to provide this critical information to policymakers and stakeholders.[/vc_column_text][/vc_column][/vc_row][vc_row][vc_column][vc_raw_html]JTNDZGl2JTIwY2xhc3MlM0QlMjd0YWJsZWF1UGxhY2Vob2xkZXIlMjclMjBpZCUzRCUyN3ZpejE1NDc4MjcxODU1NTglMjclMjBzdHlsZSUzRCUyN3Bvc2l0aW9uJTNBJTIwcmVsYXRpdmUlMjclM0UlM0Nub3NjcmlwdCUzRSUzQ2ElMjBocmVmJTNEJTI3JTIzJTI3JTNFJTNDaW1nJTIwYWx0JTNEJTI3JTIwJTI3JTIwc3JjJTNEJTI3aHR0cHMlM0ElMjYlMjM0NyUzQiUyNiUyMzQ3JTNCcHVibGljLnRhYmxlYXUuY29tJTI2JTIzNDclM0JzdGF0aWMlMjYlMjM0NyUzQmltYWdlcyUyNiUyMzQ3JTNCQ2glMjYlMjM0NyUzQkNoaWxkUG92ZXJ0eWJ5Q2FsaWZvcm5pYUNvdW50eWFuZExlZ2lzbGF0aXZlRGlzdHJpY3RfMCUyNiUyMzQ3JTNCQ291bnRpZXMlMjYlMjM0NyUzQjFfcnNzLnBuZyUyNyUyMHN0eWxlJTNEJTI3Ym9yZGVyJTNBJTIwbm9uZSUyNyUyMCUyRiUzRSUzQyUyRmElM0UlM0MlMkZub3NjcmlwdCUzRSUzQ29iamVjdCUyMGNsYXNzJTNEJTI3dGFibGVhdVZpeiUyNyUyMCUyMHN0eWxlJTNEJTI3ZGlzcGxheSUzQW5vbmUlM0IlMjclM0UlM0NwYXJhbSUyMG5hbWUlM0QlMjdob3N0X3VybCUyNyUyMHZhbHVlJTNEJTI3aHR0cHMlMjUzQSUyNTJGJTI1MkZwdWJsaWMudGFibGVhdS5jb20lMjUyRiUyNyUyMCUyRiUzRSUyMCUzQ3BhcmFtJTIwbmFtZSUzRCUyN2VtYmVkX2NvZGVfdmVyc2lvbiUyNyUyMHZhbHVlJTNEJTI3MyUyNyUyMCUyRiUzRSUyMCUzQ3BhcmFtJTIwbmFtZSUzRCUyN3NpdGVfcm9vdCUyNyUyMHZhbHVlJTNEJTI3JTI3JTIwJTJGJTNFJTNDcGFyYW0lMjBuYW1lJTNEJTI3bmFtZSUyNyUyMHZhbHVlJTNEJTI3Q2hpbGRQb3ZlcnR5YnlDYWxpZm9ybmlhQ291bnR5YW5kTGVnaXNsYXRpdmVEaXN0cmljdF8wJTI2JTIzNDclM0JDb3VudGllcyUyNyUyMCUyRiUzRSUzQ3BhcmFtJTIwbmFtZSUzRCUyN3RhYnMlMjclMjB2YWx1ZSUzRCUyN3llcyUyNyUyMCUyRiUzRSUzQ3BhcmFtJTIwbmFtZSUzRCUyN3Rvb2xiYXIlMjclMjB2YWx1ZSUzRCUyN25vJTI3JTIwJTJGJTNFJTNDcGFyYW0lMjBuYW1lJTNEJTI3c3RhdGljX2ltYWdlJTI3JTIwdmFsdWUlM0QlMjdodHRwcyUzQSUyNiUyMzQ3JTNCJTI2JTIzNDclM0JwdWJsaWMudGFibGVhdS5jb20lMjYlMjM0NyUzQnN0YXRpYyUyNiUyMzQ3JTNCaW1hZ2VzJTI2JTIzNDclM0JDaCUyNiUyMzQ3JTNCQ2hpbGRQb3ZlcnR5YnlDYWxpZm9ybmlhQ291bnR5YW5kTGVnaXNsYXRpdmVEaXN0cmljdF8wJTI2JTIzNDclM0JDb3VudGllcyUyNiUyMzQ3JTNCMS5wbmclMjclMjAlMkYlM0UlMjAlM0NwYXJhbSUyMG5hbWUlM0QlMjdhbmltYXRlX3RyYW5zaXRpb24lMjclMjB2YWx1ZSUzRCUyN3llcyUyNyUyMCUyRiUzRSUzQ3BhcmFtJTIwbmFtZSUzRCUyN2Rpc3BsYXlfc3RhdGljX2ltYWdlJTI3JTIwdmFsdWUlM0QlMjd5ZXMlMjclMjAlMkYlM0UlM0NwYXJhbSUyMG5hbWUlM0QlMjdkaXNwbGF5X3NwaW5uZXIlMjclMjB2YWx1ZSUzRCUyN3llcyUyNyUyMCUyRiUzRSUzQ3BhcmFtJTIwbmFtZSUzRCUyN2Rpc3BsYXlfb3ZlcmxheSUyNyUyMHZhbHVlJTNEJTI3eWVzJTI3JTIwJTJGJTNFJTNDcGFyYW0lMjBuYW1lJTNEJTI3ZGlzcGxheV9jb3VudCUyNyUyMHZhbHVlJTNEJTI3eWVzJTI3JTIwJTJGJTNFJTNDJTJGb2JqZWN0JTNFJTNDJTJGZGl2JTNFJTIwJTIwJTIwJTIwJTIwJTIwJTIwJTIwJTIwJTIwJTIwJTIwJTIwJTIwJTIwJTIwJTNDc2NyaXB0JTIwdHlwZSUzRCUyN3RleHQlMkZqYXZhc2NyaXB0JTI3JTNFJTIwJTIwJTIwJTIwJTIwJTIwJTIwJTIwJTIwJTIwJTIwJTIwJTIwJTIwJTIwJTIwJTIwJTIwJTIwJTIwdmFyJTIwZGl2RWxlbWVudCUyMCUzRCUyMGRvY3VtZW50LmdldEVsZW1lbnRCeUlkJTI4JTI3dml6MTU0NzgyNzE4NTU1OCUyNyUyOSUzQiUyMCUyMCUyMCUyMCUyMCUyMCUyMCUyMCUyMCUyMCUyMCUyMCUyMCUyMCUyMCUyMCUyMCUyMCUyMCUyMHZhciUyMHZpekVsZW1lbnQlMjAlM0QlMjBkaXZFbGVtZW50LmdldEVsZW1lbnRzQnlUYWdOYW1lJTI4JTI3b2JqZWN0JTI3JTI5JTVCMCU1RCUzQiUyMCUyMCUyMCUyMCUyMCUyMCUyMCUyMCUyMCUyMCUyMCUyMCUyMCUyMCUyMCUyMCUyMCUyMCUyMCUyMGlmJTIwJTI4JTIwZGl2RWxlbWVudC5vZmZzZXRXaWR0aCUyMCUzRSUyMDgwMCUyMCUyOSUyMCU3QiUyMHZpekVsZW1lbnQuc3R5bGUud2lkdGglM0QlMjcxMDAlMjUlMjclM0J2aXpFbGVtZW50LnN0eWxlLmhlaWdodCUzRCUyOGRpdkVsZW1lbnQub2Zmc2V0V2lkdGglMkEwLjc1JTI5JTJCJTI3cHglMjclM0IlN0QlMjBlbHNlJTIwaWYlMjAlMjglMjBkaXZFbGVtZW50Lm9mZnNldFdpZHRoJTIwJTNFJTIwNTAwJTIwJTI5JTIwJTdCJTIwdml6RWxlbWVudC5zdHlsZS53aWR0aCUzRCUyNzEwMCUyNSUyNyUzQnZpekVsZW1lbnQuc3R5bGUuaGVpZ2h0JTNEJTI4ZGl2RWxlbWVudC5vZmZzZXRXaWR0aCUyQTEuNzclMjklMkIlMjdweCUyNyUzQiU3RCUyMGVsc2UlMjAlN0IlMjB2aXpFbGVtZW50LnN0eWxlLndpZHRoJTNEJTI3MTAwJTI1JTI3JTNCdml6RWxlbWVudC5zdHlsZS5taW5IZWlnaHQlM0QlMjc3NTBweCUyNyUzQnZpekVsZW1lbnQuc3R5bGUubWF4SGVpZ2h0JTNEJTI4ZGl2RWxlbWVudC5vZmZzZXRXaWR0aCUyQTEuNzclMjklMkIlMjdweCUyNyUzQiU3RCUyMCUyMCUyMCUyMCUyMCUyMCUyMCUyMCUyMCUyMCUyMCUyMCUyMCUyMCUyMCUyMCUyMCUyMCUyMCUyMCUyMHZhciUyMHNjcmlwdEVsZW1lbnQlMjAlM0QlMjBkb2N1bWVudC5jcmVhdGVFbGVtZW50JTI4JTI3c2NyaXB0JTI3JTI5JTNCJTIwJTIwJTIwJTIwJTIwJTIwJTIwJTIwJTIwJTIwJTIwJTIwJTIwJTIwJTIwJTIwJTIwJTIwJTIwJTIwc2NyaXB0RWxlbWVudC5zcmMlMjAlM0QlMjAlMjdodHRwcyUzQSUyRiUyRnB1YmxpYy50YWJsZWF1LmNvbSUyRmphdmFzY3JpcHRzJTJGYXBpJTJGdml6X3YxLmpzJTI3JTNCJTIwJTIwJTIwJTIwJTIwJTIwJTIwJTIwJTIwJTIwJTIwJTIwJTIwJTIwJTIwJTIwJTIwJTIwJTIwJTIwdml6RWxlbWVudC5wYXJlbnROb2RlLmluc2VydEJlZm9yZSUyOHNjcmlwdEVsZW1lbnQlMkMlMjB2aXpFbGVtZW50JTI5JTNCJTIwJTIwJTIwJTIwJTIwJTIwJTIwJTIwJTIwJTIwJTIwJTIwJTIwJTIwJTIwJTIwJTNDJTJGc2NyaXB0JTNF[/vc_raw_html][/vc_column][/vc_row]

Poverty in California Is High by Any Measure

The Census Bureau recently released updated income and poverty statistics for the years 2015–2017 combined, including information on the Supplemental Poverty Measure (SPM) for states. The SPM updates official poverty statistics, which are released annually, by accounting for the varying cost of housing across states and the impact of key social safety net programs like federal and state Earned Income Tax Credits (EITCs). According to the SPM, California continues to have one of the nation’s highest poverty rates, neck-and-neck with Florida (18.1%) and Louisiana (17.6%). While California’s poverty rate for 2015–2017 was 19%, the national poverty rate was much lower, at 14.1%.

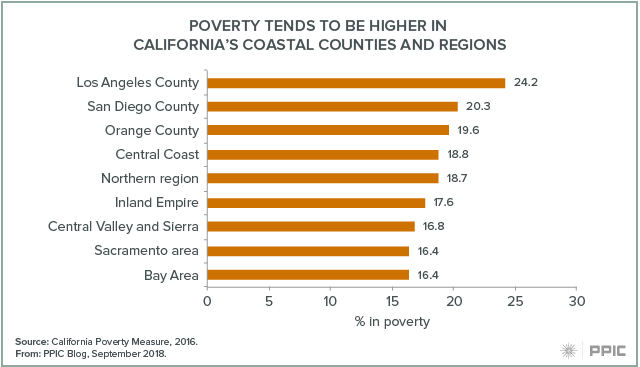
The California Poverty Measure (CPM), a collaborative effort by PPIC and the Stanford Center on Poverty and Inequality, provides additional detail needed to understand our large, complex state. It takes into account both the varying cost of living and the poverty-mitigating role of social safety net programs like the EITC and CalFresh within different regions of California. PPIC published CPM estimates in July indicating that 19.4% of Californians lived in poverty in 2016. Poverty rates are highest in certain coastal areas, including Los Angeles County, where the mix of the high cost of housing, employment opportunities for low-skilled workers, and access to large-scale social safety net programs create particularly challenging circumstances.

Blog figure: Poverty tends to be higher in coastal counties and regions

Despite the important role of social safety net programs, employment is a key factor in determining poverty status. Adults working full time and for the whole year have a poverty rate of just 8.3%, while nearly a quarter (23.5%) of those working less are in poverty. At the same time, employment does not eliminate poverty: 44.6% of working adults in poverty are actually working full time, year round.

Blog figure: Close to half of working poor adults in California are working full time, year round

What can policymakers do to improve the situation in California? The good news is that there are diverse opportunities to address poverty. Moderating housing costs, supporting proven employment and training programs, and vigorously supporting social safety net programs all offer opportunities to improve the well-being of disadvantaged Californians.

Could Wildfires Affect the 2020 Census?

The decennial census plays an essential role in American democracy. The stakes are huge for California, and 2020 is fast approaching. This series of blog posts takes a detailed look at California communities that may be at risk of being undercounted.

Wildfires in California have burned millions of acres and destroyed or threatened thousands of homes, displacing families around the state. Among their many devastating long-term effects, disasters may elevate the risk of undercounting some communities in the upcoming census.

The Census Bureau’s goal is to “count everyone, only once, and in the right place.” In practice, this means that people are counted where they reside as of “Census Day” (April 1, 2020), even if this is not their permanent residence. Given that Californians who lose their homes in disasters must then find housing in a notoriously difficult market, housing conditions alone could pose a hurdle to accurately counting communities that have been displaced by wildfires.

Hurricane Katrina presented similar issues for the 2010 Census. While some people displaced from the Gulf Coast moved away permanently, many others were counted in counties or states they intended to leave once their homes were again habitable. Still others stayed in accommodations closer to home, which—depending on resources—were sometimes shared, non-standard, or even not yet considered habitable. These families proved difficult to reach by mail, with just 45% of New Orleans households returning forms at first (compared with 61% in 2000). On-the-ground staff were ultimately responsible for hand-delivering questionnaires to the majority of New Orleans homes. Even though the Census Bureau can request a funding contingency for such costly efforts, it will have many competing demands for resources in 2020.

In the aftermath of California’s recent fires, local areas face unique challenges to getting an accurate census count—particularly in terms of housing. Here we look at three of those areas across the state. Current estimates show that 20,000 residents were affected by the Carr fire (Redding, 2018) and that the Thomas fire (Ventura County, 2017) and the Tubbs fire (Santa Rosa, 2017) each affected about 40,000 residents. Before the fires, none of these areas stood out in terms of having large populations of hard-to-count residents, but the loss of housing could create new obstacles.

Even in normal times, housing plays a key role in getting an accurate census count. Rental units and mobile homes are less likely to appear on official census address lists. Moreover, their residents tend to move more often, making them hard to reach. Wildfire displacement heightens these challenges, especially in places where housing was already hard to count. For example, mobile homes made up 6% of housing in the Thomas fire area—double the statewide average. In the Carr fire area, they constituted 10%.

Before the fires, the share of renters in all three fire areas was lower than the statewide share, but the loss of homes likely changed this picture. CalFire reports that the Thomas fire destroyed 775 homes—and subsequent mudslides in the area demolished at least another 100. The Carr fire destroyed 1,079 homes, and the Tubbs fire razed 3,000. Displaced residents are more likely to rent, reside in non-standard arrangements, and/or struggle with poverty, creating new challenges for the census count.

Blog figure: Housing conditions in fire zones varied widely

In 2020, given the likelihood that families will continue to be displaced by wildfires or other natural disasters, it will be important for state and local leaders to coordinate with the Census Bureau to ensure that all Californians are counted accurately—regardless of their housing situation. For more on areas with hard-to-count housing and other challenges, visit PPIC’s interactive census maps.

Career Technical Education: Funding & New State Oversight

President Donald Trump recently signed the Strengthening Career and Technical Education for the 21st Century Act, or Perkins V, which reauthorized $1.2 billion dollars in federal funds for career and technical educational (CTE) programs. The new law gives states more flexibility to set their own goals for CTE programs, along with reporting progress toward those goals. Who might benefit from these changes, and what new challenges do they present to the state?

Perkins V supports programs that integrate career skills and prepare students at the secondary, postsecondary, and adult education level for the workforce—for such careers as IT technician, accountant, or nurse. Funding is based on student enrollment, and each year California receives more than $110 million in Perkins dollars, the vast majority (85%) of which go to CTE programs in high schools and community colleges. During the 2017–18 school year, close to 780,000 (40%) high school students and 420,000 (35%) full-time community college students participated in CTE.

California’s CTE students generally reflect the demographics of the overall student population, though Asian American, Latino, and female students are slightly underrepresented. Over time, the overall number of students participating in CTE has decreased, but the percentage of low-income students who do so has increased. Today, low-income students account for more than half of CTE participants. Benefits associated with CTE programs include decreased high school dropout rates (for low-income students in particular), increased high school graduation rates, and higher wage returns (particularly in health fields).

Figure: Low-income students account for more than half of CTE participants in California

Although the new law provides states with greater flexibility, some of the provisions may present a challenge for those hoping to measure the impact of Perkins dollars in California. For example, under the new requirements performance indicators follow only students deemed to be “concentrators,” or those who complete a substantial number of courses in a single CTE program of study. Currently, concentrators account for less than half of CTE participants, so the indicators may not capture the outcomes of all who are served by Perkins funding. In addition, some of the core indicators—such as student placement in postsecondary CTE education—require the use of a comprehensive longitudinal database on student outcomes, a tool that California does not yet have. Furthermore, performance indicators are not broken down by industry sector, which makes it difficult to evaluate state-specific sectors, such as fashion and interior design or energy and utilities, which are unique to California’s economy.

Going forward, the Perkins reauthorization ushers in a new form of CTE program accountability at the state level. If California wants to continue to close the gap of 1.5 million workers with “some” college education, it needs to make inroads on designing, improving, and scaling up effective CTE programs—and on improving the quality of data on CTE programs and students.

Hurricanes Are Getting Worse. California Should Take Note

As Hurricane Florence ground its way through the Carolinas this past weekend, climate watchers couldn’t help but notice that the size and behavior of the storm have been eerily reminiscent of Hurricane Harvey, which devastated Houston last year. What made these two hurricanes so destructive was their slow pace and the fact that they were supercharged with moisture from bathtub-warm oceans. It’s a deadly combination that leads to epic, record-setting amounts of rainfall and unprecedented flooding, amplifying damage from the high winds and storm surge typically associated with hurricanes.

Once Florence leaves the Carolinas and the floods have receded, the nation will rally to clean up what will likely be of one of its top five most destructive hurricanes. Florence will add to this century’s staggering storm damage, caused by 22 hurricanes or tropical storms that led to more than $700 billion in damages in the United States (adjusted for inflation).

Is this part of a trend? Most certainly. The National Oceanic and Atmospheric Administration has a detailed analysis of billion-dollar US weather disasters since 1980. Clearly, weather impacts are getting much more expensive—and much more frequent.

What does this mean for California? First, like all other states in the nation, California relies upon the federal government to help with disaster preparedness, response, and recovery. The increase in the number of natural disasters and their growing costs affect the ability of federal agencies to respond. And the most important tool in mitigating flood risk—flood insurance—relies on an insolvent National Flood Insurance Program that will surely be hit hard by Florence.

Second, while it is tempting for Californians to write off Florence as a weather problem that affects the Gulf Coast and Atlantic states, this would be a mistake. We have our own hurricane-equivalents here, called atmospheric rivers. These can produce rainfall rates similar to those found in hurricanes, and they are responsible for most of our floods.

California is no stranger to extreme floods that rival hurricanes in terms of damages. The Great Flood of 1861‒62 affected the entire state and turned the Central Valley into a lake. If that same flood were to happen today, studies by the US Geological Survey suggest that more than $700 billion in damages would occur (equal to all the damages from all hurricanes nationwide in the past 18 years) and more than 1.5 million Californians would be displaced. Research by Daniel Swain, a climate scientist at UCLA, suggests that the risk of this scale of flooding is increasing as global warming intensifies. Indeed, his work has shown that the probability of a flood similar to the 1861‒62 flood occurring in California by mid-century is greater­ than the probability that it won’t.

Florence is a sobering hurricane that will likely be one of the worst in history. California would do well to heed some of its key lessons. As discussed in our recent report and highlighted by California’s Fourth Climate Assessment, flood risk is increasing due to climate warming. The 2017 crisis at Oroville Dam is an expensive reminder that California needs to upgrade its aging water management infrastructure. This will require finding new and innovative ways to fund flood management improvements.

California should also expand its efforts to steer new development away from high flood-risk areas through better land-use planning that incorporates increasing risk.

No matter how well California prepares, there will always be floods that overwhelm defenses, damage homes and businesses, and threaten lives. The state needs to continue to improve emergency preparations for floods and to encourage those who live in areas at risk of flooding to purchase insurance.

California has been a leader in reducing its contribution of greenhouse gases. But more work is needed to ensure its water supply and flood management systems are able to withstand a more volatile climate. California must act now to weather floods of the future.