Video: Understanding Poverty in California

[vc_row][vc_column][vc_column_text]

Despite a booming economy, millions of Californians live in or near poverty. In this video, PPIC research associate Tess Thorman gives an overview of poverty and child poverty in the state, using the latest figures from the California Poverty Measure (CPM).

The CPM is a joint research effort by PPIC and the Stanford Center on Poverty and Inequality that provides a comprehensive look at economic well-being in our state. By accounting for cost of living differences across the state as well as earnings and other family resources—including safety net benefits—the CPM offers valuable insights into the ability of Californians to meet basic needs and be financially secure.[/vc_column_text][/vc_column][/vc_row][vc_row visibility=”hidden-phone”][vc_column][vc_video link=”https://youtu.be/tPh4xE7QLGo” el_width=”70″ align=”center”][/vc_column][/vc_row][vc_row visibility=”visible-phone”][vc_column][vc_video link=”https://youtu.be/tPh4xE7QLGo”][/vc_column][/vc_row][vc_row][vc_column][vc_column_text]To learn more about poverty in California, visit ppic.org/poverty.[/vc_column_text][/vc_column][/vc_row]

Planning for a Drier Future in the Colorado River Basin

The Colorado River has experienced decades of over-allocation of its waters, making it harder to address the added challenges that climate change is bringing. The recently adopted Drought Contingency Plan (DCP) was an important step toward addressing the basin’s chronic water shortages, but more work is needed to prepare for a hotter, drier future. We talked to Doug Kenney—director of the Western Water Policy Program at the University of Colorado and a member of the PPIC Water Policy Center research network―about managing the basin for long-term water sustainability. Kenney organized a conference in June that covered these issues in depth.
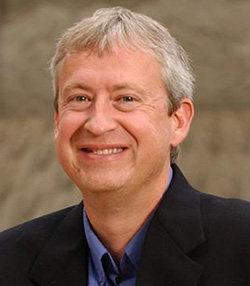
Photo of Doug KenneyPPIC: Talk about the basin’s over-allocation problem.

Doug Kenney: The current problem with the river’s water budget is in the lower basin. For much of this century, California, Arizona, Nevada, and Mexico have consistently pulled about 1.2 million acre-feet more water out of Lake Mead than enters it each year. That’s basically five years of water supply for Las Vegas. You can get away with that much overuse by drawing down reservoir storage—which is what we’ve been doing—but that’s not sustainable. So we need to accelerate efforts to scale back consumption. That’s what the DCP was designed to do—it’s mandated belt tightening.

In the upper basin states it’s a very different situation—water use in Colorado, New Mexico, Utah, and Wyoming is currently at a stable and reasonable level. But future use is expected to increase, while natural inflows are declining as the region continues to warm from climate change. The upper basin states can legally develop more water supplies, but the reality is that water isn’t likely to be reliably available. There’s a disconnect between how much water the upper basin states were promised and how much actually exists.

PPIC: What is needed to achieve sustainable management in the basin?

DK: The primary emphasis has to be on using less water. Given that most water in the basin is used for agriculture, that sector has the greatest potential to save water. Paying farmers to fallow some fields is probably the most appealing option. However, there are legal, financial, and cultural issues to deal with.

In most of the west, efforts to incentivize agricultural demand management have been pretty primitive—with the exception of Southern California, which has had major success trimming farm water use in the Imperial and Palo Verde water districts. Those programs aren’t perfect, but they are happening at a sufficiently large scale to make a significant contribution to addressing the regional water budget problem. In most other places in the basin, these types of programs are much smaller, and there’s a lot of skepticism about scaling these efforts up. The politics are very delicate, as these mechanisms would reallocate water from farms to cities. But you can’t ignore the math or the economics. Some sort of agricultural demand management will have to be a core element of any sustainable water use plan in the basin. The challenge is to do it in a way that is fair and protects the socioeconomic fabric of rural areas.

PPIC: What’s next for the basin’s water planning?

DK: The next steps are big ones. The operation of Powell and Mead is governed by interim guidelines that expire after 2026. Some key arrangements between Mexico and the US also expire then. The states are required to begin negotiating new rules to replace the expiring arrangements no later than 2020. This figures to be a really complex and very politically difficult negotiation, so there’s real interest in setting up the right process to get it done. That’s where many of us are focused right now—identifying the process that gives the negotiations the best chance for success.

PPIC: The DCP didn’t address ecological and health problems at California’s troubled Salton Sea. What’s next for the sea?

DK: At this point it’s about figuring out how to pay for what everyone knows has to be done. I’m convinced we’ve reached a turning point on the Salton Sea. There’s momentum within and outside of California to find a solution. It was disappointing that the DCP didn’t address the issues, but it wasn’t due to a lack of concern or effort—essentially, folks ran out of time. But I hear a consistent message from every sector and state: we need a solution for the sea. There’s an old maxim in this basin: anything is possible if all seven states can agree to it. I’m hopeful that this can apply to the Salton Sea crisis

A New Look at College Enrollment Rates

California’s K–12 districts and schools are responsible for preparing students for college and career. But until recently, data has not been available to determine their success in actually getting students to apply to and attend college. Now, however, the California Department of Education has published data on college enrollment among recent high school graduates, using information from the National Student Clearinghouse. Initial findings show wide disparities in college enrollment across racial/ethnic groups and throughout the state’s regions—including within school districts themselves.

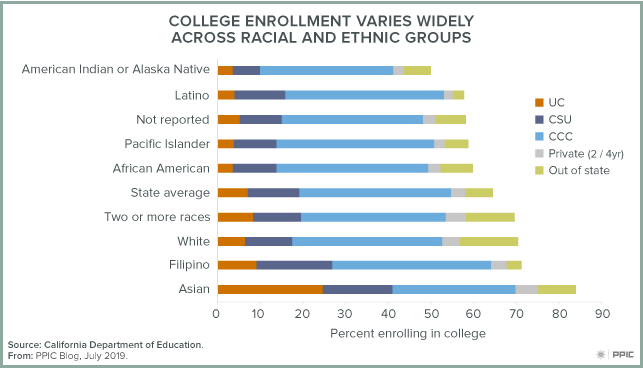
According to the data, about 65% of California’s high school graduates attended college within a year of graduation in 2017–2018 (the most recent data available). But there are wide differences. For instance, Latino students—the majority of K–12 students—have a relatively low rate of college enrollment (58%), while rates for Asian American students (84%) are quite high. Asian American students are also much more likely to attend a University of California campus than other students. African-American students have a similar enrollment pattern as Latino students, except many more opt to go to college in another state. White and multi-racial students also enroll in out-of-state colleges or universities at rates above the state average.

Figure - College Enrollment Varies Widely Across Racial and Ethnic Groups

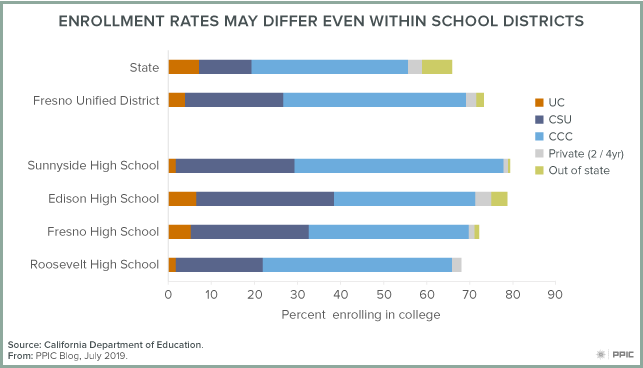
Differences by school, district, and region are also available in the data (you can check your local district’s college enrollment rates here). Fresno provides a good example. Fresno County has higher college enrollment rates than the state, but students are much less likely to attend a UC and much more likely to attend a CSU or community college—perhaps because of the strong presence of Fresno State and local community colleges, as well as the greater distance to most UC campuses.

Figure - Enrollment Rates May Differ Even Within School Districts

Among the many districts in Fresno County, students from Fresno Unified School District are relatively more likely than others to attend college. But there is plenty of variation within the district. Sunnyside High has very high enrollment rates; however, rates are lower than the district average for UC and much higher for community college. By contrast, Edison High has much higher than district average enrollment at UC, private, and out-of-state schools.

Enrolling in college or university is a goal for many high school students. But because the existing K–12 and higher education data systems are not linked in California, this is the first time in over a decade that the state has good information about whether high school students are meeting that goal. With the passage of SB75, California has begun the process of building a statewide longitudinal data system that will connect the existing student data systems between K–12 and higher education. The new enrollment data provide the first glimpse of the promise of a connected education data system. Linking data across segments could yield useful new information—such as whether students were successful in their college courses—which would fit nicely in the state’s dashboard on college readiness.

Motivating Californians to Fill Out the 2020 Census

The 2020 Census will determine the distribution of billions of dollars in federal funds and the accuracy of political representation at the local, state, and federal levels. Emphasizing the benefits to local communities is likely the best way to encourage participation and counteract the concerns many Californians have about confidentiality.

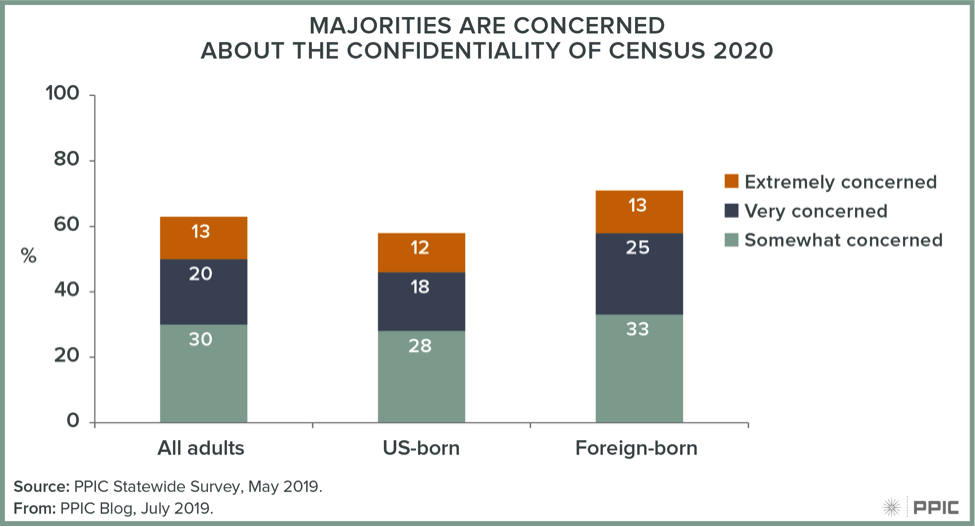
The latest PPIC Statewide Survey shows that 63% of Californians are concerned about whether the Census Bureau will keep their responses confidential, as the law requires. The concern is more acute among Latinos (74%) and African Americans (74%) than among Asian Americans (64%) or whites (52%). Immigrants are also much more likely to be concerned than US-born residents.

Figure: Majorities Are Concerned About the Confidentiality of Census 2020
The Census Bureau conducted an extensive survey and a set of focus groups to identify key reasons for people’s possible reluctance to participate in the census, as well as potential motivating factors that could improve participation. The focus groups revealed that merely informing people of the Census Bureau’s data protection policies was unlikely to assuage concerns.

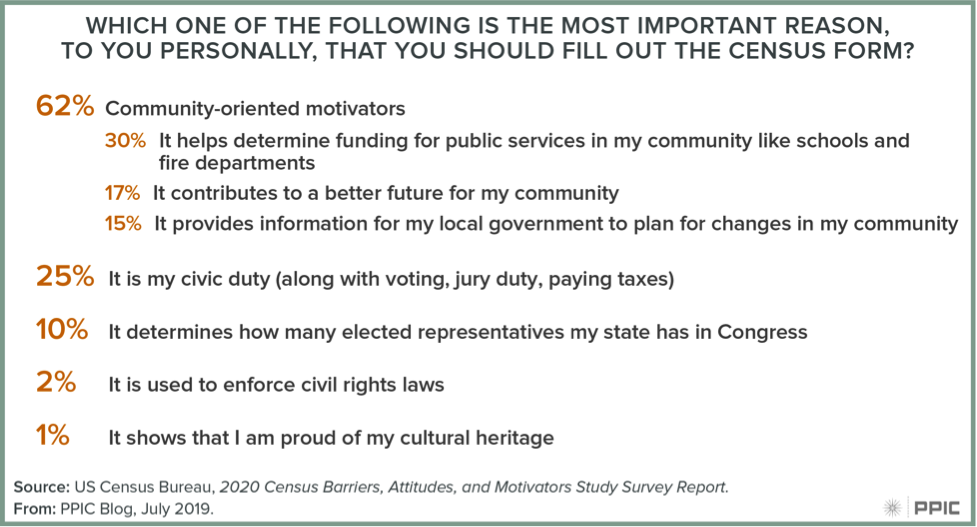
Focus group participants across all demographic groups identified the census’s role in providing federal funding for communities as the main motivator for responding to the census. And 62% of survey respondents said that benefits to the community—determining funding (30%), contributing to a better future for the community (17%), and providing information for local planning (15%)—are the most important reason to fill out the census.

Figure: Most Important Reason to Fill Out the Census Form

But fewer than half of survey respondents knew that the census is used to determine local funding levels, suggesting that this information could go a long way toward motivating participation. Focus group participants—who were chosen from demographic groups deemed likely to respond at low rates—also indicated that hearing directly from trusted voices in their own communities would be important.

Community organizations and elected officials are already acting on this information. On April 1, Los Angeles city and county officials convened a rally to promote the census, emphasizing the link to federal tax dollars for local programs. The Hispanic Federation’s messaging also highlights the census’s role in allocating federal funds.

More efforts are underway. Governor Newsom has pledged an investment of $187 million for outreach activities to boost participation. Meanwhile, the California Complete Count Office has begun issuing grants to help local organizations communicate directly with hard-to-count populations.

Focusing on local funding and community benefits is a promising approach, but a strong outreach strategy will have to go further. A complete and accurate count will likely depend on hard-to-count populations working to develop and deliver the most effective messages for their own communities.

Record Growth Puts Money in the Bank for California

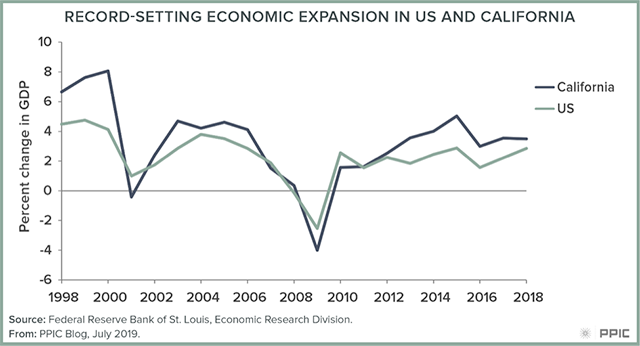
This July marks the longest period of economic expansion in US history. For 121 months and counting, the national and state economies have experienced continuous growth.

Figure: Record-Setting Economic Expansion in US and California

One consequence of this sustained economic growth? An increasing stream of tax revenue flowing into the state’s treasury. This, in turn, has shaped a new state budget that contains record-breaking levels of spending.

In terms of fiscal sustainability, however, the most intriguing element of the new budget may be the dollars that weren’t spent. The budget that the legislature passed and governor just signed includes total budget reserves of more than $20 billion—also a record for the state.

The continued accumulation of budget reserves represents important progress toward preparing the state for an economic slowdown. Because of California’s tax structure, recessions hit the state’s budget particularly hard. Past recessions have caused deep drops in the level of General Fund dollars available, leading to a combination of spending cuts, tax increases, and borrowing to balance the state’s budget.

Building budget reserves should enable California to reduce the impact of a recession. Our estimates suggest that the current level of reserves would allow the state to weather the impact of a mild recession. However, they would be insufficient in the face of a moderate to severe downturn. In other words, there is still work to be done.

None of this matters if the economy never slows down. Just because the economy has gone up for so long, doesn’t mean it must fall—there is no equivalent to gravity when it comes to economics. But history suggests that recessions have a way of interrupting periods of growth. And there are some signs that clouds are gathering on the economic horizon: bond rate curves, drops in consumer confidence, and uncertainty surrounding tariffs and trade. At the same time, the stock market just finished a very positive first half of the year.

Forecasting the timing of the next recession is a much more difficult proposition than asserting that there will be one. The same could be said of California’s earthquakes. But as with earthquakes, the fact that we don’t know exactly when the next recession will hit shouldn’t stop the state from preparing for it.

Budget Takes Baby Steps Toward Special Education Reform

The new 2019–20 state budget recently signed by Governor Newson provides significant new funding for K–12 special education programs. It also makes substantial revisions to the state funding model for services to students with disabilities—and signals policymakers’ intent to make even more extensive changes in this policy area next year.

Passage of the Local Control Funding Formula (LCFF) in 2013 generated questions about the fiscal and planning effects on local special education programs. Our work in this area (in 2016 and 2018) has found that district special education costs have risen much faster than state funding over the previous decade and has recommended several changes to make state funding more responsive to local costs. The new state budget includes two of our key recommendations:

  • Equalize special education funding. This year, $153 million was added to partially equalize per-pupil special education funding levels. Our report recommends equalizing local per-pupil funding rates up to the 90th percentile of current levels. Funding rates across Special Education Local Plan Areas (SELPAs) range from about $500 per pupil to more than $1,000. The new funding would bring the lowest local rate up to $557, which is about the 75th percentile of existing rates.
  • Fund early childhood special education. Another $493 million in this year’s budget will provide grants of about $9,000 for 3- and 4-year-olds who participate in special education preschool programs. State special education formulas fail to provide any state support for these children, and our reports conclude that the lack of funding could discourage districts from aggressively seeking children who could benefit from early services.

Because the new funding helps districts pay for their existing special education programs, these appropriations provide welcome fiscal relief. But the budget attaches a giant question mark to the long-term future of these new appropriations. Specifically, in 2020–21, the budget makes the two new grants conditional on broader special education reforms, and even holds out the possibility of revising those grants. Issues for further discussion include:

  • More changes to special education funding. Problems with the main special education funding formula were not addressed in this year’s budget. We have suggested the state peg annual budget increases to a better predictor of future costs, such as LCFF increases or past changes in special education costs.
  • Refining the role of SELPAs. We have also suggested giving districts greater leeway in determining how students with disabilities are educated, consistent with LCFF’s local control focus. SELPAs perform a wide range of services locally, including planning how students are served and supporting district special education programs that exhibit sub-par performance.
  • Improving local special education programs. The budget identifies two specific areas for attention: serving more students in their regular classroom (rather than in separate special education classes) and ensuring that student subgroups are not identified for special education in disproportionate numbers. By including this issue in the budget language, policymakers are signaling they want faster progress in these areas.

Health Care Access for California’s Immigrants

Governor Newsom is proposing to expand access to Medi-Cal—the state’s Medicaid program—for low-income young adults up to age 26, regardless of their immigration status. This could help a vulnerable segment of the immigrant population. Californians are signaling broad support.

Overall, immigrants make up about 27% of the state’s population and are less likely to have health insurance than US-born Californians. Immigrants are also less likely to have private insurance, partly due to differences in employment industries and income.

Figure - Health Care Coverage Rates are Lower For California Immigrants in All Age Groups

Documented immigrants—including those with green cards and visas—may qualify for Medi-Cal without being subject to the five-year waiting period required by federal law. They can also purchase private health plans through Covered California, the health insurance exchange that was created as part of the Affordable Care Act (ACA). However, most recently-arrived elderly immigrants are not eligible for Medicare because they have not paid Medicare taxes over a long enough period.

California offers a patchwork of health care options for undocumented immigrants, who are not covered by the ACA. For instance, low-income children and pregnant residents are eligible for Medi-Cal regardless of immigration status, and some counties include undocumented immigrants in programs for those who cannot afford medical care. Additional options for undocumented immigrants include community clinics, rural health clinics, emergency rooms, or a limited version of Medi-Cal for medical emergencies.

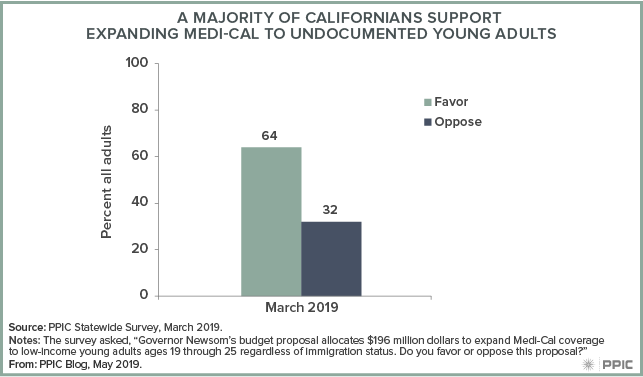
Californians support health care access for undocumented immigrants. In a 2015 PPIC Statewide Survey, a slim majority of Californians (54%) supported the idea of providing health care coverage to undocumented immigrants. In March 2019, about two-thirds (64%) expressed support for the governor’s proposed expansion of Medi-Cal coverage to low-income young adults, including those who are undocumented.

Figure - A Majority of Californians Support Expanding Medi-Cal to Undocumented Young Adults

The governor’s May budget revision delays implementation of the expansion, but it would still have an impact: by providing coverage to approximately 90,000 undocumented young adults in the first year, it could help make the health care landscape less complicated for an important share of California’s immigrant population.

California’s Digital Divide and the 2020 Census

The 2020 Census will be the first decennial census with a fully online component. Rather than mailing forms to every household, the US Census Bureau will instead send out postcards asking households to take the census online, hoping to achieve a 55% online response rate. Then, as in years past, census workers will visit those who did not respond and conduct in-person interviews.

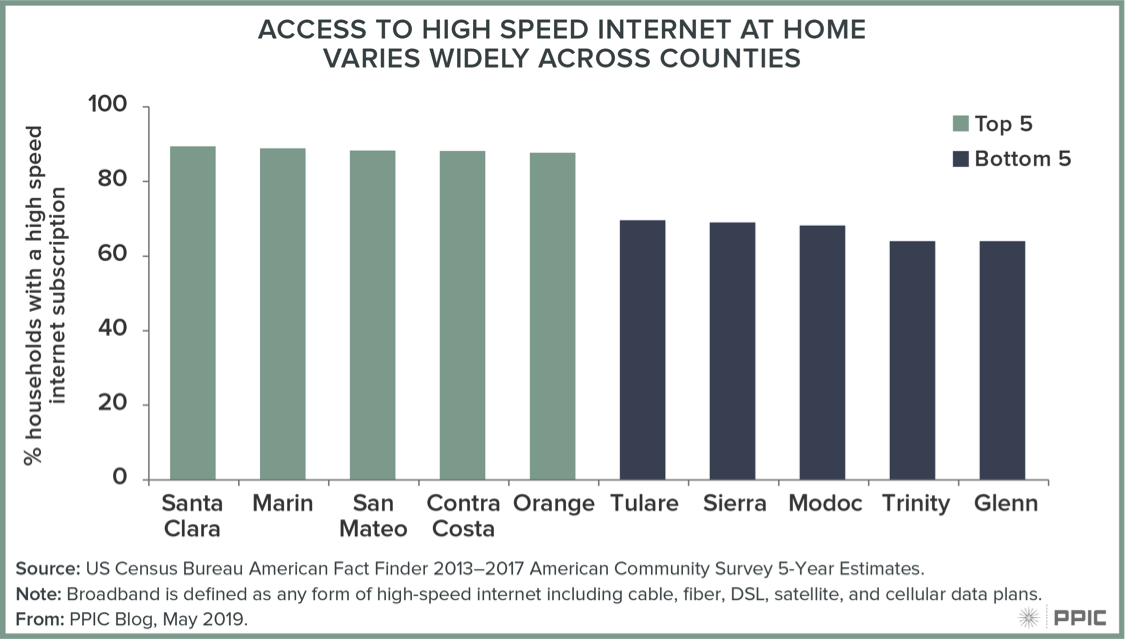
California’s size and diversity present unique challenges to this effort. One significant challenge lies in how many households report having reliable high speed internet—essential to completing the census online.

The contrasts across counties are stark. For example, according to the most recent estimates, more than 89% of households in Santa Clara County report having high speed access at home. In contrast, in Trinity, Glenn, Modoc, Sierra, Tulare, and Imperial Counties, more than 30% of households say they do not.

What’s more, these estimates actually understate the disparity. In the counties of Colusa, Sierra, Yuba, Tulare, and Plumas more than 15% of households report having high speed internet only through their cell phone data plans and no other source, and in 11 other counties at least 10% of households report the same.

Figure - Access to High Speed Internet at Home Varies Widely Across Counties

Of further concern is that these counties are the very ones that have been identified as being hard to count. In addition to sparse internet access, communities may be hard to count because they contain higher rates of historically undercounted groups, such as noncitizens and African Americans, or because large shares of their residents rent rather than own their households.

These challenges are real, but California is working hard to overcome them. State agencies were allocated over $100 million in 2018-19—with another $54 million proposed—so they may partner with the Census Bureau to help identify hard to count communities, encourage participation, and better ensure an accurate count of all Californians.

Interactive: Will Housing Costs Drive Californians Away?

[vc_row][vc_column][vc_column_text]Home values and rental markets in California are among the most expensive in the nation, and supply shortages continue to put upward pressure on housing prices. Over the last decade, the state averaged fewer than 80,000 new homes annually—far below the estimated need of 180,000 additional units each year, according to a recent report from the California Department of Housing and Community Development.

In our March survey, we found that a record-high share of Californians (68%) believe that housing affordability is a big problem in their region, and 47% are seriously considering moving away from the part of the state they live in now due to housing costs.

The interactive below allows you to take a closer look at how interest in moving due to housing costs varies across demographic groups. For example, Los Angeles County residents (39%) are the most likely to say housing costs have made them seriously consider moving out of the state, with another 13% saying they’re considering moving elsewhere in California. Overall, half of coastal residents say they’re seriously thinking about moving away from where they live now.

Young adults are also much more likely to have considered moving than older residents. More than half (56%) of young adults age 18–34 have seriously thought about moving due to housing costs—including four in ten who have considered leaving the state—compared to 38% of adults over 55.

We hope this interactive sheds light on Californians’ perceptions of housing costs. As the new governor and state legislature work on their policy agendas for the year, the PPIC survey team will continue to monitor the issue of housing closely.[/vc_column_text][/vc_column][/vc_row][vc_row][vc_column][vc_raw_html]JTNDZGl2JTIwY2xhc3MlM0QlMjd0YWJsZWF1UGxhY2Vob2xkZXIlMjclMjBpZCUzRCUyN3ZpejE1NTU3MDc3NzcyNTUlMjclMjBzdHlsZSUzRCUyN3Bvc2l0aW9uJTNBJTIwcmVsYXRpdmUlMjclM0UlM0Nub3NjcmlwdCUzRSUzQ2ElMjBocmVmJTNEJTI3aHR0cHMlM0ElMjYlMjM0NyUzQiUyNiUyMzQ3JTNCd3d3LnBwaWMub3JnJTI2JTIzNDclM0JibG9nJTI2JTIzNDclM0JpbnRlcmFjdGl2ZS13aWxsLWhvdXNpbmctY29zdHMtZHJpdmUtY2FsaWZvcm5pYW5zLWF3YXklMjclM0UlM0NpbWclMjBhbHQlM0QlMjclMjAlMjclMjBzcmMlM0QlMjdodHRwcyUzQSUyNiUyMzQ3JTNCJTI2JTIzNDclM0JwdWJsaWMudGFibGVhdS5jb20lMjYlMjM0NyUzQnN0YXRpYyUyNiUyMzQ3JTNCaW1hZ2VzJTI2JTIzNDclM0JNYSUyNiUyMzQ3JTNCTWFueUNhbGlmb3JuaWFuc0FyZVRoaW5raW5nb2ZNb3ZpbmdkdWV0b0hvdXNpbmdDb3N0cyUyNiUyMzQ3JTNCQ3Jvc3N0YWJzJTI2JTIzNDclM0IxX3Jzcy5wbmclMjclMjBzdHlsZSUzRCUyN2JvcmRlciUzQSUyMG5vbmUlMjclMjAlMkYlM0UlM0MlMkZhJTNFJTNDJTJGbm9zY3JpcHQlM0UlM0NvYmplY3QlMjBjbGFzcyUzRCUyN3RhYmxlYXVWaXolMjclMjAlMjBzdHlsZSUzRCUyN2Rpc3BsYXklM0Fub25lJTNCJTI3JTNFJTNDcGFyYW0lMjBuYW1lJTNEJTI3aG9zdF91cmwlMjclMjB2YWx1ZSUzRCUyN2h0dHBzJTI1M0ElMjUyRiUyNTJGcHVibGljLnRhYmxlYXUuY29tJTI1MkYlMjclMjAlMkYlM0UlMjAlM0NwYXJhbSUyMG5hbWUlM0QlMjdlbWJlZF9jb2RlX3ZlcnNpb24lMjclMjB2YWx1ZSUzRCUyNzMlMjclMjAlMkYlM0UlMjAlM0NwYXJhbSUyMG5hbWUlM0QlMjdzaXRlX3Jvb3QlMjclMjB2YWx1ZSUzRCUyNyUyNyUyMCUyRiUzRSUzQ3BhcmFtJTIwbmFtZSUzRCUyN25hbWUlMjclMjB2YWx1ZSUzRCUyN01hbnlDYWxpZm9ybmlhbnNBcmVUaGlua2luZ29mTW92aW5nZHVldG9Ib3VzaW5nQ29zdHMlMjYlMjM0NyUzQkNyb3NzdGFicyUyNyUyMCUyRiUzRSUzQ3BhcmFtJTIwbmFtZSUzRCUyN3RhYnMlMjclMjB2YWx1ZSUzRCUyN25vJTI3JTIwJTJGJTNFJTNDcGFyYW0lMjBuYW1lJTNEJTI3dG9vbGJhciUyNyUyMHZhbHVlJTNEJTI3bm8lMjclMjAlMkYlM0UlM0NwYXJhbSUyMG5hbWUlM0QlMjdzdGF0aWNfaW1hZ2UlMjclMjB2YWx1ZSUzRCUyN2h0dHBzJTNBJTI2JTIzNDclM0IlMjYlMjM0NyUzQnB1YmxpYy50YWJsZWF1LmNvbSUyNiUyMzQ3JTNCc3RhdGljJTI2JTIzNDclM0JpbWFnZXMlMjYlMjM0NyUzQk1hJTI2JTIzNDclM0JNYW55Q2FsaWZvcm5pYW5zQXJlVGhpbmtpbmdvZk1vdmluZ2R1ZXRvSG91c2luZ0Nvc3RzJTI2JTIzNDclM0JDcm9zc3RhYnMlMjYlMjM0NyUzQjEucG5nJTI3JTIwJTJGJTNFJTIwJTNDcGFyYW0lMjBuYW1lJTNEJTI3YW5pbWF0ZV90cmFuc2l0aW9uJTI3JTIwdmFsdWUlM0QlMjd5ZXMlMjclMjAlMkYlM0UlM0NwYXJhbSUyMG5hbWUlM0QlMjdkaXNwbGF5X3N0YXRpY19pbWFnZSUyNyUyMHZhbHVlJTNEJTI3eWVzJTI3JTIwJTJGJTNFJTNDcGFyYW0lMjBuYW1lJTNEJTI3ZGlzcGxheV9zcGlubmVyJTI3JTIwdmFsdWUlM0QlMjd5ZXMlMjclMjAlMkYlM0UlM0NwYXJhbSUyMG5hbWUlM0QlMjdkaXNwbGF5X292ZXJsYXklMjclMjB2YWx1ZSUzRCUyN3llcyUyNyUyMCUyRiUzRSUzQ3BhcmFtJTIwbmFtZSUzRCUyN2Rpc3BsYXlfY291bnQlMjclMjB2YWx1ZSUzRCUyN3llcyUyNyUyMCUyRiUzRSUzQ3BhcmFtJTIwbmFtZSUzRCUyN2ZpbHRlciUyNyUyMHZhbHVlJTNEJTI3cHVibGlzaCUzRHllcyUyNyUyMCUyRiUzRSUzQyUyRm9iamVjdCUzRSUzQyUyRmRpdiUzRSUyMCUyMCUyMCUyMCUyMCUyMCUyMCUyMCUyMCUyMCUyMCUyMCUyMCUyMCUyMCUyMCUzQ3NjcmlwdCUyMHR5cGUlM0QlMjd0ZXh0JTJGamF2YXNjcmlwdCUyNyUzRSUyMCUyMCUyMCUyMCUyMCUyMCUyMCUyMCUyMCUyMCUyMCUyMCUyMCUyMCUyMCUyMCUyMCUyMCUyMCUyMHZhciUyMGRpdkVsZW1lbnQlMjAlM0QlMjBkb2N1bWVudC5nZXRFbGVtZW50QnlJZCUyOCUyN3ZpejE1NTU3MDc3NzcyNTUlMjclMjklM0IlMjAlMjAlMjAlMjAlMjAlMjAlMjAlMjAlMjAlMjAlMjAlMjAlMjAlMjAlMjAlMjAlMjAlMjAlMjAlMjB2YXIlMjB2aXpFbGVtZW50JTIwJTNEJTIwZGl2RWxlbWVudC5nZXRFbGVtZW50c0J5VGFnTmFtZSUyOCUyN29iamVjdCUyNyUyOSU1QjAlNUQlM0IlMjAlMjAlMjAlMjAlMjAlMjAlMjAlMjAlMjAlMjAlMjAlMjAlMjAlMjAlMjAlMjAlMjAlMjAlMjAlMjBpZiUyMCUyOCUyMGRpdkVsZW1lbnQub2Zmc2V0V2lkdGglMjAlM0UlMjA4MDAlMjAlMjklMjAlN0IlMjB2aXpFbGVtZW50LnN0eWxlLndpZHRoJTNEJTI3MTAwJTI1JTI3JTNCdml6RWxlbWVudC5zdHlsZS5oZWlnaHQlM0QlMjhkaXZFbGVtZW50Lm9mZnNldFdpZHRoJTJBMC43NSUyOSUyQiUyN3B4JTI3JTNCJTdEJTIwZWxzZSUyMGlmJTIwJTI4JTIwZGl2RWxlbWVudC5vZmZzZXRXaWR0aCUyMCUzRSUyMDUwMCUyMCUyOSUyMCU3QiUyMHZpekVsZW1lbnQuc3R5bGUud2lkdGglM0QlMjcxMDAlMjUlMjclM0J2aXpFbGVtZW50LnN0eWxlLmhlaWdodCUzRCUyOGRpdkVsZW1lbnQub2Zmc2V0V2lkdGglMkExLjc3JTI5JTJCJTI3cHglMjclM0IlN0QlMjBlbHNlJTIwJTdCJTIwdml6RWxlbWVudC5zdHlsZS53aWR0aCUzRCUyNzEwMCUyNSUyNyUzQnZpekVsZW1lbnQuc3R5bGUubWluSGVpZ2h0JTNEJTI3NzgwcHglMjclM0J2aXpFbGVtZW50LnN0eWxlLm1heEhlaWdodCUzRCUyOGRpdkVsZW1lbnQub2Zmc2V0V2lkdGglMkExLjc3JTI5JTJCJTI3cHglMjclM0IlN0QlMjAlMjAlMjAlMjAlMjAlMjAlMjAlMjAlMjAlMjAlMjAlMjAlMjAlMjAlMjAlMjAlMjAlMjAlMjAlMjAlMjB2YXIlMjBzY3JpcHRFbGVtZW50JTIwJTNEJTIwZG9jdW1lbnQuY3JlYXRlRWxlbWVudCUyOCUyN3NjcmlwdCUyNyUyOSUzQiUyMCUyMCUyMCUyMCUyMCUyMCUyMCUyMCUyMCUyMCUyMCUyMCUyMCUyMCUyMCUyMCUyMCUyMCUyMCUyMHNjcmlwdEVsZW1lbnQuc3JjJTIwJTNEJTIwJTI3aHR0cHMlM0ElMkYlMkZwdWJsaWMudGFibGVhdS5jb20lMkZqYXZhc2NyaXB0cyUyRmFwaSUyRnZpel92MS5qcyUyNyUzQiUyMCUyMCUyMCUyMCUyMCUyMCUyMCUyMCUyMCUyMCUyMCUyMCUyMCUyMCUyMCUyMCUyMCUyMCUyMCUyMHZpekVsZW1lbnQucGFyZW50Tm9kZS5pbnNlcnRCZWZvcmUlMjhzY3JpcHRFbGVtZW50JTJDJTIwdml6RWxlbWVudCUyOSUzQiUyMCUyMCUyMCUyMCUyMCUyMCUyMCUyMCUyMCUyMCUyMCUyMCUyMCUyMCUyMCUyMCUzQyUyRnNjcmlwdCUzRQ==[/vc_raw_html][/vc_column][/vc_row]

Video: Emergency Department Use in California

Hospital emergency departments (EDs) are an important part of California’s health care system. They are sometimes called the safety net of the safety net because they provide care to all comers. Policymakers, health plans, and health providers have long focused on ED use, partly because it serves as a proxy for lack of access to other, less costly forms of health care. So how has the expansion of insurance coverage under the Affordable Care Act (ACA) affected ED use in California? At an event last week in Sacramento, PPIC researcher Shannon McConville outlined a new PPIC report that addresses this question, and a panel of experts offered their perspectives on recent ED trends.

While many predicted that coverage expansion would reduce ED use by providing access to other kinds of medical care, such as primary care physicians, some worried that because insurance coverage typically reduces patients’ out-of-pocket costs, the ACA would increase ED use. The good news is that the PPIC report estimates that ED use rates would be higher in the absence of the ACA. But ED use statewide has been increasing for the past decade. To get a sense of how recent trends in ED use are being experienced and addressed around the state, PPIC convened a panel of experts.

All of the panelists highlighted the importance of finding out why people are using EDs. Some frequent ED users may not know about other ways to get medical care, while others may have behavioral or mental health issues that could be addressed more effectively by other kinds of care—from housing assistance to substance abuse programs. As Sara Kate Levin, medical director for Contra Costa Health Services, put it, “What are the unmet social needs that are driving a lot of this high utilization?”

But filling information gaps and addressing behavioral and mental health issues does not solve all ED use problems. In many areas, there is a scarcity of primary care doctors and urgent care clinics, and many patients cannot take time off to go to medical appointments during the workday. Moreover, primary care doctors sometimes refer their privately insured patients to EDs, in part so they won’t have to wait for tests.

This range of issues points to what Renee Hsia, an ED physician at Zuckerberg San Francisco General Hospital and a professor of emergency medicine and health policy, called “the elephant in the room”: because the United States has “a very market-based approach to health care,” there are two very different stories about ED use. On the one hand, EDs in affluent areas broadcast their availability and convenience. On the other hand, there are long waits for treatment at EDs serving low-income areas. “In some areas, your ER is a revenue center . . . and in some places, where you don’t have paying patients, your ER is a cost center.”

Jennifer Rasmussen, vice president of health care services at Molina Healthcare of California, highlighted the geographical differences across the state that make it difficult to find “one size fits all” solutions. She pointed out that Molina serves Imperial and San Bernardino Counties, “a vast geography” with fewer social services than a dense urban area has to offer. In other words, “a solution for Imperial County is not going to be the same as a solution for San Francisco.”